13 – 17 April 2026
Weekly Trade Commentary
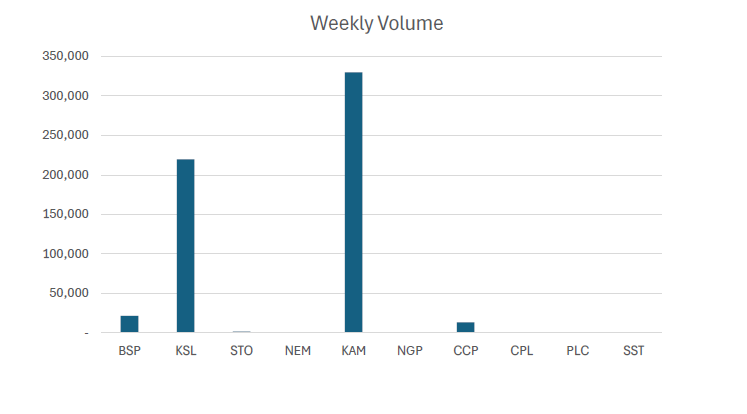
- Last week saw 5 stocks traded on the local market with a total trading value of K2,222,857.70.
- BSP traded 21,487 shares steady at K27.50.
- KSL traded 219,715 shares steady at K4.00.
- STO traded 1,329 shares high by 50t closing the week-off at K22.00.
- KAM traded 329,949 shares low by 10t closing at K2.00.
- Lastly, CCP traded 13,390 shares steady at K4.66.
WEEKLY MARKET REPORT | 13 April, 2026 – 17 April, 2026
| STOCK | WEEKLY VOLUME | CLOSING PRICE | VALUE | BID | OFFER | CHANGE | % CHANGE |
|---|---|---|---|---|---|---|---|
| BSP | 21,487 | 27.50 | 590,892.50 | 27.50 | 27.70 | – | – |
| KSL | 219,715 | 4.00 | 878,860.00 | 4.02 | 4.10 | – | – |
| STO | 1,329 | 22.00 | 29,238.00 | 22.00 | – | 0.50 | 2.33% |
| NEM | – | 490.00 | – | – | – | – | – |
| KAM | 329,949 | 2.00 | 661,469.80 | 2.00 | – | (0.10) | (4.76%) |
| NGP | – | 1.35 | – | 1.35 | – | – | – |
| CCP | 13,390 | 4.66 | 62,397.40 | 4.66 | – | – | – |
| CPL | – | 0.79 | – | – | 0.79 | – | – |
| PLC | – | 1.10 | – | – | 1.08 | – | – |
| SST | – | 50.00 | – | – | – | – | – |
| 585,870 | TOTAL | 2,222,857.70 | 1.87% |
Key takeaways:
- Market Announcement: KAM – NTA as at 31 March 2026 Download >>
- Market Announcement: PLC – Notification regarding unquoted securities Download >>
- Market Announcement: NEM – Seismic Activity Near Cadia Download >>
- Market Announcement KSL – Updated Appendix 2B Notification of change to the number of securities on issue Download >>
- Market Announcement: KSL – Appendix 10B Notice of change in directors or CEO interests Download >>
- Market Announcement: KSL – ASX letter and TIP presentation Download >>
- Market Announcement: STO – 2026 Santos AGM Addresses Download >>
- Market Announcement: STO – Results of Meeting Download >>
- NEM – Update on Cadia Operations Download >>
- Market Announcement: PLC – Appendix 3Y – 3 Directors Download >>
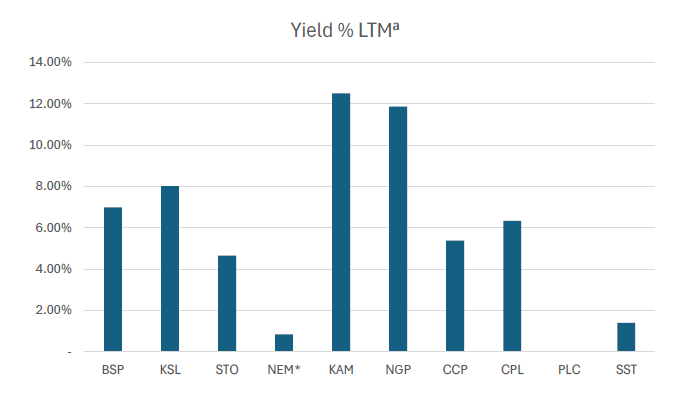
WEEKLY YIELD CHART | 13 April, 2026 – 17 April, 2026
| Stock | Number Issued of Shares | Market Cap | 2023 Interim Div | 2023 Final Div | 2024 Interim Div | 2024 Final Div | 2025 Interim Div | 2025 Final Div | Yield % LTM |
|---|---|---|---|---|---|---|---|---|---|
| BSP | 467,317,665 | 12,851,235,788 | K0.370 | K1.060 | K0.450 | K1.210 | K0.500 | K1.380 | 6.84% |
| KSL | 294,332,296 | 1,177,329,184 | K0.100 | K0.160 | K0.106 | K0.155 | K0.126 | K0.193 | 7.98% |
| STO | 3,261,616,703 | 71,755,567,466 | K0.310 | K0.660 | K0.506 | K0.414 | K0.559 | K0.443 | 4.55% |
| NEM* | 1,097,000,000 | 537,530,000,000 | – | – | – | K2.110 | K2.110 | (USD) $0.260 | 0.84% |
| KAM | 53,259,588 | 106,519,176 | K0.120 | – | K0.200 | – | K0.250 | – | 12.50% |
| NGP | 45,890,700 | 61,952,445 | K0.030 | – | K0.040 | K0.120 | K0.040 | – | 11.85% |
| CCP | 307,931,332 | 1,434,960,007 | K0.110 | K0.130 | K0.120 | K0.121 | K0.121 | K0.130 | 5.39% |
| CPL | 206,277,911 | 162,959,550 | K0.050 | – | – | – | K0.050 | – | 6.33% |
| PLC | 858,075,186 | 943,882,705 | – | – | – | – | – | – | – |
| SST | 31,008,237 | 1,550,411,850 | K0.350 | K0.600 | K0.400 | K0.300 | K0.400 | – | 1.40% |
| TOTAL | 627,574,818,170 | 5.66% |
a LTM = Last Twelve Months. We have calculated yields based on most recently declared
interim and final dividends.
* NEM pays quarterly dividends. We have added last 4 payments at current FX rates.
* NEM dividends in $USD until PGK rate is announced.
*PLC now added
Dividend yield – is calculated by dividing a company’s annual dividends per share by its current share price and expressing the result as a percentage.

Domestic Markets Department – Money Markets Operations Unit
Auction Number: 15-APR-26 / GOI / Government Treasury Bill
Settlement Date: 17-APR-26
Amount on Offer: K157.000 million
| TERMS | ISSUE ID 2025 / 63 | ISSUE ID 2025 / 91 | ISSUE ID 2025 / 4741 182 | ISSUE ID 2025 / 4700 273 | ISSUE ID 2025 / 4743 364 | TOTAL |
|---|---|---|---|---|---|---|
| Weighted Average Yield | 0.000 | 0.00% | 5.38% | 5.56% | 5.55% | |
| Amount on Offer Kina Million | 0.000 | 0.000 | 10.000 | 30.000 | 177.000 | 157.000 |
| Bids Received Kina Million | 0.000 | 0.000 | 39.200 | 76.000 | 327.600 | 487.800 |
| Successful Bids Kina Million | 0.000 | 0.000 | 14.200 | 41.000 | 185.500 | 240.700 |
| Overall Auction OVER-SUBSCRIBED by | 0.000 | 0.000 | 29.200 | 46.000 | 255.600 | 330.800 |
Domestic Markets Department – Money Markets Operations Unit
Auction Number: 17-MAR-26 / GOB / Government Bond
Settlement Date: 20-MAR-26
Amount on Offer: K200.000 million
| SERIES | Amount on Offer (K’million) | Bids Received (K’million) | Successful Bids (K’million) | Successful Bids Yield | Weighted Average Rate (WAR) | Coupon Rate | Overall Auction Net Subscription |
|---|---|---|---|---|---|---|---|
| Issue ID 2026/5057 (3 years) | 30.000 | 33.45 | 23.45 | 5.75%-6.57% | 6.48% | 5.75% | K3.45 |
| Issue ID 2026/5058 (5 years) | 40.000 | 65.000 | 55.000 | 6.58%-6.89% | 6.80% | 6.00% | K25.000 |
| Issue ID 2026/5059 (7 years) | 50.000 | 68.000 | 68.000 | 6.25%-7.11% | 6.95% | 6.25% | K18.000 |
| Issue ID 2026/5060 (10 years) | 50.000 | 72.000 | 42.000 | 6.05%-7.23% | 7.14% | 6.50% | K22.000 |
| Issue ID 2026/5061 (15 years) | 30.000 | 42.000 | 12.000 | 7.46%-7.55% | 7.48% | 6.75% | K12.000 |
| TOTAL | 200.000 | 780.450 | 200.450 | K80.450 |
INVESTOR EDUCATION
Definition of Equity
- Ownership stake of a company (companies may pursue equity financing to raise money)
- Common and preferred stock (equity investment in a company)
- Real Estate properties (home equity)
- Based on market value of equity (market capitalization) or book value of equity (accounting)
How Equity Works
Owners of a company (whether public or private) have shares that legally represent their ownership in the company. Each share of the same class has the exact same rights and privileges as all other shares of the same class. This is part of the term’s meaning – equity meaning “equal”.
Companies can issue new shares by selling them to investors in exchange for cash. Companies use the proceeds from the share sale to fund their business, grow operations, hire more people, and make acquisitions. Once the shares have been issued, investors can buy and sell them from each other in the secondary market (how stocks normally trade on an exchange).
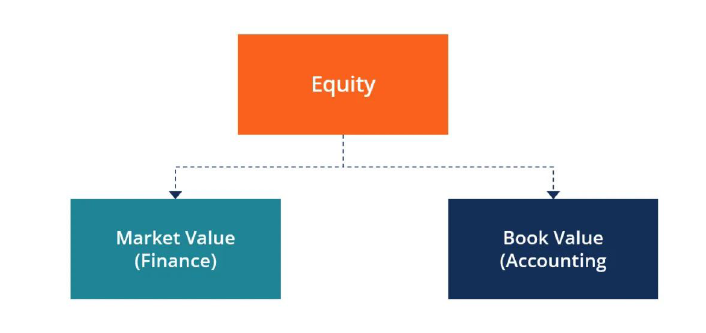
1. Market Value of Equity (Finance)
Financial analysts are typically concerned with the market value of equity, which is the current price or fair value they believe shares of the business are worth. Since finance professionals want to know how much of a return they can make on an investment, they need to understand how much the investment will cost them, and how much they believe they can sell it for.
2. Book Value of Equity (Accounting)
Accountants are concerned with recording and reporting the financial position of a company, and, therefore, focus on calculating the book value of equity. In order for the balance sheet to balance, the formula Equity = Assets – Liabilities must be true.
What we have been reading
NAVIGATING THE STRAIT OF HORMUZ

MONTHLY BELL – BELL POTTER
Rob Crookston, Strategist
When military conflict broke out on 28 February, the world’s most important energy chokepoint closed. The Strait of Hormuz, the narrow passage through which nearly 20% of global oil supplies flow each day, has been effectively shut to normal tanker traffic. To appreciate the severity of this, consider that previous landmark energy disruptions the Yom Kippur War, the Iranian Revolution, the Iran–Iraq War and the Gulf War each removed between 4% and 6% of global supply. The current closure is three to five times larger in magnitude than any of those historical precedents.
The initial oil price spike has grabbed headlines, but the more consequential story lies beneath: four structural transmission channels that will determine the 12-month market trajectory. Understanding them, and watching the right indicators, is what separates panic from prudent positioning. The oil shock itself is painful but limited. What lingers are the second-order effects transmitted through four channels. First, global growth: a sustained price spike acts as a consumption tax, squeezing disposable income, inflating input costs across freight and manufacturing, and compressing corporate margins worldwide. Second, inflation: while direct fuel-price effects are visible, the more insidious pressure comes from pass-through into freight and goods costs, embedding energy inflation into core CPI and inflation expectations and complicating central bank decision-making. Third, interest rates: the US Fed and RBA face a classic stagflationary bind — tighten and risk accelerating a slowdown; hold and risk de-anchoring inflation expectations. Any shift in that consensus would abruptly reprice the equity discount rate. Fourth, risk premium: it is the volatile interaction between energy-driven inflation, constrained central banks, and deteriorating earnings expectations that pushes volatility higher and demands a larger equity risk premium.
The Dashboard: Amber, Not Red
The critical question for investors is not whether conditions are difficult — they clearly are — but whether the financial system is breaking. The evidence, so far, says no. Inflation expectations are instructive: while the 1-year forward rate has risen to approximately 3.4%, longer-dated breakevens remain anchored. This tells us three things: the Fed’s credibility is intact, markets are not pricing permanent demand destruction, and the shock is still being treated as transitory. Meanwhile, the Brent crude futures curve has shifted into backwardation with spot prices above $100, but the late-2026 curve is pricing near $85, signaling that the market views this as a supply disruption rather than a structural loss of capacity. US high yield credit spreads have widened but remain well below historical stress levels. The DXY has risen — a flight-to-safety signal — but has not reached the levels associated with a global liquidity crunch. The US Treasury yield curve is bear-flattening, though it remains in positive territory: the market is tempering growth expectations, but it is not pricing recession. European gas prices have nearly doubled year-to-date, raising concerns around Qatar LNG supply, yet they remain a fraction of the extreme levels seen during the Russia-Ukraine energy crisis of 2022.
Searching for the Off-Ramp
Our base case remains de-escalation, underpinned by two structural forces pulling in the same direction. The US political calendar. With the 2026 midterms approaching, prolonged Middle East entanglement is not a vote-winner. Higher petrol prices directly undercut an administration that campaigned on lower inflation. Notably, evidence from late March suggests President Trump is actively seeking a diplomatic off-ramp. The administration’s pattern, escalatory rhetoric followed by negotiated exit, is consistent with this dynamic. Iran’s economic capacity. The country’s economy was already under significant strain before the conflict began. The incentive structure for a face-saving diplomatic resolution is real on both sides.
We acknowledge the risks. The involvement of Hezbollah and Houthis and direct attacks on energy infrastructure represent genuine escalation steps. Yet even with these developments, regional history consistently shows that sharp spikes in hostilities often precede exhausted consolidation and eventual negotiation. In a near-term resolution scenario, the economic damage is recoverable: oil pulls back, the Fed characterizes the CPI spike as transitory (caused by a clearly identified supply disruption) and the fundamental backdrop that opened 2026 constructively reasserts itself.
History’s Warning: The Window Is Narrow
The Gulf War offers an instructive parallel. Equities bottomed in October 1990, precisely when oil prices were at their peak and news flow was at its most alarming. By the time hostilities officially ended in early 1991, a sustained recovery was already well underway. Investors price conditions 12 months ahead — they do not wait for confirmation. If credible de-escalation signals emerge, the window to add risk will be narrow and will close quickly. This is the most powerful argument against a defensive approach.
The Recommendation: Hold the Barbell
We recommend maintaining a cautiously constructive stance through a barbell strategy combining quality and value factors. Year-to-date, a 50:50 blend of MSCI World Enhanced Value and Quality has outperformed the broader MSCI World — precisely the resilience profile the approach was designed to deliver.
The logic is straightforward. Quality provides the defensive margin of safety should the conflict escalate or the indicators shift to red. Value ensures participation in the sharp, often sudden, recovery that historically accompanies the clearing of geopolitical risk. Being overly defensive heading into a resolution event is not prudent risk management — it is a different kind of risk entirely.
Regards,
Benny Takin
Equities Trader
(benny.takin@jmpmarkets.com)
(+675 7001 9121/320 0240)
JMP Securities Limited
Level 3, ADF Haus, Musgrave Street
PO Box 2064
Papua New Guinea