12 – 16 January 2026
Weekly Trade Commentary
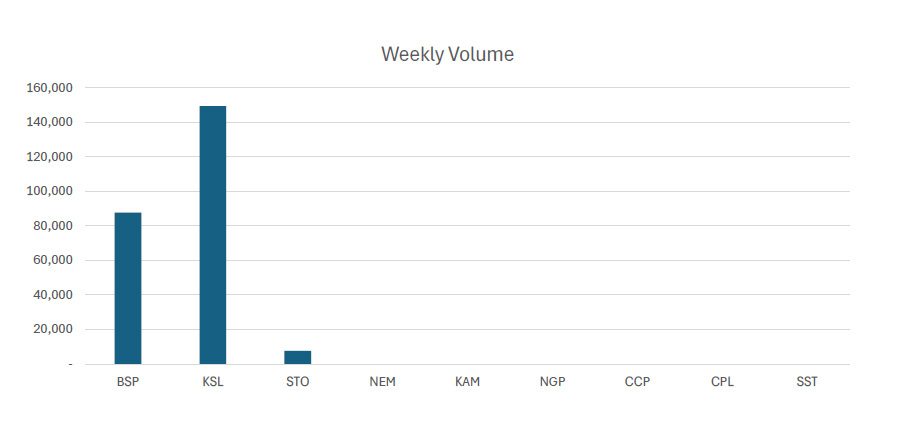
- Last week saw only 3 stocks traded on the local market with a total trading value of K2,257,095.23.
- BSP traded 87,656 shares, steady at K24.55.
- KSL traded 149,348 shares, also steady at K3.81.
- Lastly , STO managed to trade 7,669 shares changing hands steady at K18.50.
WEEKLY MARKET REPORT | 12 January, 2026 – 16 January, 2026
| STOCK | WEEKLY VOLUME |
CLOSING PRICE | VALUE | BID | OFFER | CHANGE | % CHANGE |
| BSP | 87,656 | 24.55 | 112,758.15 | 24.55 | – | – | – |
| KSL | 149,348 | 3.81 | 1,858,660.08 | – | 3.85 | – | – |
| STO | 7,669 | 18.50 | 285,677.00 | 18.50 | 22.00 | – | – |
| NEM | – | 181.00 | – | – | – | – | – |
| KAM | – | 1.92 | – | 1.95 | – | – | – |
| NGP | – | 1.35 | – | – | – | – | – |
| CCP | – | 4.60 | 5,798.10 | – | 4.62 | – | – |
| CPL | – | 0.65 | 248,395.60 | – | 0.60 | – | – |
| SST | – | 50.00 | – | – | 50.00 | – | – |
| 244,673 | TOTAL | 2,257,095.23 | – |
Key takeaways:
- NEM – Form 3 as filed – David Thornton Download >>
- NEM – Form 3 as filed – Mark Rodgers Download >>
- NEM – Form 3 as filed – David Fry Download >>
- Market Announcement: KAM – NTA as at 31 December 2025 Downlaod >>
- Market Announcement: NEM – Fourth Quarter and FY 2025 Conference Call Downlaod >>
- Market Announcement: STO – Unquoted securities Downlaod >>
STO Notification of Cessation of Securities Download >>
STO Notification of Issue Converions Download >>
STO Notification of Cessation of Securities Download >>
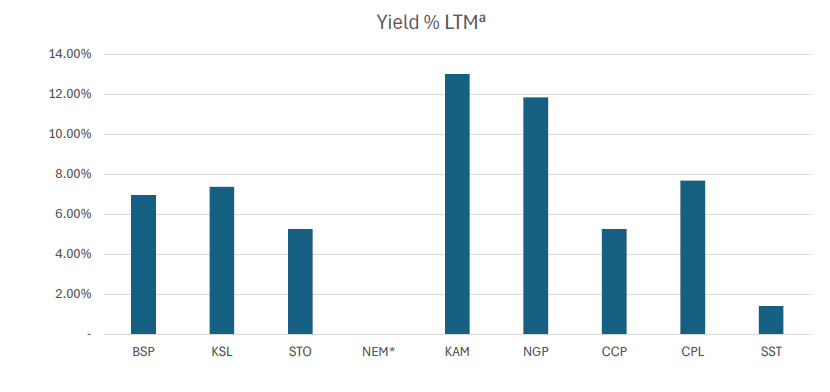
WEEKLY YIELD CHART | 12 January, 2026 – 16 January, 2026
| STOCK | NUMBER ISSUED OF SHARES |
MARKET CAP |
2023 INTERIM DIV | 2023 FINAL DIV | 2024 INTERIM DIV | 2024 FINAL DIV | 2025 INTERIM DIV | YIELD % LTM |
| BSP | 467,219,979 | 11,470,250,484 | K0.370 | K1.060 | K1.210 | K1.210 | K0.500 | 6.97% |
| KSL | 287,949,279 | 1,097,086,753 | K0.100 | K0.160 | K0.106 | K1.155 | K0.126 | 7.38% |
| STO | 3,247,772,961 | 60,083,799,779 | K0.310 | K0.660 | k0.506 | K0.414 | K0.559 | 5.26% |
| NEM* | – | – | – | – | – | – | – | – |
| KAM | 50,693,986 | 97,332,453 | K0.120 | – | – | – | K0.250 | 23.44% |
| NGP | 45,890,700 | 61,952,445 | K0.030 | – | K0.120 | K0.120 | K0.040 | 11.85% |
| CCP | 307,931,332 | 1,416,484,127 | K0.110 | K0.130 | K0.121 | K0.121 | K0.121 | 5.26% |
| CPL | 206,277,911 | 134,080,642 | K0.050 | – | – | – | – | – |
| SST | 31,008,237 | 1,550,411,850 | K0.350 | K0.600 | K0.300 | K0.300 | K0.400 | 1.40% |
| TOTAL | 75,911,398,533 | 5.49% |
a LTM = Last Twelve Months. We have calculated yields based on most recently declared
interim and final dividends.
* NEM pays quarterly dividends. We have added last 4 payments at current FX rates.
Dividend yield – is calculated by dividing a company’s annual dividends per share by its current share price and expressing the result as a percentage.


Domestic Markets Department – Money Markets Operations Unit
Auction Number: 14 JAN-26 / GOI / Government Treasury Bill
Settlement Date: 16-JAN-26
Amount on Offer: K350.000 million
|
TERMS |
ISSUE ID |
ISSUE ID |
ISSUE ID |
ISSUE ID |
ISSUE ID |
TOTAL |
|
Weighted Average Yield |
0.000 |
0.00% |
4.95% |
5.11% |
5.37% |
|
|
Amount on offer Kina Million |
0.000 |
0.000 |
30.000 |
70.000 |
250.000 |
350.000 |
|
Bids Received Kina Million |
0.00 |
0.000 |
37.730 |
74.00 |
300.570 |
412.30 |
|
Successful Bids Kina Million |
0.00 |
0.000 |
30.00 |
70.00 |
210.570 |
310.57 |
|
Overall Auction OVER-SUBSCRIBED by |
0.00 |
0.000 |
7.730 |
4.00 |
50.570 |
62.30 |
What we have been reading
BELL POTTER AUSTRALIAN EQUITY CORE PORTFOLIO
December Monthly

Paul Basha • Strategist Evelyn Murdoch • Associate
As of 5 December 2025
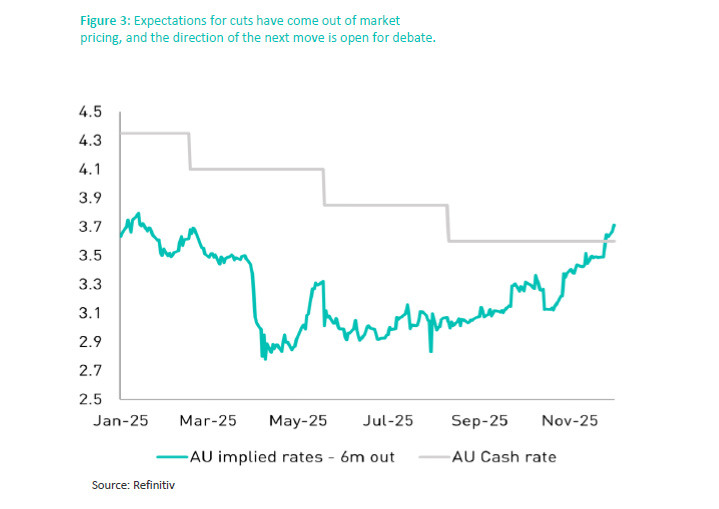
We are making a sector positioning shift in the Core Portfolio, moving overweight Resources and cutting Real Assets to Underweight. Rotating into Resources Our previous thesis for Real Assets was predicated on a view of continued rate cuts in 2026, but that trajectory is no longer a certainty. With a better-than-expected jobs print in mid-November and CPI data remaining uncomfortably hot, the direction of travel for monetary policy is becoming difficult to judge and it is no longer guaranteed that the next move is down. The overweight Real Assets positioning has worked successfully with our yield sensitive holdings and has outperformed the ASX200 over the past month. The immediate duration tailwind for the sector has faded however, and we are taking profits to redeploy.
increases to 17.3% from 16.6% and yield unchanged at 3%. We are higher than the market on growth (7.6%) though paying slightly more for it (12MF P/E for ASX200 at 17.9x).

The case for resources
Expected US interest rate cuts should stimulate global growth and act as a headwind for the US$. This expansionary monetary setting is interacting with tight physical markets, fostering a setup where scarcity pricing could significantly drive commodities and resource equities higher.
Spot prices for key resource commodities (iron ore, copper, gold) are currently trading above consensus estimates, which is expected to maintain strong earnings momentum across the ASX resource sector.
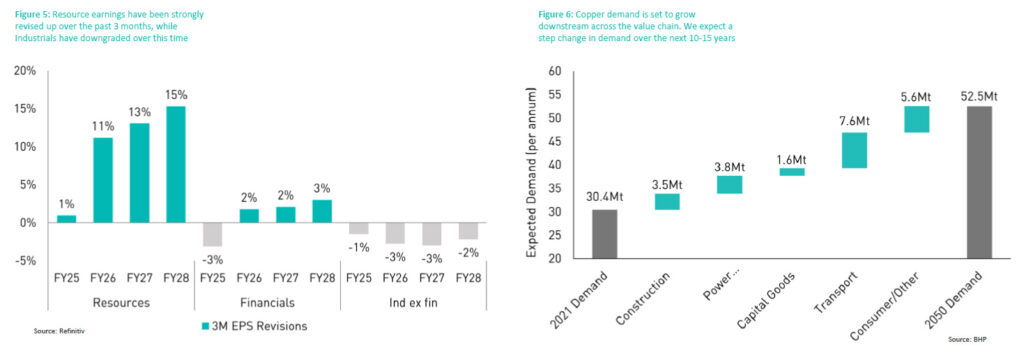
Commodity thematics: A copper supercycle, and gold has more legs
Congo, and Chile all facing shutdowns or halts. This creates a major short-term production headwind.
This supply constraint is running into a significant step up in demand. The energy transition requires a massive build-out of power grids, and data centers are incredibly copper hungry, making the metal a “picks and shovels” play on the AI thematic. This is layered on top of traditional demand and the accelerating adoption of EVs, which use four times more copper than a combustion engine vehicle. This demand is emerging just as the supply side faces long-term challenges. Global copper head grades are in structural decline, and there has been a persistent fall in major new discoveries for over a decade.
Iron Ore: Prices remain above US$100/t, defying consensus calls for a collapse.
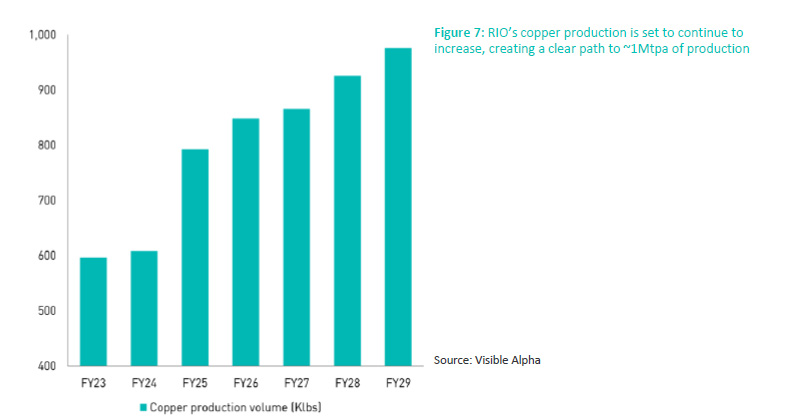
Rio Tinto (RIO) – Pivoting to copper
The investment case is evolving into a story of simplification and higher-quality earnings. Management is focused on costs and is consolidating the business into three core profit centers: Iron Ore, Copper, and a combined Aluminium & Lithium division. With wage inflation running ahead of revenue – an area where peers like BHP have historically outperformed – reining in the cost base is a priority. They are also focused on portfolio optimization with the potential sale of non-core assets like borates and titanium dioxide as examples which could unlock ~$5-10bn of capital, providing capital to delever the balance sheet or boost shareholder returns.
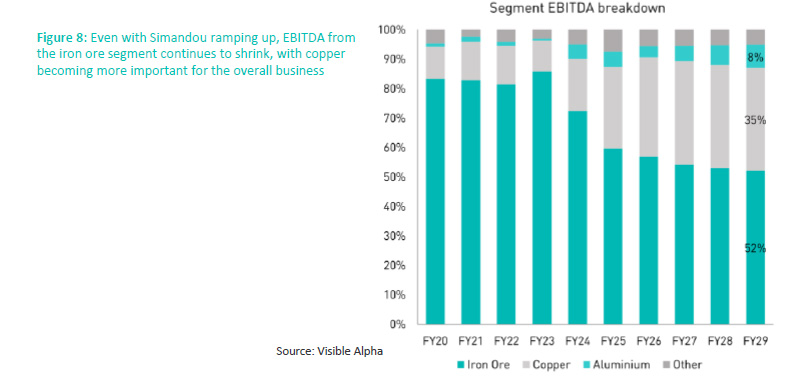
This improved structure supports a fundamental shift in capital allocation. Even as Simandou volumes come online in late 2025, the relative dominance of the iron ore division is shrinking—forecast to drop from ~85% of EBITDA in FY23 to ~55% by FY26. We expect the majority of the growth capex budget to now target the Aluminium & Lithium space. The focus will likely be on bringing Rincon and the acquired Arcadium assets (Fenix, Sal De Vida, Nemaska) to market, while more complex projects like Jadar are potentially de-prioritised.
Energy rotation
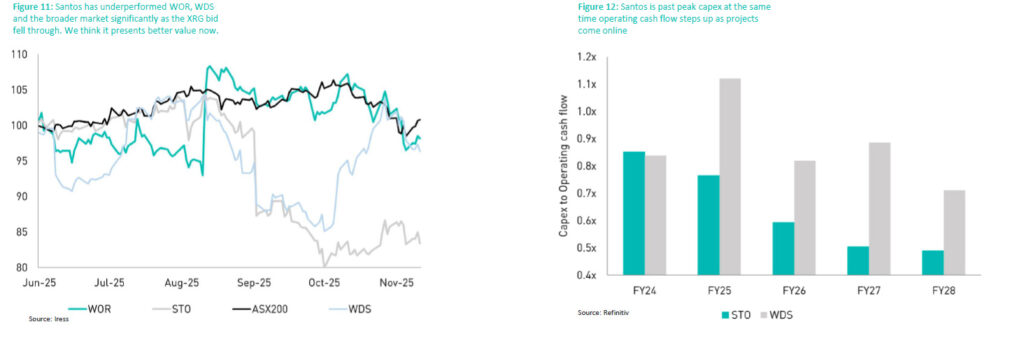
Selling Worley (WOR): WOR was initially our preferred energy-adjacent exposure, leveraged to both traditional and new-energy infrastructure. However, the recent AGM highlighted a softer near-term earnings profile, with above normal 1H:2H skew driven by restructuring charges, capability resets and isolated project cancellations. It additionally confirmed a slower than expected start to the year for global engineering awards as tariff uncertainty and cost inflation delay FID cycles. While contracting margins have generally behaved as expected, the risk/reward has deteriorated with consensus now baking in a deeper 2H skew. On valuation and earnings momentum, we think WOR’s catalysts are now more back-ended and less compelling relative to alternatives within the sector.
The Comparison (STO vs WDS): Woodside sits at the opposite point in the cycle, with its commitment to the Louisiana LNG project, on top of ongoing spend at Scarborough and Trion, pushing group capex higher into FY26. This elevates execution risk and lifts its FCF breakeven oil price, with DPS and ROIC expected to step down for WDS in FY26, while STO grinds higher.
STO’s entry into a capex-lite phase, combined with lower execution complexity, makes it the cleaner and more attractive exposure at this point in the cycle.
Regards,
JMP Securities Team
a. Level 3, ADF Haus, Musgrave St., Port Moresby NCD Papua New Guinea
p. PO Box 2064, Port Moresby NCD Papua New Guinea
Email: lars.mortensen@jmpmarkets.com
Ph: +675 7200 2233
Mobile: +675 7056 5124
Email: nathan.chang@jmpmarkets.com
Ph: +675 7167 3223
Mobile: +61 422 113 630