26 – 30 January 2026
Weekly Trade Commentary
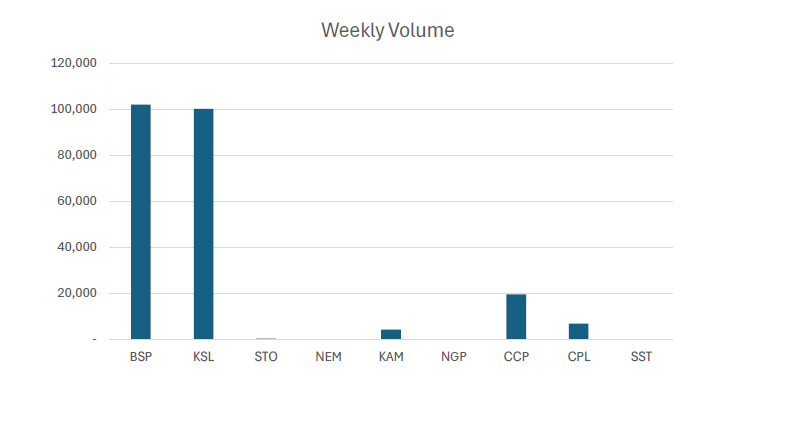
- Last week saw 6 stocks traded on the local market with a total trading value of K2,993,218.99.
- BSP traded 101,969 shares, steady at K24.55. Accounting over 83% of the weeks trade value.
- KSL traded 100,100 shares but closed 2t higher on Friday at K3.83.
- STO traded only 300 shares steady at K18.50.
- KAM traded a small parcel of 4,278 high by 2t at K1.96.
- CCP traded 19,508 shares, closing steady at K4.62.
- Lastly, CPL managed to trade 6,810 shares steady at K0.60.
WEEKLY MARKET REPORT | 26 January, 2026 – 30 January, 2026
| STOCK | WEEKLY VOLUME |
CLOSING PRICE | VALUE | BID | OFFER | CHANGE | % CHANGE |
| BSP | 101,969 | 24.55 | 2,503,338,95 | – | 25.00 | – | – |
| KSL | 100,100 | 3.83 | 381,391.70 | – | 3.83 | 0.02 | 0.52% |
| STO | 300 | 18.50 | 5,550.00 | – | 22.00 | – | – |
| NEM | – | 181.00 | – | – | – | – | – |
| KAM | 4,278 | 1.96 | 8,480.08 | 1.96 | – | 0.02 | 1.03% |
| NGP | – | 1.35 | – | – | – | – | – |
| CCP | 19,508 | 4.62 | 5,798.10 | 4.62 | – | – | – |
| CPL | 6,810 | 0.65 | 248,394.60 | 0.60 | 0.65 | – | – |
| SST | – | 50.00 | – | – | 50.00 | – | – |
| 232,965 | TOTAL | 2,992,973.69 | 0.01% |
Key takeaways:
- STO – Form 4 Notice of a Substantial Shareholding as at 23.01.26 Download >>
- STO – Santos announces first Barossa LNG cargo Download >>
- PLC – Central Lime Project Construction Update Download >>
- PLC – Quarterly Activities and Cash Flow Report Download >>
WEEKLY YIELD CHART | 26 January, 2026 – 30 January, 2026
| STOCK | NUMBER ISSUED OF SHARES |
MARKET CAP |
2023 INTERIM DIV | 2023 FINAL DIV | 2024 INTERIM DIV | 2024 FINAL DIV | 2025 INTERIM DIV | YIELD % LTM |
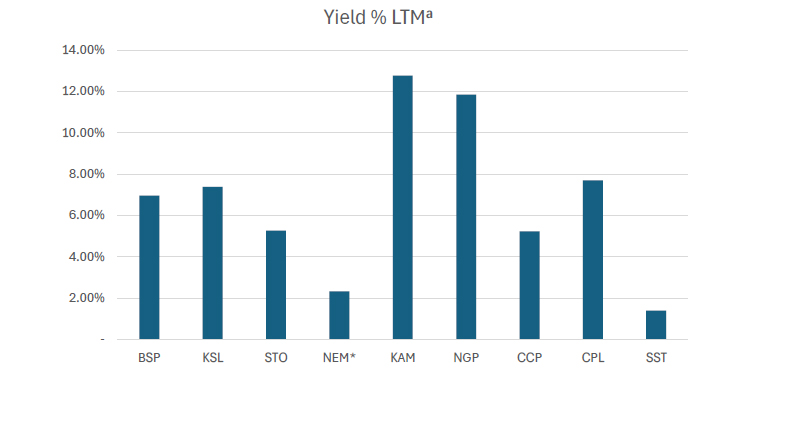
| BSP | 467,317,665 | 11,472,648,676 | K0.370 | K1.060 | K1.210 | K1.210 | K0.500 | 6.97% |
| KSL | 292,965,754 | 1,116,199,523 | K0.100 | K0.160 | K0.106 | K1.155 | K0.126 | 7.38% |
| STO | 3,261,616,703 | 60,339,909,006 | K0.310 | K0.660 | k0.506 | K0.414 | K0.559 | 5.26% |
| NEM* | 1,097,000,000 | 198,557,000,000 | – | – | – | K2.110 | K2.110 | 2.33% |
| KAM | 53,259,588 | 104,388,792 | K0.120 | – | – | – | K0.250 | 12.76% |
| NGP | 45,890,700 | 61,952,445 | K0.030 | – | K0.120 | K0.120 | K0.040 | 11.85% |
| CCP | 307,931,332 | 1,422,642,754 | K0.110 | K0.130 | K0.121 | K0.121 | K0.121 | 5.24% |
| CPL | 206,277,911 | 134,080,642 | K0.050 | – | – | – | K0.050 | 7.69% |
| SST | 31,008,237 | 1,550,411,850 | K0.350 | K0.600 | K0.300 | K0.300 | K0.400 | 1.40% |
| TOTAL | 75,911,398,533 | 5.51% |
a LTM = Last Twelve Months. We have calculated yields based on most recently declared
interim and final dividends.
* NEM pays quarterly dividends. We have added last 4 payments at current FX rates.
Dividend yield – is calculated by dividing a company’s annual dividends per share by its current share price and expressing the result as a percentage.


Domestic Markets Department – Money Markets Operations Unit
Auction Number: 28 JAN-26 / GOI / Government Treasury Bill
Settlement Date: 30-JAN-26
Amount on Offer: K350.000 million
|
TERMS |
ISSUE ID |
ISSUE ID |
ISSUE ID |
ISSUE ID |
ISSUE ID |
TOTAL |
|
Weighted Average Yield |
0.000 |
0.00% |
5.20% |
5.29% |
5.47% |
|
|
Amount on offer Kina Million |
0.000 |
0.000 |
30.000 |
70.00 |
250.00 |
350.00 |
|
Bids Received Kina Million |
0.00 |
0.000 |
48.00 |
85.00 |
458.80 |
591.80 |
|
Successful Bids Kina Million |
0.00 |
0.000 |
48.00 |
85.00 |
250.00 |
383.00 |
|
Overall Auction OVER-SUBSCRIBED by |
0.00 |
0.000 |
18.00 |
15.00 |
208.80 |
241.80 |
Domestic Markets Department – Money Markets Operations Unit
Auction Number: 20 JAN-26 / GOB / Government Bond
Settlement Date: 23-JAN-26
Amount on Offer: K140.000 million
|
SERIES |
Amount on Offer (K’million) |
Bids Received (K’million) |
Successful |
Successful |
Weighted Average Rate |
Coupon Rate |
Overall |
| Issue ID 2026/5057 (3 years) |
20.000 |
29.000 |
24.000 |
5.74%-6.53 |
6.38% |
5.75% |
K9.000 |
|
Issue ID 2026/5058 (5 years) |
40.000 |
51.000 |
44.000 |
5.99%-6.79% |
6.70% |
6.00% |
K11.000 |
|
Issue ID 2026/5059 (7 years) |
20.000 |
24.000 |
24.000 |
6.24%-6.91% |
6.78% |
6.25% |
K4.000 |
|
Issue ID 2026/5060 (10 years) |
40.000 |
49.000 |
42.000 |
6.50%-7.11% |
7.06% |
6.50% |
K9.000 |
|
Issue ID 2026/5061 (15 years) |
20.000 |
22.000 |
22.00 |
6.75%-7.56% |
7.46% |
6.75% |
K2.000 |
| TOTAL
|
140.00 |
175.000 |
156.000 |
|
|
|
K35.000 |
What we have been reading
Chinese Speculators Set the Stage for Gold and Silver Crash

Bloomberg
By: Jack Ryan, Yvonne Yue Li, Jack Farchy and Yihui Xie
Mon, February 2, 2026, at 10:59 AM GMT+10 7 min read
For weeks, traders across the metal’s world have spent their nights glued to screens as prices for everything from gold to copper and tin seemed to break free from the gravity of supply and demand fundamentals, spurred higher on a wave of hot money from speculators in China.
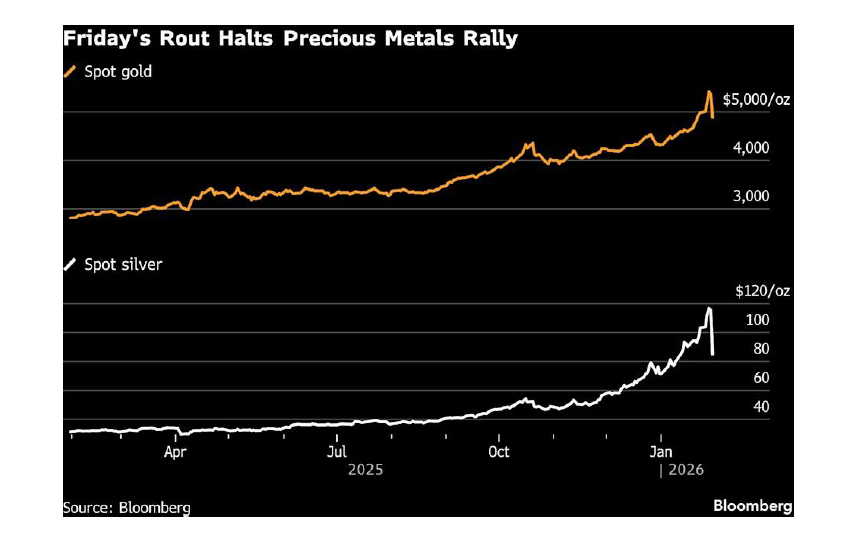
And then, in just a few hours, the rally reversed into one of the most dramatic crashes ever seen in commodity markets. Silver’s 26% plunge on Friday was the biggest on record, while gold dropped 9% in its worst day in more than a decade. Copper traders were already reeling after a sudden spike past $14,500 a ton that unraveled just as fast.
Precious metals extended that decline as Asia began a new week, before paring some of the losses in volatile trade. Spot gold dropped as much as 4%, while silver fell nearly 12% before reversing course and turning higher.
“In my career it’s definitely the wildest that I have seen,” said Dominik Sperzel, the head of trading at Heraeus Precious Metals, a leading bullion refiner. “Gold, it’s a symbol of stability, but such a move is not a symbol of stability.”
Metals traders in Europe and the US have been working around the clock, unwilling to miss the Asian trading day when many of the sharpest moves have taken place — and even frantically trading through long-distance flights. At the world’s biggest coin conference taking place in Germany last week, executives stood staring at their phones, watching in silence as the crisis unfolded.
“Parabolic,”“frenzied” and “untradeable,”were all descriptions of the market on Friday, wrote Nicky Shiels, head of metals strategy at MKS PAMP SA. January 2026, she said, would go down as “the most volatile month in precious metals history.”
Frenzied Pace
Gold’s rally has been building for a number of years, as central banks expanded their holdings as an alternative to the dollar, and accelerated last year as western investors piled into the so-called debasement trade.
But the gains have taken on a more frenzied pace in recent weeks, driven by a wave of buying from Chinese speculators — from individual investors to large equity funds venturing into commodities — that has lifted metals from copper to silver to fresh records. As prices surged, trend-following commodity trading advisors piled in, adding more froth to the rally.
With concerns over the independence of the Fed and geopolitical confrontations from Venezuela to Iran capturing the headlines, the rally in metals became a symbol of some investors’ growing distrust of the US dollar. As metals’ upwards momentum drew more and more buyers, gold and silver fever gripped shoppers from China to Germany — in scenes reminiscent of 1979-1980, the only other time in modern history that the markets have seen such dramatic swings in price.
“We are sold out in certain bar sizes, weeks in advance and people they still buy,” said Sperzel of Heraeus, who said his company is operating at maximum capacity to try to meet the demand. “People are queuing for hours in front of these shops in order to buy products.”
The price moves have been most dramatic in silver, a relatively tiny market with annual supply worth just $98 billion at current prices, compared with $787 billion for gold.
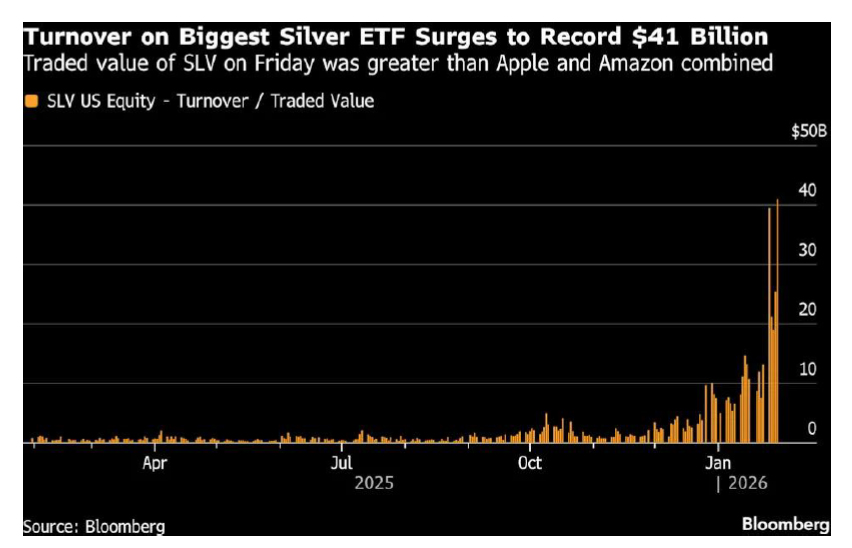
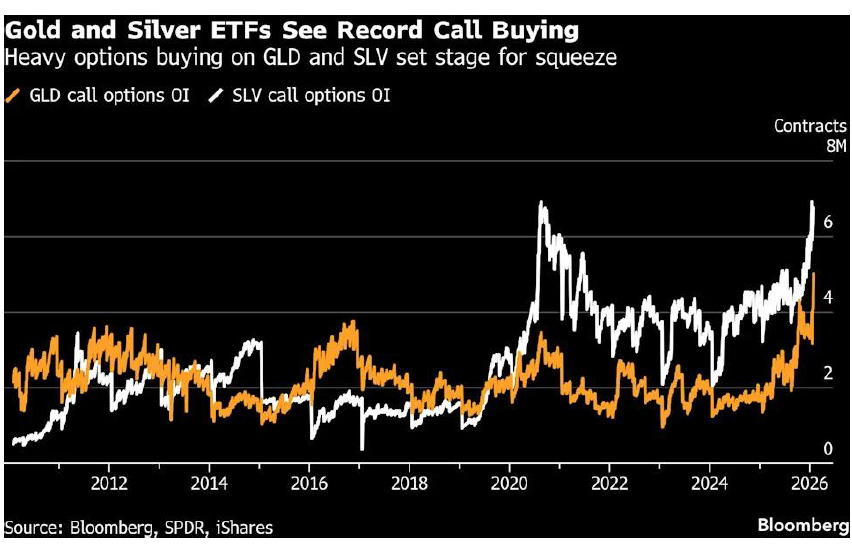
Seen by some investors as a cheap way to bet on market rallies, posts on the Reddit groups that had helped power previous retail surges into silver showed the gains of over 1,000% that could be made from betting on silver’s rapid climb. The biggest gold and silver ETFs each saw record open interest and trading volumes on call options in recent weeks, and the volume of call options on SLV exceeded that of the main ETF that tracks the Nasdaq 100 index of tech stocks.
When there are many outstanding calls it sets the conditions for a squeeze, as dealers rush to hedge their positions by buying the underlying asset when prices start moving up, contributing to further price moves.
“As we squeeze up, they have to mechanically keep buying more,” said Alexander Campbell, former head of commodities for Bridgewater Associates. “And that would explain why we go up so fast, and down so fast.”
Trump’s comment that the under-pressure dollar was “doing great” on Tuesday night triggered a final frenzy of metals buying, pushing prices to new records. By Thursday, Gold reached $5,595 an ounce, silver topped $121 and copper hit $14,527.50.
Prices briefly stabilized, but then Bloomberg and other news organizations reported that Trump was planning to nominate Warsh as the next Fed chair. Where previously the Asian morning session had reliably driven prices higher — as bleary-eyed European traders watched on in astonishment — this time, Chinese investors took profits. The seeds of Friday’s dramatic crash were sown.
“China sold and now we’re suffering the consequences,” Campbell said.
What comes next may once again depend on China. Investors will be watching closely for when trading opens in Shanghai on Sunday evening New York time, to see whether Chinese demand for metals can be revived after the shock selloff. A16%-19% daily limit on price moves for various silver contracts on Chinese exchanges means Shanghai’s prices may need to play catch-up.
Still, the pullback ahead of the Lunar New Year, a traditional buying season, may offer an entry point, with retail investors who had missed the rallywaiting to step in. In Shuibei, a major bullion trading hub, tightness in silver has eased somewhat, with more selling than buying over the weekend, according to traders. But there are no signs of panic selling, and Shuibei silver prices are still trading at a premium to exchange contracts, they said.
As retail interest simmers, several Chinese banks on Friday announced fresh measures to curb risks tied to retail gold accumulation products, following a series of similar moves over the past year.
China Construction Bank said it will raise the minimum deposit amount from Monday and urged investors to heighten risk awareness, while Industrial and Commercial Bank of China said it will implement quota controls for its Ruyi Gold Savings service during holidays.Exchanges have also taken several steps that could rein in the broad rally in metal markets globally.
“Gold is relatively strong;I see a lot of dip buyers coming in the past two days to purchase jewelries and bars before Lunar New Year,” said Liu Shunmin, head of risk at trader Shenzhen Guoxing Precious Metal Co. “Whereas for silver, there’s a strong inclination to stand on the sidelines.”
Regards,
JMP Securities Team
a. Level 3, ADF Haus, Musgrave St., Port Moresby NCD Papua New Guinea
p. PO Box 2064, Port Moresby NCD Papua New Guinea
Email: lars.mortensen@jmpmarkets.com
Ph: +675 7200 2233
Mobile: +675 7056 5124
Email: nathan.chang@jmpmarkets.com
Ph: +675 7167 3223
Mobile: +61 422 113 630