02 – 06 February 2026
Weekly Trade Commentary
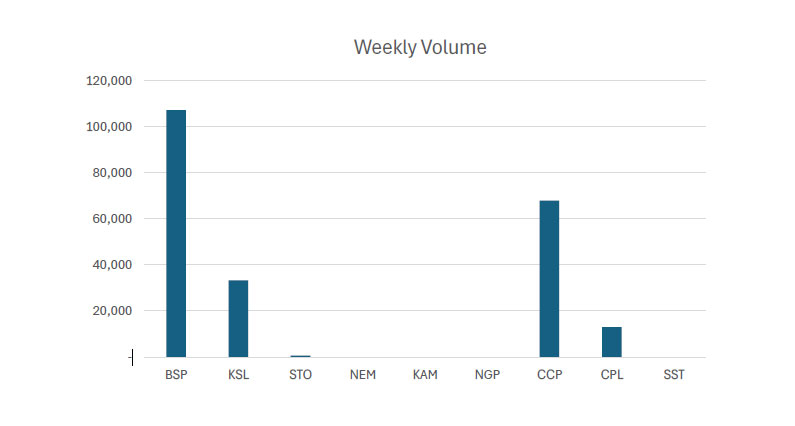
- Last week saw 5 stocks traded on the local market with a total trading value of K3,097,090.72.
- BSP traded 107,278 shares steady at K24.55. This culminates 86% of the total trade value for last week.
- KSL only traded 33,285 shares, closing 2t lower at K3.81.
- STO only did 600 shares but closed the week 50t higher at K19.00.
- CCP traded 67,922 shares 4t higher at K4.66.
- Lastly, CPL traded 12,983 shares. Changing hands 4t higher at K0.64.
–
WEEKLY MARKET REPORT | 02 February, 2026 – 06 February, 2026
| STOCK | WEEKLY VOLUME |
CLOSING PRICE | VALUE | BID | OFFER | CHANGE | % CHANGE |
| BSP | 107,278 | 24.55 | 2,633,674.90 | – | 25.00 | – | – |
| KSL | 33,285 | 3.81 | 127,154.61 | – | 3.83 | (0.02) | 0.52% |
| STO | 600 | 19.00 | 11,400.00 | – | 22.00 | 0.50 | 2.70% |
| NEM | – | 181.00 | – | – | – | – | – |
| KAM | – | 1.96 | – | 1.96 | – | – | – |
| NGP | – | 1.35 | – | – | – | – | – |
| CCP | 67,922 | 4.66 | 316,502.09 | 4.62 | – | 0.04 | 0.87% |
| CPL | 12,983 | 0.64 | 8,359.12 | 0.60 | 0.65 | 0.04 | 6.67% |
| SST | – | 50.00 | – | – | 50.00 | – | – |
| 222,068 | TOTAL | 3,097,090.72 | 2.18% |
Key takeaways:
- CPL- Appointment of Mr. Ajay Patel as COO Download >>
- BSP | 2025 Full Year Investor Presentation Notification Download >>
- NIU – December 2025 Quarterly Activities Report Download >>
- NIU – September 2025 Appendix 5A – Quarterly Cashflow Report Download >>
- NIU – December 2025 Appendix 5A – Quarterly Cashflow Report Download >>
- NIU – September 2025 Quarterly Activities Report Download >>
WEEKLY YIELD CHART | 02 February, 2026 – 06 February, 2026
| STOCK | NUMBER ISSUED OF SHARES |
MARKET CAP |
2023 INTERIM DIV | 2023 FINAL DIV | 2024 INTERIM DIV | 2024 FINAL DIV | 2025 INTERIM DIV | YIELD % LTM |
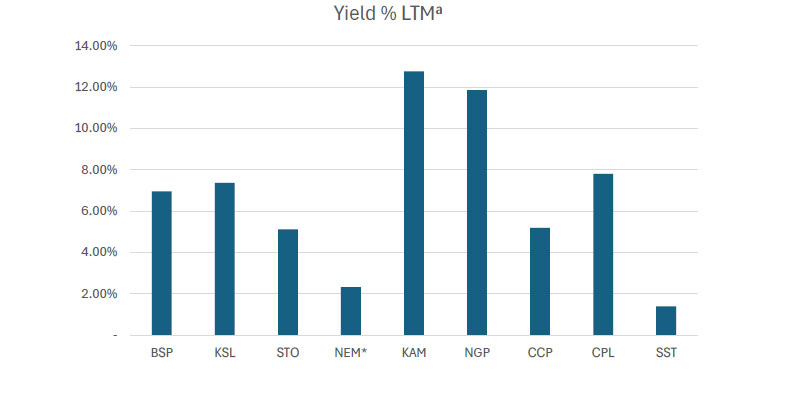
| BSP | 467,317,665 | 11,472,648,676 | K0.370 | K1.060 | K1.210 | K1.210 | K0.500 | 6.97% |
| KSL | 292,965,754 | 1,116,199,523 | K0.100 | K0.160 | K0.106 | K1.155 | K0.126 | 7.38% |
| STO | 3,261,616,703 | 60,339,909,006 | K0.310 | K0.660 | k0.506 | K0.414 | K0.559 | 5.26% |
| NEM* | 1,097,000,000 | 198,557,000,000 | – | – | – | K2.110 | K2.110 | 2.33% |
| KAM | 53,259,588 | 104,388,792 | K0.120 | – | – | – | K0.250 | 12.76% |
| NGP | 45,890,700 | 61,952,445 | K0.030 | – | K0.120 | K0.120 | K0.040 | 11.85% |
| CCP | 307,931,332 | 1,434,960,007 | K0.110 | K0.130 | K0.121 | K0.121 | K0.121 | 5.19% |
| CPL | 206,277,911 | 132,017,863 | K0.050 | – | – | – | K0.050 | 7.81% |
| SST | 31,008,237 | 1,550,411,850 | K0.350 | K0.600 | K0.300 | K0.300 | K0.400 | 1.40% |
| TOTAL | 75,911,398,533 | 5.39% |
a LTM = Last Twelve Months. We have calculated yields based on most recently declared
interim and final dividends.
* NEM pays quarterly dividends. We have added last 4 payments at current FX rates.
Dividend yield – is calculated by dividing a company’s annual dividends per share by its current share price and expressing the result as a percentage.


Domestic Markets Department – Money Markets Operations Unit
Auction Number: 04 FEB-26 / GOI / Government Treasury Bill
Settlement Date: 6-FEB-26
Amount on Offer: K350.000 million
|
TERMS |
ISSUE ID |
ISSUE ID |
ISSUE ID |
ISSUE ID |
ISSUE ID |
TOTAL |
|
Weighted Average Yield |
0.000 |
0.00% |
5.28% |
5.41% |
5.50% |
|
|
Amount on offer Kina Million |
0.000 |
0.000 |
30.000 |
70.00 |
250.000 |
350.00 |
|
Bids Received Kina Million |
0.00 |
0.000 |
40.00 |
70.00 |
527.76 |
637.76 |
|
Successful Bids Kina Million |
0.00 |
0.000 |
40.00 |
70.00 |
267.76 |
377.76 |
|
Overall Auction OVER-SUBSCRIBED by |
0.00 |
0.000 |
10.00 |
00.00 |
277.76 |
287.76 |
Domestic Markets Department – Money Markets Operations Unit
Auction Number: 20 JAN-26 / GOB / Government Bond
Settlement Date: 23-JAN-26
Amount on Offer: K140.000 million
|
SERIES |
Amount on Offer (K’million) |
Bids Received (K’million) |
Successful |
Successful |
Weighted Average Rate |
Coupon Rate |
Overall |
| Issue ID 2026/5057 (3 years) |
20.000 |
29.000 |
24.000 |
5.74%-6.53 |
6.38% |
5.75% |
K9.000 |
|
Issue ID 2026/5058 (5 years) |
40.000 |
51.000 |
44.000 |
5.99%-6.79% |
6.70% |
6.00% |
K11.000 |
|
Issue ID 2026/5059 (7 years) |
20.000 |
24.000 |
24.000 |
6.24%-6.91% |
6.78% |
6.25% |
K4.000 |
|
Issue ID 2026/5060 (10 years) |
40.000 |
49.000 |
42.000 |
6.50%-7.11% |
7.06% |
6.50% |
K9.000 |
|
Issue ID 2026/5061 (15 years) |
20.000 |
22.000 |
22.00 |
6.75%-7.56% |
7.46% |
6.75% |
K2.000 |
| TOTAL
|
140.00 |
175.000 |
156.000 |
|
|
|
K35.000 |
What we have been reading
THE GREAT BROADENING: NAVIGATING THE NEXT PART OF THE CYCLE IN 2026

BELL POTTER- Monthly Bell February 2026
By: Rob Crookston, Strategist
1.The Fiscal and Regulatory Tailwind
The US economy enters 2026 bolstered by the “One Big Beautiful Bill Act” (OBBBA). This legislation is significantly front-loaded, preventing the expiration of key tax provisions and potentially lowering the effective corporate tax rate from 21% to as low as 12%. Complementing this is an aggressive deregulatory push in the banking sector. By unwinding post-2008 capital buffer requirements, the Trump administration could unlock nearly $140 billion in capital, equivalent to $2.6 trillion in lending capacity. This is not merely a financial sector win; it is a structural boost to M&A activity and credit access for the broader economy.
The anticipated $6.7 trillion in data center capital expenditure through 2030 represents a massive cyclical tailwind for the real economy. In 2026, this spending acts as a backstop for GDP, pulling forward demand for construction, power infrastructure, and industrial metals.
The RBA vs The Fed
A critical theme for the 2026 portfolio is the divergence in monetary policy. The US Federal Reserve is expected to continue its easing cycle, with markets pricing in at least two additional cuts. Conversely, the Reserve Bank of Australia (RBA) remains delicately poised. While we view current market pricing of 35bp of hikes as excessively hawkish, the reality of “sticky” domestic services inflation suggests a “one and done” stance (after February’s hike) or the potential for one more hike in mid-2026.
This divergence creates a compelling case for Australian investors: hold domestic floating-rate credit to capture elevated yields while hedging global equity exposure to protect against a strengthening A$ as interest rate differentials widen.
Key Investment Calls for 2026
EM equities trade at a significant discount to developed markets. We expect China to be a primary beneficiary of the broadening theme, leveraging its self-contained AI ecosystem to drive efficiency gains from an attractive valuation floor. Structural reforms in South Korea and the “China Plus One” supply chain diversification in India provide robust regional catalysts. Historically, a weakening US$ has acted as a primary accelerator for EM returns; 2026 is shaping up to be a textbook example of this dynamic.
In the Australian context, our recommendation is a tactical rotation into resources. For the first time in three years, the sector is entering a genuine upgrade cycle. Resource earnings have seen 11-15% upward revisions in recent months, while industrials are facing downgrades and have stretched valuations. The combination of “scarcity pricing” in tight physical metal markets and the copper-intensive demand of the data center boom creates a structural “super-cycle” that is largely independent of the standard business cycle.
3.Adding Some Value
While the AI thematic continues to underpin growth, the broader macro backdrop, characterized by accelerating economic activity, front-loaded fiscal stimulus, and sticky bond yields, is starting to favor the value factor. With index concentration at historic highs and valuations stretched in the mega-cap tech sector, value remains materially under-owned, representing a key pocket of opportunity in 2026, while mitigating concentration risk in portfolios.
Increasing exposure to value serves as a portfolio hedge against “rapid reflation”—our key risk case. Unlike long-duration growth stocks, value sectors typically outperform in environments of rising nominal growth and yield pressure, offering protection if inflation proves persistent.
While the outlook is positive, the path for returns is narrow. We outline 3 risks worth monitoring:
Rapid Reflation: Should US inflation rebound toward 4%, the Fed may be forced into a policy reversal that markets are ill-prepared for.
AI Valuation Compression: The emergence of low-cost Chinese AI models (like DeepSeek) could challenge the high-margin dominance of US chipmakers, leading to a repricing of the world’s largest companies.
Policy Volatility: There remains a tail-risk that the “Trump Put” fails if the administration prioritizes ideological trade goals over equity market stability.
Key Message – Expect Broad Returns in 2026
The investment mantra for 2026 is diversification through broadening. The “Magnificent 7” may have led us to the mountaintop, but the next phase of the journey will be driven by the miners, the builders, the lenders, and the emerging economies. For the disciplined investor, 2026 offers a wealth of opportunity beyond the crowded trades of the past decade.
Regards,
JMP Securities Team
a. Level 3, ADF Haus, Musgrave St., Port Moresby NCD Papua New Guinea
p. PO Box 2064, Port Moresby NCD Papua New Guinea
Email: lars.mortensen@jmpmarkets.com
Ph: +675 7200 2233
Mobile: +675 7056 5124
Email: nathan.chang@jmpmarkets.com
Ph: +675 7167 3223
Mobile: +61 422 113 630