09 – 13 February 2026
Weekly Trade Commentary
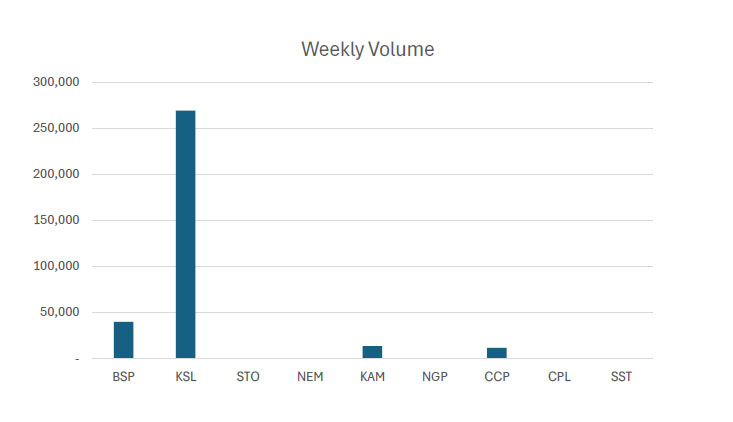
- Last week saw 6 stocks traded on the local market with a total trading value of K2,120,197.84.
- BSP traded 39,953 shares high by 55t at K25.00.
- KSL traded 269,482 shares high by 4t at K3.85.
- STO only traded 147 shares but closed K1.00 higher at K20.00.
- NEM also traded in small volumes, only trading 7 PDIs during the week but closing K309.00 higher at K490.00.
- KAM traded 13,500 shares steady at K1.96.
- Lastly, CCP 11,494 shares also steady at K4.66.
WEEKLY MARKET REPORT | 09 February, 2026 – 13 February, 2026
| STOCK | WEEKLY VOLUME |
CLOSING PRICE | VALUE | BID | OFFER | CHANGE | % CHANGE |
| BSP | 39,953 | 25.00 | 998,875.00 | 25.00 | – | 0.55 | 2.25% |
| KSL | 269,482 | 3.85 | 1,035,540.86 | – | 4.10 | 0.04 | 1.05% |
| STO | 147 | 20.00 | 2,940.00 | 20.00 | 22.00 | 1.00 | 5.26% |
| NEM | 7 | 490.00 | 3,430.00 | – | 480.00 | 309.00 | 170.72% |
| KAM | 13,500 | 1.96 | – | 1.98 | – | – | – |
| NGP | – | 1.35 | – | – | – | – | – |
| CCP | 11,494 | 4.66 | 53,671.98 | 4.66 | – | – | – |
| CPL | – | 0.64 | – | – | 0.64 | – | – |
| SST | – | 50.00 | – | – | 50.00 | – | – |
| 334,583 | TOTAL | 2,120,917.84 | 152.86% |
Key takeaways:
- PLC – Application for quotation of securities Download >>
- PLC – Application for quotation of securities Download >>
- NEM – Newmont Position on Barrick IPO Announcement Download >>
- STO – 2025 Annual Reserves Statement and 2025 additional guidance Download >>
- Market Announcement: KAM – NTA as of 31 January 2026 Download >>
- CGA – New Aircraft Arrival- P2-ATY dated 11 February 2026 Download >>
- KSL – Notification of Full Year Results 2025 Download >>
WEEKLY YIELD CHART | 09 February, 2026 – 13 February, 2026
| STOCK | NUMBER ISSUED OF SHARES |
MARKET CAP |
2023 INTERIM DIV | 2023 FINAL DIV | 2024 INTERIM DIV | 2024 FINAL DIV | 2025 INTERIM DIV | YIELD % LTM |
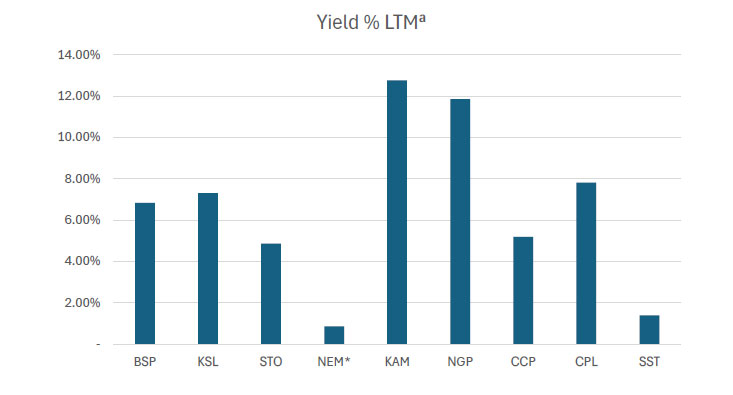
| BSP | 467,317,665 | 11,682,941,625 | K0.370 | K1.060 | K1.210 | K1.210 | K0.500 | 6.84% |
| KSL | 292,965,754 | 1,127,918,153 | K0.100 | K0.160 | K0.106 | K1.155 | K0.126 | 7.30% |
| STO | 3,261,616,703 | 65,232,334,060 | K0.310 | K0.660 | k0.506 | K0.414 | K0.559 | 4.87% |
| NEM* | 1,097,000,000 | 537,530,000,000 | – | – | – | K2.110 | K2.110 | 0.86% |
| KAM | 53,259,588 | 104,388,792 | K0.120 | – | – | – | K0.250 | 12.76% |
| NGP | 45,890,700 | 61,952,445 | K0.030 | – | K0.120 | K0.120 | K0.040 | 11.85% |
| CCP | 307,931,332 | 1,434,960,007 | K0.110 | K0.130 | K0.121 | K0.121 | K0.121 | 5.19% |
| CPL | 206,277,911 | 132,017,863 | K0.050 | – | – | – | K0.050 | 7.81% |
| SST | 31,008,237 | 1,550,411,850 | K0.350 | K0.600 | K0.300 | K0.300 | K0.400 | 1.40% |
| TOTAL | 75,911,398,533 | 5.91% |
a LTM = Last Twelve Months. We have calculated yields based on most recently declared
interim and final dividends.
* NEM pays quarterly dividends. We have added last 4 payments at current FX rates.
Dividend yield – is calculated by dividing a company’s annual dividends per share by its current share price and expressing the result as a percentage.


Domestic Markets Department – Money Markets Operations Unit
Auction Number: 11 FEB-26 / GOI / Government Treasury Bill
Settlement Date: 13-FEB-26
Amount on Offer: K350.000 million
|
TERMS |
ISSUE ID |
ISSUE ID |
ISSUE ID |
ISSUE ID |
ISSUE ID |
TOTAL |
|
Weighted Average Yield |
0.000 |
0.00% |
5.43% |
5.49% |
5.55% |
|
|
Amount on offer Kina Million |
0.000 |
0.000 |
30.000 |
70.00 |
250.000 |
350.00 |
|
Bids Received Kina Million |
0.00 |
0.000 |
31.00 |
99.02 |
498.10 |
628.12 |
|
Successful Bids Kina Million |
0.00 |
0.000 |
31.00 |
99.02 |
248.10 |
378.12 |
|
Overall Auction OVER-SUBSCRIBED by |
0.00 |
0.000 |
1.00 |
29.02 |
248.10 |
287.76 |
Domestic Markets Department – Money Markets Operations Unit
Auction Number: 20 JAN-26 / GOB / Government Bond
Settlement Date: 23-JAN-26
Amount on Offer: K140.000 million
|
SERIES |
Amount on Offer (K’million) |
Bids Received (K’million) |
Successful |
Successful |
Weighted Average Rate |
Coupon Rate |
Overall |
| Issue ID 2026/5057 (3 years) |
20.000 |
29.000 |
24.000 |
5.74%-6.53 |
6.38% |
5.75% |
K9.000 |
|
Issue ID 2026/5058 (5 years) |
40.000 |
51.000 |
44.000 |
5.99%-6.79% |
6.70% |
6.00% |
K11.000 |
|
Issue ID 2026/5059 (7 years) |
20.000 |
24.000 |
24.000 |
6.24%-6.91% |
6.78% |
6.25% |
K4.000 |
|
Issue ID 2026/5060 (10 years) |
40.000 |
49.000 |
42.000 |
6.50%-7.11% |
7.06% |
6.50% |
K9.000 |
|
Issue ID 2026/5061 (15 years) |
20.000 |
22.000 |
22.00 |
6.75%-7.56% |
7.46% |
6.75% |
K2.000 |
| TOTAL
|
140.00 |
175.000 |
156.000 |
|
|
|
K35.000 |
What we have been reading
UPCOMING TEST FOR MARKETS

BELL POTTER- Monthly Bell February 2026
Paul Basha, Strategist
The earnings pulse
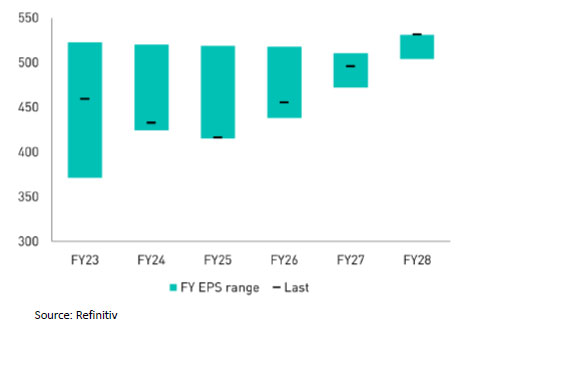
Since last year’s August reporting season, we have seen consensus earnings beginning to turn higher, with 12MF EPS forecasts finally picking up after having been trending downwards since late 2022.
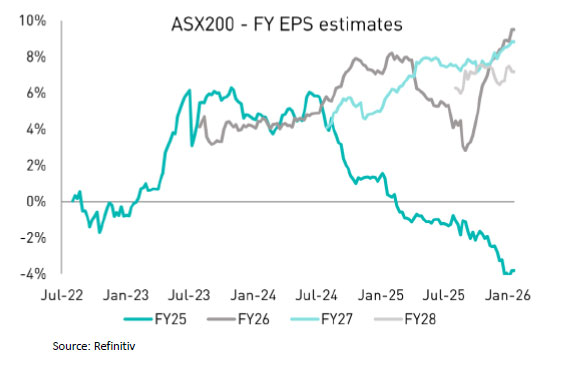
On aggregate, consensus forecasts for earnings in FY26 have been revised up ~4% since September, with the ASX 200 now expected to grow by 9.5%. Upgrades have been largely driven by resources, with commodity prices moving higher over the past 3 months.
Figure 1: Signs of an earnings revival emerging in outer-year forecasts, with EPS estimates lifting from lows
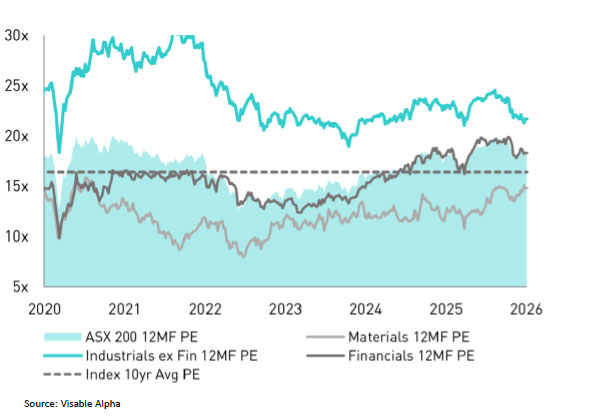
Valuations cooling from peaks
Market valuations have come down modestly, a normalization which is partially a result of rising index weighting toward lower-multiple materials. While most sectors have derated from recent peaks (tech, consumer discretionary and healthcare stand out here) valuations remain high, and at a 12MF PE of ~18x the ASX 200 continues to
trade at approximately one standard deviation above its 10-year average. The set-up is still high stakes. Investors have been paying up for the FY26 recovery for the past two
years – and we expect another volatile earnings season with companies punished hard and fast for any missteps.
Figure 2: Consensus is pricing in earnings growth of 9.5% in FY26
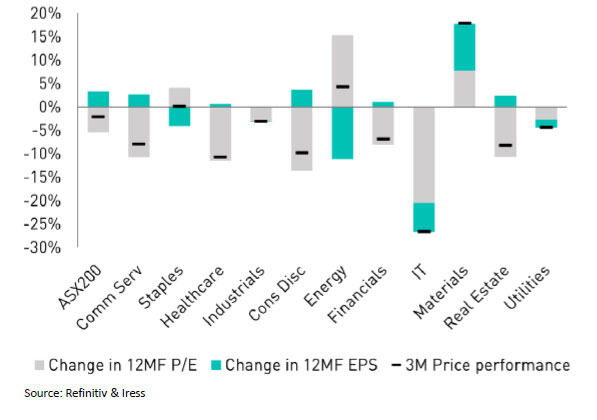
Materials doing the heavy lifting
Materials have been driving the earning uplift and contribute two thirds of the index’s FY26 EPS growth.
Precious metals have led performance, with heightened concerns around US fiscal discipline and Federal Reserve independence renewing demand for hard-asset safe havens. Meanwhile, base metals such as copper and lithium are seeing structural demand support from data center buildouts, electrification trends and defense-related spending, with favorable supply dynamics and constrained physical markets amplifying price momentum.
With spot prices elevated, producers are generating strong cash flows and have entered a period of balance sheet deleveraging. Focus is shifting to capital allocation discipline, and how excess cash will be deployed through shareholder return, reinvestment, and M&A activity. The market responded negatively to RIO’s proposed negotiation with Glencore, a deal which would complicate RIO’s business at a time when the market was buying into their business simplification story. We think that valuation discipline and strategic clarity are likely to be critical in determining whether incremental capital deployment is value accretive. We see further upside to spot prices but are even more constructive on resource equities which should outperform as analysts play catch up and revise up consensus earnings and dividend forecasts across the listed mining space.
Commodities are at what appears to be the beginning stages of an up cycle, we think ramped up production and investments in expansion (whether through development or M&A) could be a tailwind for mining contractors and suppliers.
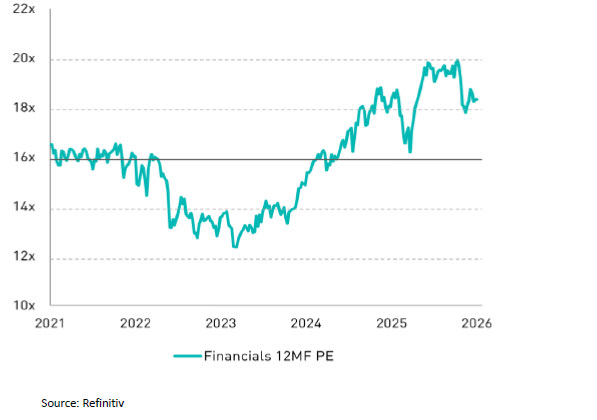
Growth expectations for the financial sector have improved modestly heading into February reporting, with the market now pricing ~5% earnings growth in FY26.
A shift in domestic monetary policy expectations in late November, with rate cuts priced out and some probability of hikes emerging for early CY26, alleviated part of the medium-term pressure on bank NIMS.
Last week, Q4 inflation growth came out hotter than expected at the headline level, forcing the RBA into hiking at its February meeting.
While valuations have retraced from recent peaks, sector PEs remain elevated at around one standard deviation above their 10-year average, leaving limited tolerance for earnings disappointment or guidance slippage. Relative to resources and industrials ex-financials, financials continue to exhibit the most subdued earnings growth profile, with low single digit growth baked in for FY27 and FY28.
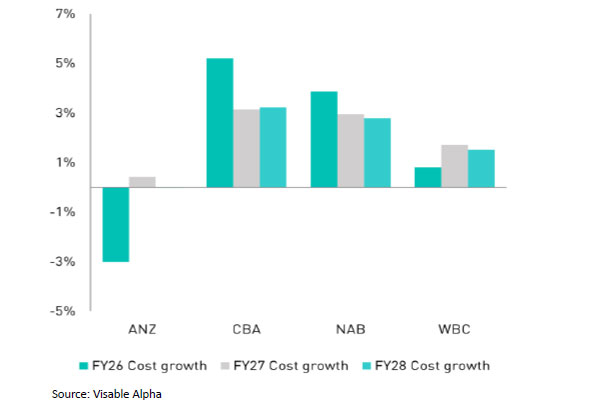
Cost growth remains the key challenge for the sector, with banks competing for a constrained pool of skilled labor amid rising wage inflation, particularly within increasingly competitive business banking segments. This has coincided with elevated investment in transformation and technology initiatives, resulting in upfront cost outlays with limited evidence of returns to date.
CBA a focus
CBA’s 12MF PE has come down 20% since June 2025, however this remains well above its 10-year average. We are underweight given that competitive dynamics constrain their ability to deliver further outperformance in core retail and business banking, while upside from cost initiatives or capital actions appears limited, leaving the stock exposed to further multiple contraction. NAB and WBC face similar structural and execution challenges, with both heavily reliant on the successful delivery of internal ‘self-help’ programs. We continue to prefer ANZ, which we view as having the clearest and most credible pathway to cost deflation among the majors.
Regards,
JMP Securities Team
a. Level 3, ADF Haus, Musgrave St., Port Moresby NCD Papua New Guinea
p. PO Box 2064, Port Moresby NCD Papua New Guinea
Email: lars.mortensen@jmpmarkets.com
Ph: +675 7200 2233
Mobile: +675 7056 5124
Email: nathan.chang@jmpmarkets.com
Ph: +675 7167 3223
Mobile: +61 422 113 630