16 – 20 February 2026
Weekly Trade Commentary
- Last week saw 4 stocks traded on the local market with a total trading value of K1,637,734.05.
- BSP traded 43,073 shares high by 5t at K25.05.
- KSL traded 137,604 shares steady at K3.85.
- STO only traded 753 shares steady also at K20.00.
- Lastly NEM, traded 27 PDIs (PETS Depository Interests) down by K10.00 closing at K480.00.
* 1 PDI = 1 Fully paid Ordinary Share (FPO)
WEEKLY MARKET REPORT | 16 February, 2026 – 20 February, 2026
| STOCK | WEEKLY VOLUME |
CLOSING PRICE | VALUE | BID | OFFER | CHANGE | % CHANGE |
| BSP | 43,073 | 25.05 | 1,078,978.65 | 25.05 | – | 0.05 | 0.20% |
| KSL | 137,604 | 3.85 | 529,775.40 | – | – | – | – |
| STO | 753 | 20.00 | 15,060.00 | 20.00 | – | – | – |
| NEM | 29 | 480.00 | 13,920.00 | 500.00 | 590.00 | (10.00) | (2.04%) |
| KAM | – | 1.96 | – | 1.98 | – | – | – |
| NGP | – | 1.35 | – | – | – | – | – |
| CCP | – | 4.66 | 53,671.98 | 4.66 | – | – | – |
| CPL | – | 0.64 | – | – | 0.64 | – | – |
| SST | – | 50.00 | – | – | 50.00 | – | – |
| 181,459 | TOTAL | 1,637,734.05 | (1.74%) |
JMP WEEKLY REPORT DTD 23.02.26 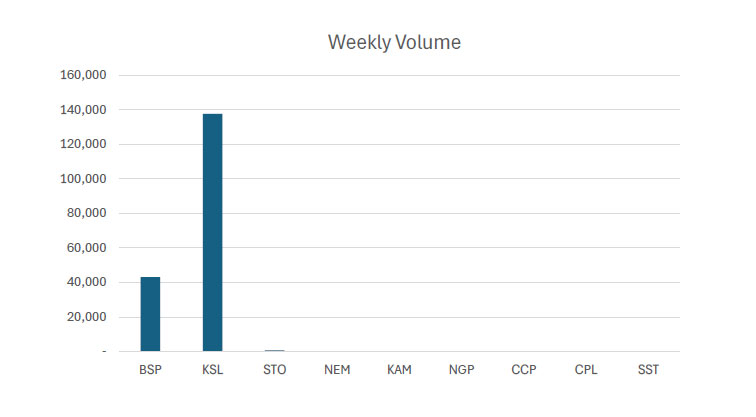
Key takeaways:
- Market Announcement: PLC – Cornerstone Quicklime Offtake with Newmont Download >>
- PLC – Application for quotation of securities Download >>
- Market Announcement: CGA – Appointment of Non-Executive Director Download >>
Market Announcement: CGA – Updated Appointment of Non-Executive Director Download >> - Market Announcement: STO
Full Year Results Download >>
Appendix 4G-4 Download >>
Dividend of Distributions Download >>
Director Appointment Resignation Download >>
Climate Strategy Update Download >>
2025 Annual Report Download >>
Santos Agrees to Gas Sale with SA Government Download >> - Market Announcement: NEM
Reserves and Resources Release Download >>
Q4 and 2025 Full Year Results Download >>
NEM Dividend Distribution Results Download >>
NEM 2025 Annual Report Download >> - Market Announcement: BSP
BSP 2025 Full Year Results Announcement Download >>
BSP Appendix Form 5C Download >>
BSP Appendix 3A1 Notification of Dividend Distribution Download >>
BSP 2025 Annual Report Download >>
WEEKLY YIELD CHART | 16 February, 2026 – 20 February, 2026
| STOCK | NUMBER ISSUED OF SHARES |
MARKET CAP |
2023 INTERIM DIV |
2023 FINAL DIV |
2024 INTERIM DIV |
2024 FINAL DIV |
2025 INTERIM DIV |
2026 FINAL DIV |
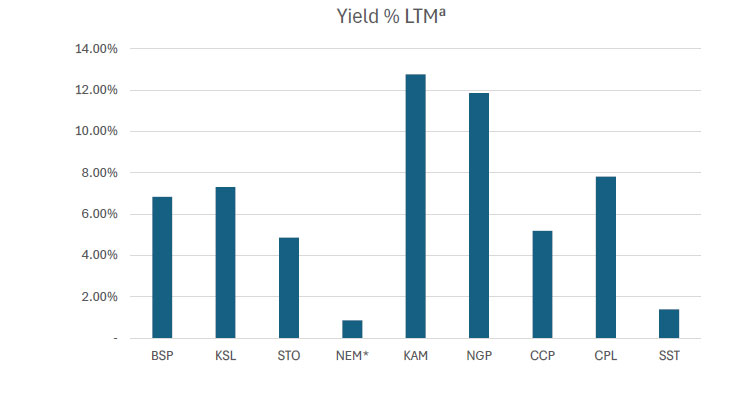
YIELD % LTM |
| BSP | 467,317,665 | 11,706,307,508 | K0.370 | K1.060 | K1.210 | K1.210 | K0.500 | K1.380 | 7.50% |
| KSL | 292,965,754 | 1,127,918,153 | K0.100 | K0.160 | K0.106 | K1.155 | K0.126 | – | 7.30% |
| STO | 3,261,616,703 | 65,232,334,060 | K0.310 | K0.660 | k0.506 | K0.414 | K0.559 | (USD) $0.103 | 4.87% |
| NEM* | 1,097,000,000 | 537,530,000,000 | – | – | – | K2.110 | K2.110 | (USD) $0.26 | 0.88% |
| KAM | 53,259,588 | 104,388,792 | K0.120 | – | – | – | K0.250 | – | 12.76% |
| NGP | 45,890,700 | 61,952,445 | K0.030 | – | K0.120 | K0.120 | K0.040 | – | 11.85% |
| CCP | 307,931,332 | 1,434,960,007 | K0.110 | K0.130 | K0.121 | K0.121 | K0.121 | – | 5.19% |
| CPL | 206,277,911 | 132,017,863 | K0.050 | – | – | – | K0.050 | – | 7.81% |
| SST | 31,008,237 | 1,550,411,850 | K0.350 | K0.600 | K0.300 | K0.300 | K0.400 | – | 1.40% |
| TOTAL | 607,910,290,679 | 6.02% |
a LTM = Last Twelve Months. We have calculated yields based on most recently declared
interim and final dividends.
* NEM pays quarterly dividends. We have added last 4 payments at current FX rates.
Dividend yield – is calculated by dividing a company’s annual dividends per share by its current share price and expressing the result as a percentage.


Domestic Markets Department – Money Markets Operations Unit
Auction Number: 18 FEB-26 / GOI / Government Treasury Bill
Settlement Date: 20-FEB-26
Amount on Offer: K270.000 million
|
TERMS |
ISSUE ID |
ISSUE ID |
ISSUE ID |
ISSUE ID |
ISSUE ID |
TOTAL |
|
Weighted Average Yield |
0.000 |
0.00% |
5.19% |
5.30% |
5.58% |
|
|
Amount on offer Kina Million |
0.000 |
0.000 |
20.000 |
50.00 |
200.000 |
270.000 |
|
Bids Received Kina Million |
0.00 |
0.000 |
52.270 |
73.240 |
524.970 |
650.480 |
|
Successful Bids Kina Million |
0.00 |
0.000 |
31.870 |
73.240 |
174.970 |
280.080 |
|
Overall Auction OVER-SUBSCRIBED by |
0.00 |
0.000 |
32.270 |
23.240 |
324.970 |
280.480 |
Domestic Markets Department – Money Markets Operations Unit
Auction Number: 17-FEB-26 / GOB / Government Bond
Settlement Date: 20-FEB-26
Amount on Offer: K380.000 million
|
SERIES |
Amount on Offer (K’million) |
Bids Received (K’million) |
Successful |
Successful |
Weighted Average Rate |
Coupon Rate |
Overall |
| Issue ID 2026/5057 (3 years) |
60.000 |
118.000 |
58.000 |
6.30%-6.38% |
6.37% |
5.75% |
K58.000 |
|
Issue ID 2026/5058 (5 years) |
90.000 |
210.000 |
110.000 |
6.50%-6.83% |
6.72% |
6.00% |
K120.000 |
|
Issue ID 2026/5059 (7 years) |
70.000 |
148.000 |
78.000 |
6.70%-6.80% |
6.76% |
6.25% |
K78.00 |
|
Issue ID 2026/5060 (10 years) |
100.000 |
195.80 |
95.80 |
6.00%-7.06% |
7.05% |
6.50% |
K95.80 |
|
Issue ID 2026/5061 (15 years) |
60.000 |
122.000 |
52.00 |
7.46%-7.46% |
7.46% |
6.75% |
K62.00 |
| TOTAL
|
380.00 |
793.800 |
393.000 |
|
|
|
K413.800 |
What we have been reading
Stock-Bond Diversification Offers Less Protection From Market Selloffs

IMF
Tobias Adrian, Johannes Kramer, Sheheryar Malik
Feb 18, 2026
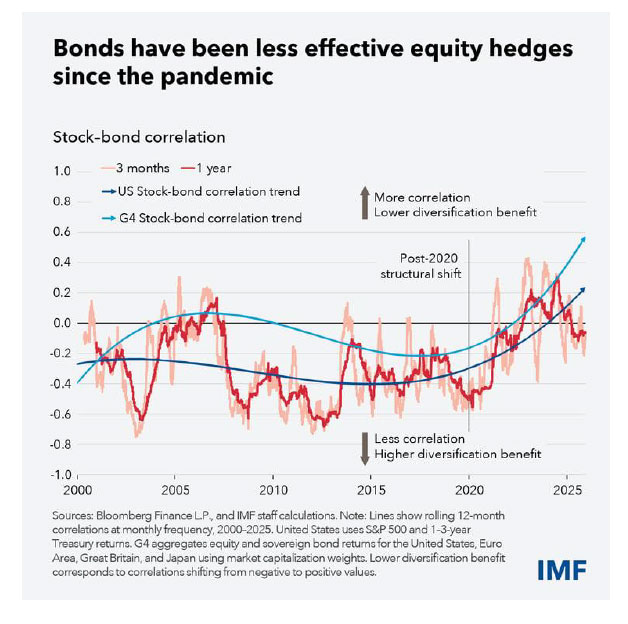
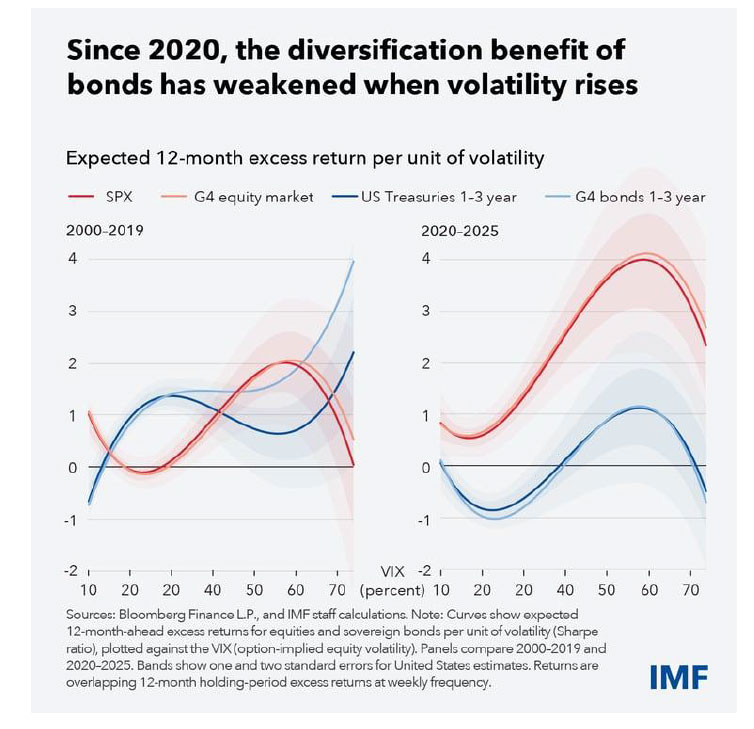
Diversification has become harder since 2020 as stocks and bonds tend to move in tandem during sharp selloffs, adding to financial stability concerns
Spreading investments across asset classes can reduce risk and smooth returns. The classic diversification between stocks and bonds worked historically because they moved in opposite directions. When stocks fell, investors sought safety in bonds. Bonds rallied, cushioning losses and stabilizing portfolios.
Since the start of the pandemic period—with supply shocks that fueled inflation—bonds have become less effective in cushioning volatility in stocks. Instead of offsetting equity risk, bonds are increasingly moving in tandem with stocks. This shift is particularly pronounced during sharp market selloffs, with profound implications for investors and policymakers alike.
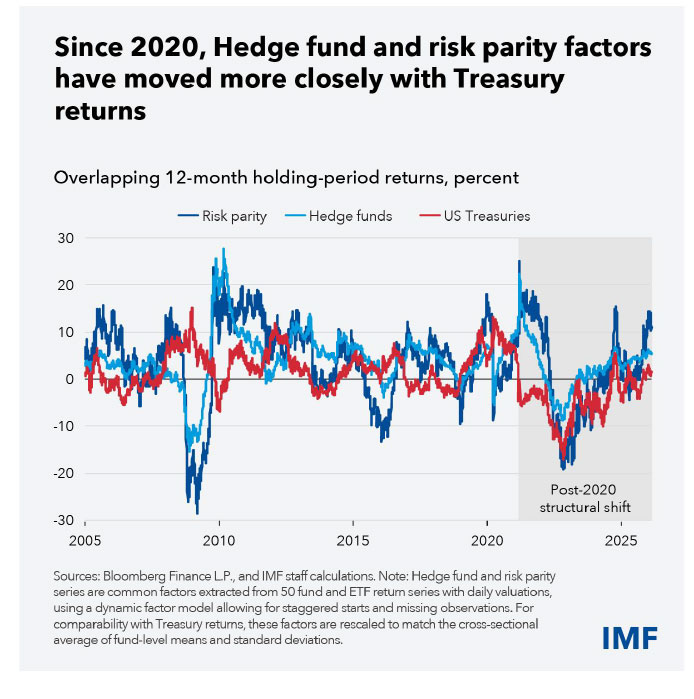
The breakdown of this historical relationship makes diversification—such as the classic portfolio, of 60 percent stocks and 40 percent bonds, or risk parity strategies—vulnerable to shocks. Hedge fund and risk parity investment strategies that employ leverage based on the historical relationship are now increasingly moving in tandem with Treasury returns, which could make them vulnerable to forced deleveraging. Even conservative institutional investors like pension funds and insurers could be exposed to greater portfolio volatility during market corrections.
Corrections tend to be sharp, accompanied by a surge in stock market volatility. This amplifies systemic vulnerabilities as volatility can feed into selloff dynamics by worsening investors’ funding constraints and forcing deleveraging.
From 2000 to 2019, the inverse relationship between expected stock and bond returns helped investors effectively manage risk. Tracing standardized expected returns for stocks and bonds against the VIX shows a clear divergence: As volatility rises, expected returns for equities increase as stock prices fall, while expected returns for bonds decline as bond prices rise. This was the foundation of diversification strategies.
The changed relationship since 2020—with both asset classes tending to sell off concurrently in response to rising market stress—reinforces equity risk in the United States as well as, to varying degrees, Germany, Japan, and the United Kingdom.
This breakdown may explain the severity of recent market selloffs: losses compound when both assets fall together.
The diminished hedging properties are increasingly evident in the sharp rallies in gold, silver, platinum and palladium, as well as currencies such as the Swiss franc. Gold, for example, has more than doubled since the start of 2024 as investors sought alternative safe havens in recent months. Platinum and palladium jumped in the final quarter of last year, reflecting diversification shifting toward non-sovereign stores of value.
Amid the hedging breakdown, higher volatility coincides with higher expected bond returns, with prices declining steeply in the current period as investors reprice term premiums. Over the past few years, expanding bond supply to finance widening fiscal deficits across most advanced economies, which we also explored in the October 2025 Global Financial Stability Report, has heightened investor concerns. At the same time, gross issuance of bonds has outpaced central bank balance-sheet runoff, that is, bonds maturing without reinvestment. With central banks reducing holdings via runoff, a larger share of bond supply must be absorbed by price sensitive private investors. This gap has become more evident since late 2023 as central banks’ balance sheet runoff slowed while issuance stayed elevated. Overall, the supply absorbed is many times larger than the reduction in central bank holdings over the past few years in the four largest advanced economies. With inflation still above target in many economies, fiscal concerns increasingly raise term premiums as investors see bonds as riskier, eroding their suitability for hedging. Investors may demand higher compensation for holding longer maturities, reinforcing upward pressure on term premiums and further eroding hedges. With fiscal expansion expected to continue, this upward pressure may be reinforced if corporate capital investment is increasingly financed by debt issuance. These effects could be reduced by greater productivity growth, bringing down inflation and allowing government to issue bonds with shorter maturities.
Policy challenges
Central banks will undoubtedly intervene to stabilize bond markets during periods of extreme stress, but this has limits. Relying on emergency measures can lead to excessive risk-taking and undermine market discipline. A more durable solution, restoring the hedging properties of sovereign bonds, requires fiscal discipline. High debt levels globally and uncertain fiscal trajectories weaken the safe-haven status of government securities. Without credible fiscal frameworks, bonds cannot serve as reliable anchors in turbulent markets. Central banks also must commit to ensuring price stability. The unexpected rise of inflation since 2020 has been a key contributor to the reversal in stock-bond correlations. Regulators should also incorporate correlation breakdown scenarios into stress tests. Financial institutions need to prepare for traditional diversification to fail, as models calibrated on historical correlations may underestimate new risks.
Rethinking risk
With diminished diversification, investors must build portfolios that account for the shift in correlations. Alternative strategies—such as incorporating commodities or private assets—may offer partial solutions, but they come with their own complexities and risks.
Policymakers face even greater challenges. Maintaining financial stability amid high correlation risk requires credible fiscal and monetary policy frameworks, robust stress testing, and clear communication to anchor expectations. If diversification fails, volatility can cascade into broader financial instability. Investors and policymakers must rethink risk management for a new era where traditional hedges fail.
Regards,
JMP Securities Team
a. Level 3, ADF Haus, Musgrave St., Port Moresby NCD Papua New Guinea
p. PO Box 2064, Port Moresby NCD Papua New Guinea
Email: lars.mortensen@jmpmarkets.com
Ph: +675 7200 2233
Mobile: +675 7056 5124
Email: nathan.chang@jmpmarkets.com
Ph: +675 7167 3223
Mobile: +61 422 113 630