23 – 27 February 2026
Weekly Trade Commentary
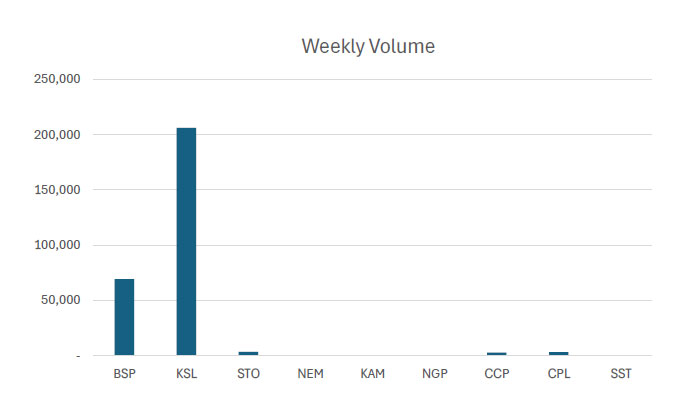
- Last week saw 5 stocks traded on the local market with a total trading value of K2,605,932.22.
- BSP traded 69,197 shares high by 31t at K25.36.
- KSL traded 203,093 shares high by 10t, closing at K3.95.
- STO traded 3,337 shares high by 5t at K20.05.
- CCP traded 2,872 shares high by 1t at K4.66.
- Lastly, CPL traded 3,123 shares steady, closing at K0.64.
WEEKLY MARKET REPORT | 23 February, 2026 – 27 February, 2026
| STOCK | WEEKLY VOLUME |
CLOSING PRICE | VALUE | BID | OFFER | CHANGE | % CHANGE |
| BSP | 69,197 | 25.36 | 1,734,335.72 | 25.06 | – | 0.31 | 1.24% |
| KSL | 206,093 | 3.95 | 789,290.83 | 3.95 | 4.00 | 0.10 | 2.60% |
| STO | 3,337 | 20.05 | 66,906.85 | 20.00 | 22.00 | 0.05 | 0.25% |
| NEM | – | 480.00 | – | 500.00 | – | – | – |
| KAM | – | 1.96 | – | 1.98 | – | – | – |
| NGP | – | 1.35 | – | – | – | – | – |
| CCP | 2,872 | 4.67 | 13,400.10 | 4.66 | – | – | – |
| CPL | 3,123 | 0.64 | 1,998.72 | – | 0.64 | 0.01 | 0.21% |
| SST | – | 50.00 | – | – | 50.00 | – | – |
| 284,622 | TOTAL | 2,605,932.22 | 0.42% |
Key takeaways:
- PLC – Application for quotation of securities Downloads >>
- Market Announcement: CPL – Appointment of CEO Mr. Ajay Patel and staff movements Downloads >>
- Appendix 10A Download >>
- Final Notice of Directors Interest Download >>
- Market Announcement: STO – Unquoted securities and Appendix 3Y Download >>
- STO Notification of Cessation of Securities Download >>
- STO Notification Regarding Unquoted Securities 4 Download >>
- STO Notification Regarding Unquoted Securities 5 Download >>
- STO Appendix 3Y Download >>
- Market Announcement: KSL – Full Year Results 2025 Download >>
- KSL Full Year Results 2025 Download >>
- KSL Appendix 5C Download >>
- KSL 2025 Investor Presentation Download >>
- KSL Appendix 3A-1 Dividend Notice Download >>
- Market Announcement: NEM filings Download >>
- Market Announcement: BSP – Appendix 10B Notice of Change In CEOs-Interests – Mark Robinson Download >>
WEEKLY YIELD CHART | 16 February, 2026 – 20 February, 2026
| STOCK | NUMBER ISSUED OF SHARES |
MARKET CAP |
2023 INTERIM DIV |
2023 FINAL DIV |
2024 INTERIM DIV |
2024 FINAL DIV |
2025 INTERIM DIV |
2026 FINAL DIV |
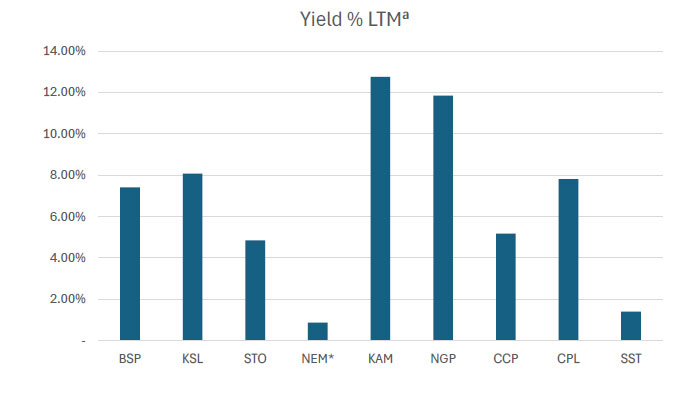
YIELD % LTM |
| BSP | 467,317,665 | 11,851,175,984 | K0.370 | K1.060 | K1.210 | K1.210 | K0.500 | K1.380 | 7.41% |
| KSL | 292,965,754 | 1,157,214,728 | K0.100 | K0.160 | K0.106 | K1.155 | K0.126 | K0.193 | 8.08% |
| STO | 3,261,616,703 | 65,395,414,895 | K0.310 | K0.660 | k0.506 | K0.414 | K0.559 | (USD) $0.103 | 4.85% |
| NEM* | 1,097,000,000 | 537,530,000,000 | – | – | – | K2.110 | K2.110 | (USD) $0.260 | 0.88% |
| KAM | 53,259,588 | 104,388,792 | K0.120 | – | – | – | K0.250 | – | 12.76% |
| NGP | 45,890,700 | 61,952,445 | K0.030 | – | K0.120 | K0.120 | K0.040 | – | 11.85% |
| CCP | 307,931,332 | 1,438,039,320 | K0.110 | K0.130 | K0.121 | K0.121 | K0.121 | – | 5.18% |
| CPL | 206,277,911 | 132,017,863 | K0.050 | – | – | – | K0.050 | – | 7.81% |
| SST | 31,008,237 | 1,550,411,850 | K0.350 | K0.600 | K0.300 | K0.300 | K0.400 | – | 1.40% |
| TOTAL | 608,250,615,879 | 6.01% |
a LTM = Last Twelve Months. We have calculated yields based on most recently declared
interim and final dividends.
* NEM pays quarterly dividends. We have added last 4 payments at current FX rates.
Dividend yield – is calculated by dividing a company’s annual dividends per share by its current share price and expressing the result as a percentage.


Domestic Markets Department – Money Markets Operations Unit
Auction Number: 25 FEB-26 / GOI / Government Treasury Bill
Settlement Date: 27-FEB-26
Amount on Offer: K350.000 million
|
TERMS |
ISSUE ID |
ISSUE ID |
ISSUE ID |
ISSUE ID |
ISSUE ID |
TOTAL |
|
Weighted Average Yield |
0.000 |
0.00% |
5.37% |
5.49% |
5.61% |
|
|
Amount on offer Kina Million |
0.000 |
0.000 |
30.000 |
70.00 |
250.000 |
350.000 |
|
Bids Received Kina Million |
0.00 |
0.000 |
48.34 |
99.29 |
445.40 |
593.03 |
|
Successful Bids Kina Million |
0.00 |
0.000 |
48.34 |
99.29 |
308.40 |
456.03 |
|
Overall Auction OVER-SUBSCRIBED by |
0.00 |
0.000 |
18.34 |
29.29 |
195.40 |
243.030 |
Domestic Markets Department – Money Markets Operations Unit
Auction Number: 17-FEB-26 / GOB / Government Bond
Settlement Date: 20-FEB-26
Amount on Offer: K380.000 million
|
SERIES |
Amount on Offer (K’million) |
Bids Received (K’million) |
Successful |
Successful |
Weighted Average Rate |
Coupon Rate |
Overall |
| Issue ID 2026/5057 (3 years) |
60.000 |
118.000 |
58.000 |
6.30%-6.38% |
6.37% |
5.75% |
K58.000 |
|
Issue ID 2026/5058 (5 years) |
90.000 |
210.000 |
110.000 |
6.50%-6.83% |
6.72% |
6.00% |
K120.000 |
|
Issue ID 2026/5059 (7 years) |
70.000 |
148.000 |
78.000 |
6.70%-6.80% |
6.76% |
6.25% |
K78.00 |
|
Issue ID 2026/5060 (10 years) |
100.000 |
195.80 |
95.80 |
6.00%-7.06% |
7.05% |
6.50% |
K95.80 |
|
Issue ID 2026/5061 (15 years) |
60.000 |
122.000 |
52.00 |
7.46%-7.46% |
7.46% |
6.75% |
K62.00 |
| TOTAL
|
380.00 |
793.800 |
393.000 |
|
|
|
K413.800 |
What we have been reading
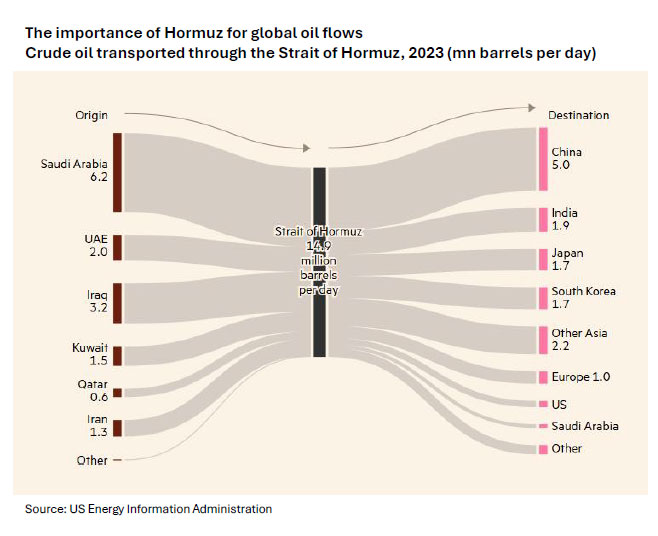
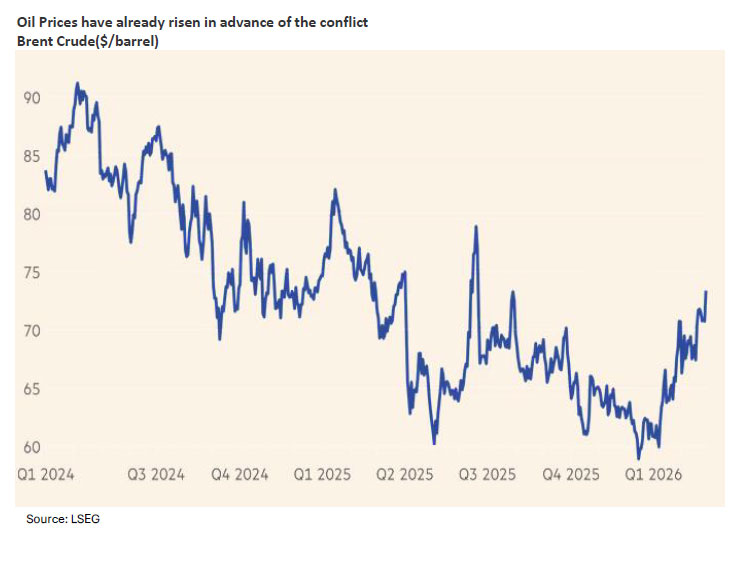
Conflict has exposed how much growth depends on energy supplies through the Strait of Hormuz

FINANCIAL TIMES
Claire Jones & Sam Fleming
March 01, 2026
As Donald Trump has over the past year started a trade war, attacked US institutions including the Federal Reserve and threatened allies over Greenland, global growth has proved resilient. Inflation has continued to subside and equity markets in Europe and elsewhere have marked fresh highs despite the shocks. Now, as the US and Israel’s assault on Iran spills into a wider regional conflict, oil markets are the key channel to determine whether that relatively benign trajectory will continue, given the potential for the conflagration to disrupt supplies. The question is whether the US and its partners can avert a sustained shutdown of energy shipments through the Strait of Hormuz, which runs along Iran’s southern coast. If traffic continues to flow and price increases are curbed by Sunday’s decision by oil producers to lift output, the damage to growth could prove contained. If not, a surge in energy prices risks reigniting inflation in major economies, derailing central bank rate-cutting plans and shaking business confidence. “Oil is the critical channel,” said Neil Shearing, chief economist at Capital Economics.
How steep could the oil price surge be? There are two main scenarios for energy markets, said Edward Fishman, a senior fellow at the Council on Foreign Relations and author of Chokepoints, a book on US economic warfare. Under one, there is a “significant and prolonged disruption of all traffic through the Strait of Hormuz, which is the most important maritime chokepoint in the world”, he said. Given the Strait carries about one in five barrels of oil in the world, if it is shut down “you are dealing with a monumental shock to the global oil price”. Such a scenario could launch oil prices above $100 a barrel, analysts predict. Brent crude is already near a seven-month high of $73 a barrel, having risen nearly 12 per cent over the past month given rising expectations of a conflict between the US and Iran.Natural gas markets would also be impacted, triggering inflationary pressures in major markets including Europe. The more likely and less damaging scenario is that there is not a full closure of the Strait, but that Iran’s own oil sales get shut down, Fishman argued. If this happens a surge in the oil price to at least $80 a barrel is more likely.
If other oil producers increase output the impact could be more limited. On Sunday Opec+ said it would raise oil production in April by 206,000 barrels a day, as the Saudi Arabia-led oil producer group sought to calm crude markets. The rise is less than some analysts and Opec+ watchers had expected. A $10 a barrel surge in oil prices “will not move the dial” on inflation and growth, said Shearing of Capital Economics.While Iran is an important supplier to economies including China, it is not critical to global oil consumption. It pumped 3.45mn barrels a day of crude oil in January, according to the International Energy Agency, less than 3 per cent of global supply.
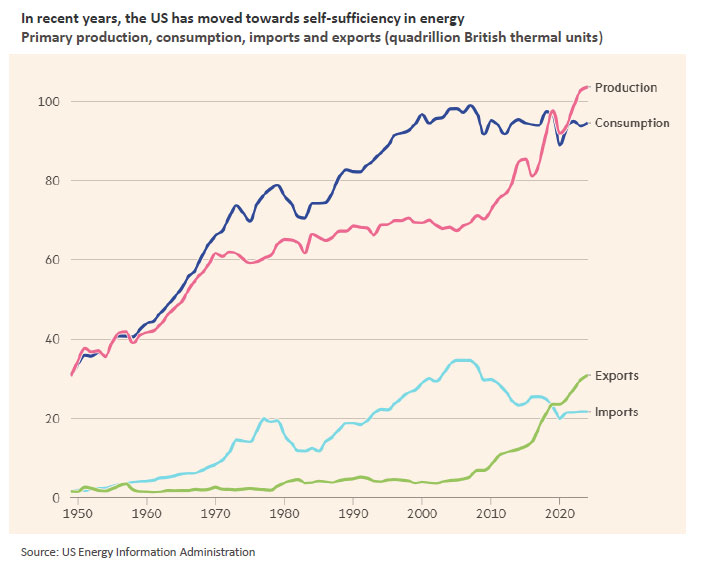
How dangerous would $100 oil be to US growth?
The US is now largely self-sufficient in energy, with figures from the US Energy Information Administration showing that just 17 per cent of the energy used by Americans in 2024 was imported —the lowest share in 40 years.But that doesn’t mean an interruption to Gulf oil flows would be irrelevant to the US economy, given the impact on oil benchmarks.
Corrections tend to be sharp, accompanied by a surge in stock market volatility. This amplifies systemic vulnerabilities as volatility can feed into selloff dynamics by worsening investors’ funding constraints and forcing deleveraging.
What other economic risks will stem from the conflict?
The conflict comes at a febrile time for global financial markets. On Friday US bank stocks had their steepest sell-off since Trump’s tariffs shock in April, given worries about a downturn in private credit and AI-related disruption to major businesses.US tech stocks continued their AI-related descent, bringing declines in February by the Nasdaq Composite to more than 3 per cent.
Regards,
JMP Securities Team
a. Level 3, ADF Haus, Musgrave St., Port Moresby NCD Papua New Guinea
p. PO Box 2064, Port Moresby NCD Papua New Guinea
Email: lars.mortensen@jmpmarkets.com
Ph: +675 7200 2233
Mobile: +675 7056 5124
Email: nathan.chang@jmpmarkets.com
Ph: +675 7167 3223
Mobile: +61 422 113 630