09 – 13 March 2026
Weekly Trade Commentary
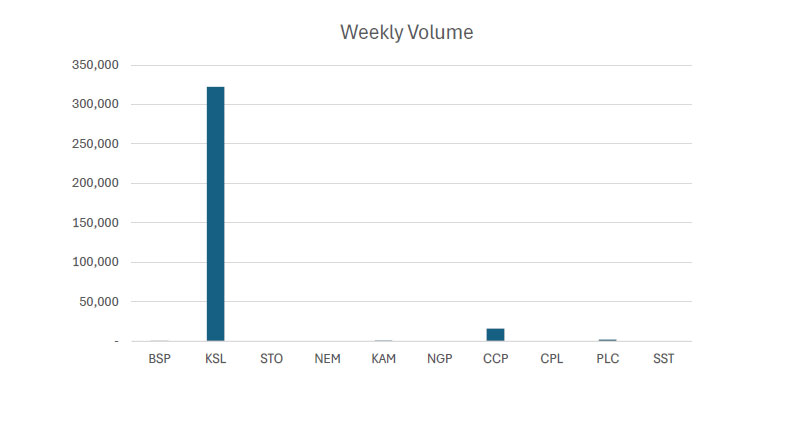
- Last week saw 6 stocks traded on the local market with a total trading value of K1,377,903.13.
- BSP traded only 680 shares steady at K25.37.
- KSL traded 322,416 shares also steady at K3.96.
- NEM traded only traded 8 units but closed high by K20.00 at K500.
- KAM traded only 812 shares high by 1t, closing at K2.00.
- CCP traded 16,149 shares low by 1t, closing at K4.66.
- PLC records its first ever trade on PNGX, Trading 2,000 units, closing the week of at K1.10.
WEEKLY MARKET REPORT | 09 March, 2026 – 13 March, 2026
| STOCK | WEEKLY VOLUME | CLOSING PRICE | VALUE | BID | OFFER | CHANGE | % CHANGE |
|---|---|---|---|---|---|---|---|
| BSP | 680 | 25.37 | 17,254.64 | 25.37 | 26.90 | – | – |
| KSL | 322,416 | 3.96 | 1,277,540.04 | 3.95 | 4.00 | – | – |
| STO | – | 21.50 | – | 21.00 | – | – | – |
| NEM | 8 | 500.00 | 4,000.00 | 490.00 | – | 20.00 | 4.17% |
| KAM | 812 | 2.00 | 1,623.11 | 2.00 | – | 0.01 | 0.50% |
| NGP | – | 1.35 | – | – | – | – | – |
| CCP | 16,149 | 4.66 | 75,285.34 | – | – | (0.01) | (0.12%) |
| CPL | – | 0.65 | – | – | 0.65 | – | – |
| PLC | 2,000 | 1.10 | 2,200.00 | – | 1.10 | – | – |
| SST | – | 50.00 | – | – | 50.00 | – | – |
| 342,065 | TOTAL | 1,377,903.13 | 3.59% |
 Key takeaways:
- Market Announcement: STO-Santos takes FID on Moomba Central Download >>
- Market Announcement: CPL – IFC Healthcare Delivery Partnership Downlaod >>
- Market Announcement: KAM – Kina Asset Management Ltd Full Year Results 2025 Download >>
- Market Announcement: KAM – Market Release Download >>
- Market Announcement: KAM – FY2025 Financial Statement Signed Download >>
- KAM -NTA as at 28th February 2026 Downlaod >>
- Market Announcement: PLC – Application for quotation of securities Download >>
- PLC – Execution of Project Development Agreement Download >>
- Market Announcement: CCP – Credit Corp Limited Ltd Full Year Results 2025 Download >>
- Market Announcement: CCP – FY2025 Final Download >>
- Market Announcement: CCP – FY2025 Investor Pack Final Download >>
- STO: Notice of Annual General Meeting Download >>
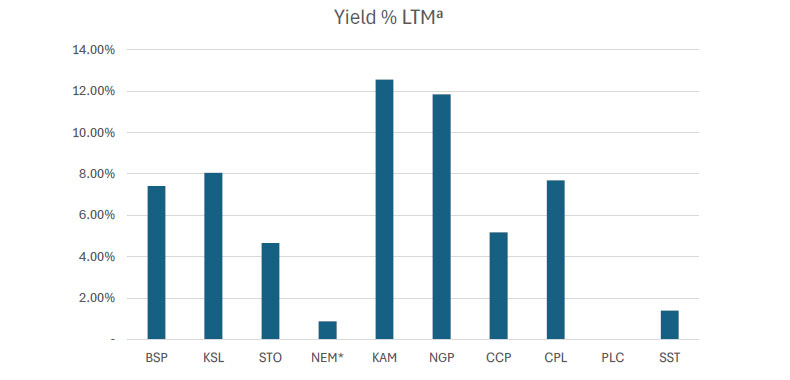
WEEKLY YIELD CHART | 09 March, 2026 – 13 March, 2026
| Stock | Number Issued of Shares | Market Cap | 2023 Interim Div | 2023 Final Div | 2024 Interim Div | 2024 Final Div | 2025 Interim Div | 2026 Final Div | Yield % LTM |
|---|---|---|---|---|---|---|---|---|---|
| BSP | 467,317,665 | 11,855,849,161 | K0.370 | K1.060 | K0.450 | K1.210 | K0.500 | K1.380 | 7.41% |
| KSL | 292,965,754 | 1,160,144,386 | K0.100 | K0.160 | K0.106 | K1.155 | K0.126 | K0.193 | 8.06% |
| STO | 3,261,616,703 | 70,124,759,115 | K0.310 | K0.660 | K0.506 | K0.414 | K0.559 | K0.443 | 4.66% |
| NEM* | 1,097,000,000 | 548,500,000,000 | – | – | – | K2.110 | K2.110 | (USD) $0.260 | 0.84% |
| KAM | 53,259,588 | 106.519.176 | K0.120 | – | K0.200 | – | K0.250 | – | 11.85% |
| NGP | 45,890,700 | 61,952,445 | K0.030 | – | K0.040 | K0.120 | K0.040 | – | 11.85% |
| CCP | 307,931,332 | 1,434,960,007 | K0.110 | K0.130 | K0.120 | K0.121 | K0.121 | K0.130 | 5.39% |
| CPL | 206,277,911 | 134,080,642 | K0.050 | – | – | – | K0.050 | – | 7.69% |
| PLC | 847,612,686 | 938,038,955 | – | – | – | – | – | – | – |
| SST | 31,008,237 | 1,550,411,850 | K0.350 | K0.600 | K0.300 | K0.300 | K0.400 | – | 1.40% |
| TOTAL | 635,866,715,736 | 5.80% |
a LTM = Last Twelve Months. We have calculated yields based on most recently declared
interim and final dividends.
* NEM pays quarterly dividends. We have added last 4 payments at current FX rates.
Dividend yield – is calculated by dividing a company’s annual dividends per share by its current share price and expressing the result as a percentage.

Domestic Markets Department – Money Markets Operations Unit
Auction Number: 11 MAR-26 / GOI / Government Treasury Bill
Settlement Date: 13-MAR-26
Amount on Offer: K350.000 million
| TERMS | ISSUE ID 2025 / 63 | ISSUE ID 2025 / 91 | ISSUE ID 2025 / 4741 182 | ISSUE ID 2025 / 4700 273 | ISSUE ID 2025 / 4743 364 | TOTAL |
|---|---|---|---|---|---|---|
| Weighted Average Yield | 0.000 | 0.00% | 5.44% | 5.62% | 5.63% | |
| Amount on Offer Kina Million | 0.000 | 0.000 | 30.000 | 70.000 | 250.000 | 350.000 |
| Bids Received Kina Million | 0.000 | 0.000 | 48.380 | 73.000 | 462.040 | 583.420 |
| Successful Bids Kina Million | 0.000 | 0.000 | 16.380 | 73.000 | 261.040 | 350.420 |
| Overall Auction OVER-SUBSCRIBED by | 0.000 | 0.000 | 18.380 | 3.000 | 212.050 | 233.420 |
Domestic Markets Department – Money Markets Operations Unit
Auction Number: 17-FEB-26 / GOB / Government Bond
Settlement Date: 20-FEB-26
Amount on Offer: K380.000 million
| SERIES | Amount on Offer (K’million) | Bids Received (K’million) | Successful Bids (K’million) | Successful Bids Yield | Weighted Average Rate (WAR) | Coupon Rate | Overall Auction Net Subscription |
|---|---|---|---|---|---|---|---|
| Issue ID 2026/5057 (3 years) | 60.000 | 118.000 | 58.000 | 6.30%-6.38% | 6.37% | 5.75% | K58.000 |
| Issue ID 2026/5058 (5 years) | 90.000 | 210.000 | 110.000 | 6.50%-6.83% | 6.72% | 6.00% | K120.000 |
| Issue ID 2026/5059 (7 years) | 70.000 | 148.000 | 78.000 | 6.70%-6.80% | 6.76% | 6.25% | K78.00 |
| Issue ID 2026/5060 (10 years) | 100.000 | 195.80 | 95.80 | 6.00%-7.06% | 7.05% | 6.50% | K95.80 |
| Issue ID 2026/5061 (15 years) | 60.000 | 122.000 | 52.00 | 7.46%-7.46% | 7.46% | 6.75% | K62.00 |
| TOTAL | 380.000 | 793.800 | 393.000 | K413.800 |

INTERNATION MONETARY FUND
By: ATIF MIAN
F&D MAGAZINE
Extreme inequality is fueling a global debt crisis
During the Great Depression, as he saw ordinary people’s purchasing power collapse, Federal Reserve Chairman Marriner Eccles warned that excessive saving by the rich was draining demand and deepening the downturn.“To protect them from the results of their own folly,” Eccles told the Senate in 1933 testimony,“we should take from them a sufficient amount of their surplus to enable consumers to consume and business to operate at a profit.”
Inequality in the US was then extremely high: The top 1 percent held roughly 42 percent of all wealth. Within a decade, however, the landscape changed dramatically. World War II mobilization and progressive taxation reduced inequality and restored balance between spending and production. The underlying problem that Eccles emphasized faded from public memory as the US economy entered a long period of sustained and more equitable growth.
However, beginning in the 1980s, inequality climbed again: The top 1 percent’s wealth share rose from about 22 percent in 1980 to roughly 35 percent in 2010. As more income concentrated at the top, the forces Eccles warned against reemerged—high saving by the wealthy weakened overall purchasing power. Yet the expected demand shortfall did not appear immediately: Spending was funded by rising private debt of households below the top. From the mid-1980s through the early 2000s, the rapid buildup of household debt absorbed the excess saving of the rich and sustained aggregate demand.
The global financial crisis of 2008 ended the long run of debt-financed household spending. With deleveraging of private balance sheets, the underlying imbalance Eccles warned about returned with a vengeance: excess saving at the top and insufficient broad-based demand at the bottom. The Fed cut rates to zero, but monetary policy could not close the gap. Fiscal policy was left to carry the load—accept a deep, prolonged slump or run large primary deficits to stabilize incomes and employment. The US chose the latter.
In the Keynesian view, deficits help the economy recover faster in downturns, but the need for them is temporary. When the demand shortfall is structural—driven by persistently high saving of top-income households that capture a large share of total income—the need for deficits is more persistent. In a recent paper, “A Goldilocks Theory of Fiscal Deficits,” Amir Sufi, Ludwig Straub, and I show that rising inequality can force governments to run larger, ongoing deficits. Deficits must be large enough to keep the economy away from the zero lower bound (when nominal interest rates reach zero and monetary policy ceases to be effective) and to prevent recessions.
A rising saving glut—excess saving among higher-income households—forces the economy to rely increasingly on debt-financed spending to sustain aggregate demand. Before 2008, the financial system did this by expanding household credit, which supported consumption even as inequality rose. When private credit expansion abruptly ended during the financial crisis, the burden of credit creation shifted to the public sector, as evidence from the US shows.
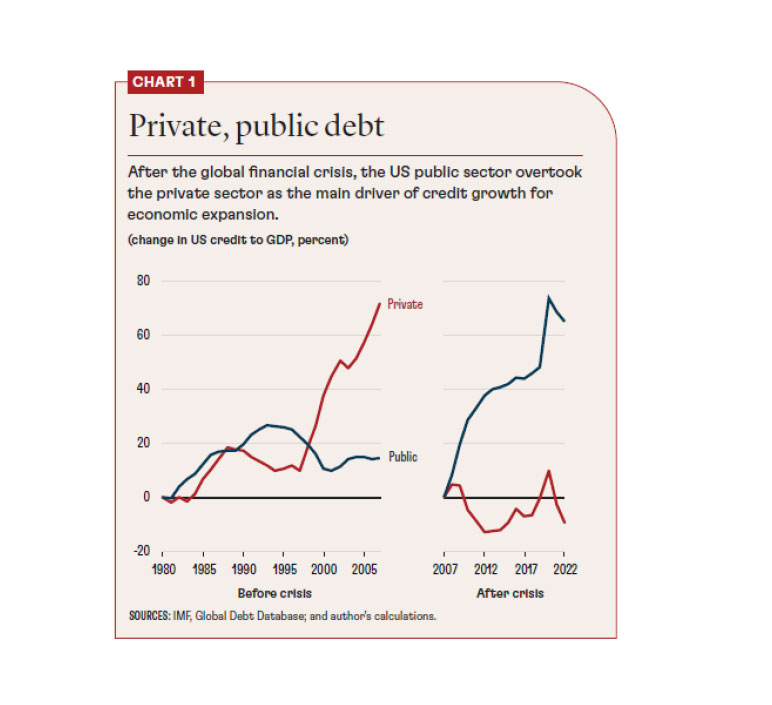
Chart 1 shows that total credit (public plus private) rises sharply starting in the early 1980s. The blue and red lines decompose the total into private and public credit, separating the precrisis (1980–2008) and postcrisis (2008 onward) periods. From 1980 to 2008, nearly all of the increase in total credit reflects a surge in private borrowing; public debt is comparatively stable.
After 2008, the pattern reverses. Even with the federal funds rate near zero, the private sector could not—or would not—raise leverage further, so sustaining demand required credit growth from the public sector. This is the logic of the“Goldilocks” view of fiscal deficits: When private balance sheets are constrained, public borrowing can offset the demand shortfall and help avoid a prolonged slump. Consistent with that prediction, total credit to GDP continues to rise after 2008 at roughly the earlier pace, but almost entirely because public debt increases, while private credit remains broadly flat relative to GDP.
A saving glut in the presence of a zero-lower-bound constraint forces government to increase debt and deficits, but the government also faces a dynamic budget constraint. Push the deficit too far and, over time, interest rates on public debt can rise, making the debt path unsustainable. High inequality and resulting excess saving by the rich present a Goldilocks conundrum for fiscal policy: Deficits cannot be“too cold” (too small to offset the demand shortfall) or“too hot” (so large that they destabilize debt dynamics). The data suggest that the US was operating near this upper bound in 2019—close to the largest deficit sustainable in the long term.
The larger, persistent fiscal deficits since then may be leading US debt dynamics down a less sustainable path. US fiscal strain is unlike anything seen in its modern history: Federal debt and net interest costs as shares of GDP are near all-time highs. The fiscal deficit is projected to be about 6 percent of GDP, which would keep debt rising relative to the economy and threaten sustainability.
Global evidence
Saving gluts are rising everywhere. The share of income accruing to the top 1 percent has increased worldwide. Corporations are a tax-advantaged vehicle for the rich to save, so global corporate saving has risen significantly over the past few decades. Wealthy sovereigns are fueling higher saving through central banks and sovereign wealth funds. But global investment has not kept up, leading to a saving glut that needs new unproductive credit to sustain consumption demand. Many major economies mirror the US predicament: increased reliance on debt to generate demand, first through private household debt and later through government debt.
Total debt in the UK, for example, began to rise rapidly in the 1980s, driven primarily by private borrowing until 2008, and by public debt thereafter. Japan followed a similar track but started earlier. Its private credit boom ended in the early 1990s, and public debt subsequently absorbed the adjustment. In the euro area, the launch of the euro in 1999 coincided with a rapid buildup in private credit that culminated in the 2008 crisis; since then, private deleveraging has been accompanied by a shift toward higher public debt.
China
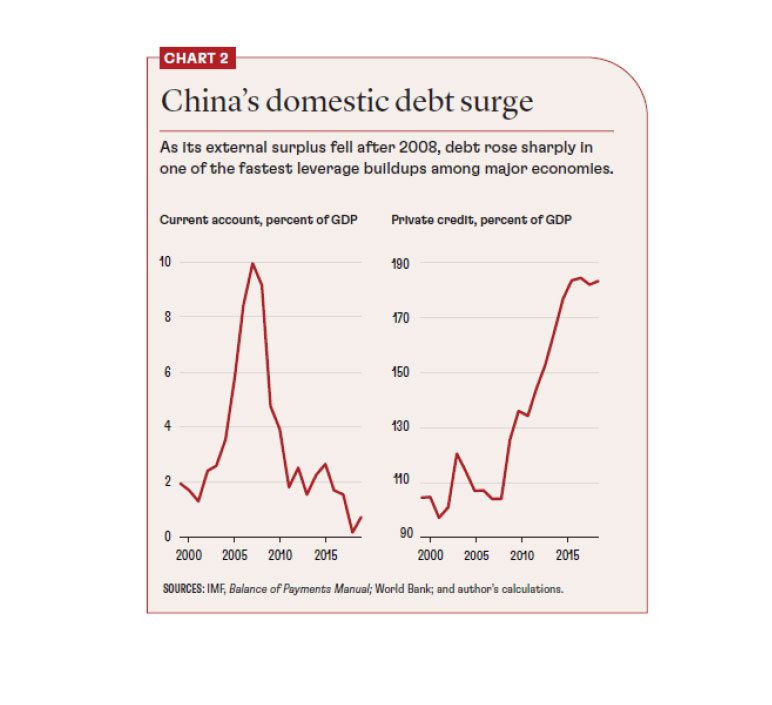
China also came to rely increasingly on debt to support demand. But unlike most large economies, it initially did so by exporting its excess saving abroad—running large current account surpluses that increased the rest of the world’s net debt to China. Those external liabilities, in turn, helped finance spending on Chinese goods.
For much of the 2000s, China’s current account surplus rose sharply as a share of GDP, even as GDP itself expanded at an extraordinary pace (Chart 2). On the eve of the 2008 financial crisis, the surplus approached 10 percent of GDP—exceptionally high for a major economy. Such a large external imbalance was unlikely to be sustainable.
As advanced economies could no longer sustain demand through ever-rising private credit—especially after 2008—China’s earlier strategy of exporting excess saving abroad faced limits. Continued expansion of net lending abroad that could sustain very large trade surpluses became increasingly difficult. Both sides adjusted by shifting debt creation to new sources: Advanced economies relied more on fiscal deficits, and China turned to domestic credit expansion to support demand in the face of its own saving glut.
As China’s external surplus receded to more moderate levels after 2008, domestic debt to GDP rose sharply. The increase was broad-based—extending beyond corporate and local government borrowing to include rapid growth in household debt—and represents one of the fastest domestic leverage buildups observed among major economies.
Why does investment not rise?
Why didn’t financial markets channel abundant funds into productive investment? Despite rising total debt to GDP, investment to GDP in major economies has remained broadly flat and sometimes has even edged down. Is this because the financial system is not conducive to long-term, patient financing? Or do regulatory and other supply-side constraints inhibit investment?
When excess saving is channeled into unproductive debt that finances consumption rather than investment, borrowers do not generate additional income that can repay the new debt in the aggregate. The result is persistently rising debt to GDP and downward pressure on interest rates to keep the debt sustainable. In earlier work, we refer to this dynamic as “indebted demand”: growth sustained by borrowing because underlying spending power is insufficient.
The ultimate fragility
The central risk of relying on indebted demand is that it’s inherently fragile. Once private borrowers reach their limits—as they did in 2008—maintaining demand requires a larger and more persistent fiscal backstop, which is the reason for rising postcrisis public deficits and debt. It’s why today’s global fiscal fragility is not an isolated policy choice but the downstream result of an economic system’s failure to convert abundant saving into productive investment.
The question today is whether the US government can rein in fiscal spending if markets get nervous. Political polarization and legislative gridlock mean that confidence is limited. The more profound lesson, though, is that structural imbalances—rooted in excess saving by the rich—create the very conditions that expose the economy to such risks. Expecting policymakers to keep deficits in a perpetual Goldilocks range is unrealistic: When inequality suppresses demand, they may err on the side of too little support, as in Eccles’s era; at other times, they may leave deficits too large for too long, as many fear is happening now.
We often frame inequality in moral terms, but the macro lesson is starker: When too much income pools at the top, demand weakens, deficits persist, and dependence on debt weakens us all. Eccles captured that collective logic in 1933. His advice to take some of the surplus from the wealthiest so that consumers can consume and businesses can make profits is as relevant today as then. As Eccles remarked, “This is not ‘soaking the rich’; it is saving the rich.”
Regards,
JMP Securities Team
a. Level 3, ADF Haus, Musgrave St., Port Moresby NCD Papua New Guinea
p. PO Box 2064, Port Moresby NCD Papua New Guinea
Email: lars.mortensen@jmpmarkets.com
Ph: +675 7200 2233
Mobile: +675 7056 5124
Email: nathan.chang@jmpmarkets.com
Ph: +675 7167 3223
Mobile: +61 422 113 630