16 – 20 March 2026
Weekly Trade Commentary
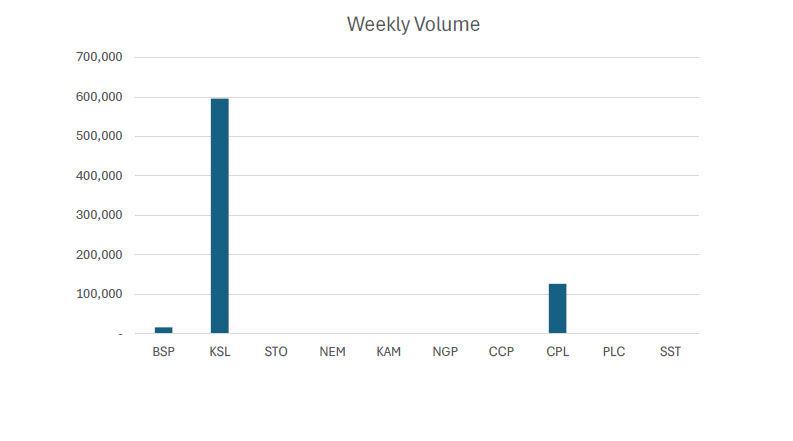
- Last week saw only 3 stocks traded on the local market with a total trading value of K2,911,789.92.
- BSP traded 16,514 shares. Up by K1.53 closing at K26.90.
- KSL traded 595,804 shares high by 2t closing at K3.98.
- Lastly, CPL traded 126,408 shares high by 13t closing K0.78.
WEEKLY MARKET REPORT | 16 March, 2026 – 20 March, 2026
| STOCK | WEEKLY VOLUME | CLOSING PRICE | VALUE | BID | OFFER | CHANGE | % CHANGE |
|---|---|---|---|---|---|---|---|
| BSP | 16,514 | 26.90 | 438,025.51 | 26.90 | – | 1.53 | 6.03% |
| KSL | 595,804 | 3.98 | 2,375,041.41 | 3.96 | 4.00 | 0.02 | 0.51% |
| STO | – | 21.50 | – | 21.00 | – | – | – |
| NEM | – | 500.00 | – | – | – | – | – |
| KAM | – | 2.00 | – | 2.00 | – | – | – |
| NGP | – | 1.35 | – | – | – | – | – |
| CCP | – | 4.66 | – | 4.50 | – | – | – |
| CPL | 126,408 | 0.78 | 98,723.00 | – | 0.78 | 0.13 | 20.00% |
| PLC | – | 1.10 | – | – | 1.10 | – | – |
| SST | – | 50.00 | – | – | 50.00 | – | – |
| 738,726 | TOTAL | 2,911,789.92 | 0.92% |
 Key takeaways:
- Market Announcement: KSL – Kina Securities Bond Announcement Download >>
- Market Announcement: CPL – FY25 Appendix 5C & Consolidated Financial Statement Download >> Download >>
- Market Announcement: PLC – Half Year Financial Statements Download >>
- NEM-Form 4 as filed-David Fry Download >>
- BSP | Announcement of Management Changes at BSP Download >>
- Market Announcement: BSP – Appendix 10B Notice of Change In Directors or-CEOs-Interests Download >> Download >>
- Market Announcement: PLC- Appendix 2A- Application for Quotation of Securities Download >>
- Market Announcement: KSL – Notification of Dividend Distribution Download >>
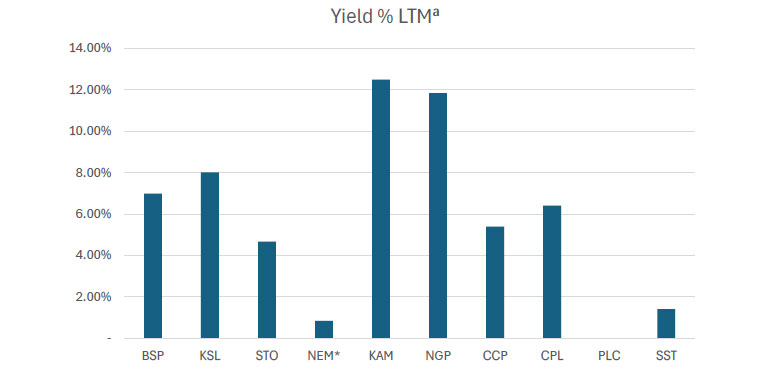
WEEKLY YIELD CHART | 16 March, 2026 – 20 March, 2026
| Stock | Number Issued of Shares | Market Cap | 2023 Interim Div | 2023 Final Div | 2024 Interim Div | 2024 Final Div | 2025 Interim Div | 2025 Final Div | Yield % LTM |
|---|---|---|---|---|---|---|---|---|---|
| BSP | 467,317,665 | 12,570,845,189 | K0.370 | K1.060 | K0.450 | K1.210 | K0.500 | K1.380 | 6.99% |
| KSL | 292,965,754 | 1,166,003,701 | K0.100 | K0.160 | K0.106 | K0.155 | K0.126 | K0.193 | 8.02% |
| STO | 3,261,616,703 | 70,124,759,115 | K0.310 | K0.660 | K0.506 | K0.414 | K0.559 | K0.443 | 4.66% |
| NEM* | 1,097,000,000 | 548,500,000,000 | – | – | – | K2.110 | K2.110 | (USD) $0.260 | 0.84% |
| KAM | 53,259,588 | 106,519,176 | K0.120 | – | K0.200 | – | K0.250 | – | 11.85% |
| NGP | 45,890,700 | 61,952,445 | K0.030 | – | K0.040 | K0.120 | K0.040 | – | 11.85% |
| CCP | 307,931,332 | 1,434,960,007 | K0.110 | K0.130 | K0.120 | K0.121 | K0.121 | K0.130 | 5.39% |
| CPL | 206,277,911 | 160,896,771 | K0.050 | – | – | – | K0.050 | – | 6.41% |
| PLC | 852,762,686 | 938,038,955 | – | – | – | – | – | – | – |
| SST | 31,008,237 | 1,550,411,850 | K0.350 | K0.600 | K0.400 | K0.300 | K0.400 | – | 1.40% |
| TOTAL | 636,614,387,207 | 5.76% |
a LTM = Last Twelve Months. We have calculated yields based on most recently declared interim and final dividends. * NEM pays quarterly dividends. We have added last 4 payments at current FX rates. *PLC now added Dividend yield – is calculated by dividing a company’s annual dividends per share by its current share price and expressing the result as a percentage.
 INVESTOR EDUCATION
- What is a share registry? – is an organization or database that manages a listed company’s records of share ownership, tracking who owns shares, how many are held, and updates when they are bought or sold. They handle administrative tasks for investors, such as issuing holding statements, managing dividend payments, and updating contact and address details. All publicly listed companies on the PNGX are required to maintain a share registry. In PNG, PNG Registries Limited and Computershare are currently the only share registry service providers for publicly listed companies on the PNGX.
- Common Share registry companies – MUFG Corporate Markets – Computershare Limited – Atomic Group – Boardroom Pty Limited *Note the PNG Registries Office in Port Moresby is currently a subsidiary of MUFG Corporate Markets


Domestic Markets Department – Money Markets Operations Unit
Auction Number: 18 MAR-26 / GOI / Government Treasury Bill
Settlement Date: 20-MAR-26
Amount on Offer: K270.000 million
| TERMS | ISSUE ID 2025 / 63 | ISSUE ID 2025 / 91 | ISSUE ID 2025 / 4741 182 | ISSUE ID 2025 / 4700 273 | ISSUE ID 2025 / 4743 364 | TOTAL |
|---|---|---|---|---|---|---|
| Weighted Average Yield | 0.000 | 0.00% | 5.44% | 5.62% | 5.63% | |
| Amount on Offer Kina Million | 0.000 | 0.000 | 20.000 | 50.000 | 200.000 | 270.000 |
| Bids Received Kina Million | 0.000 | 0.000 | 58.500 | 55.000 | 388.470 | 501.970 |
| Successful Bids Kina Million | 0.000 | 0.000 | 33.500 | 50.000 | 199.470 | 282.970 |
| Overall Auction OVER-SUBSCRIBED by | 0.000 | 0.000 | 38.500 | 5.000 | 188.470 | 231.970 |
Domestic Markets Department – Money Markets Operations Unit
Auction Number: 17-MAR-26 / GOB / Government Bond
Settlement Date: 20-MAR-26
Amount on Offer: K200.000 million
| SERIES | Amount on Offer (K’million) | Bids Received (K’million) | Successful Bids (K’million) | Successful Bids Yield | Weighted Average Rate (WAR) | Coupon Rate | Overall Auction Net Subscription |
|---|---|---|---|---|---|---|---|
| Issue ID 2026/5057 (3 years) | 30.000 | 33.45 | 23.45 | 5.75%-6.57% | 6.48% | 5.75% | K3.45 |
| Issue ID 2026/5058 (5 years) | 40.000 | 65.000 | 55.000 | 6.58%-6.89% | 6.80% | 6.00% | K25.000 |
| Issue ID 2026/5059 (7 years) | 50.000 | 68.000 | 68.000 | 6.25%-7.11% | 6.95% | 6.25% | K18.000 |
| Issue ID 2026/5060 (10 years) | 50.000 | 72.000 | 42.000 | 6.05%-7.23% | 7.14% | 6.50% | K22.000 |
| Issue ID 2026/5061 (15 years) | 30.000 | 42.000 | 12.000 | 7.46%-7.55% | 7.48% | 6.75% | K12.000 |
| TOTAL | 200.000 | 780.450 | 200.450 | K80.450 |
What we have been reading
How Fragile States Can Gain by Strengthening Institutions and Core Capacities
INTERNATIONAL MONETARY FUND
By: Paul M. Bisca, Alexei Milksjuk, Christian Mummssen, Gaëlle Pierre
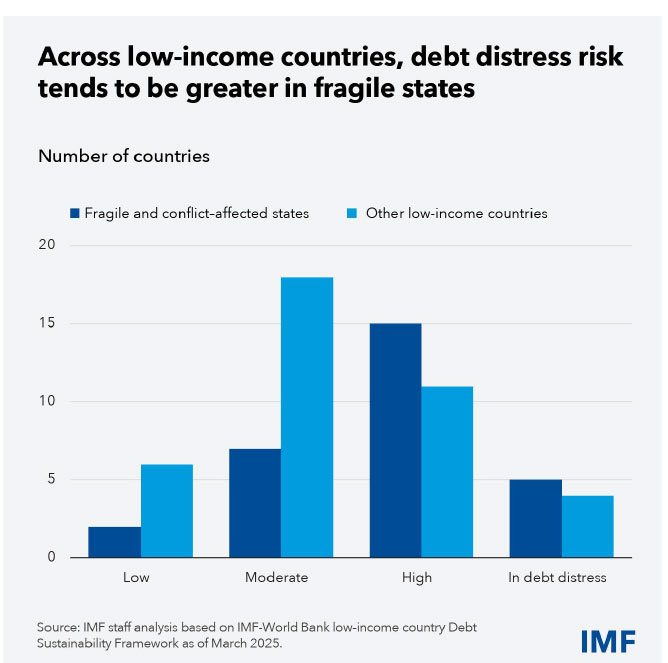
The costs of fragility are high, but judicious economic policies can help foster trust and support economic stability and growth. Some 1 billion people across 38 fragile and conflict-affected states experience lower economic growth and are more vulnerable to shocks than those in other countries. In most cases, fragility and conflict do not stop at the border, impacting neighboring regions and the world through cross-border insecurity, migration and refugee flows, and in some cases, trade disruptions. The situation has unfortunately worsened in recent years—and it may be further complicated by economic spillovers from the conflict in the Middle East.
While economic policies do not present easy solutions and cannot tackle all issues alone, they can significantly contribute to addressing fragility by promoting sustainable growth and job creation, prioritizing key spending while keeping debt on a sustainable path, and tackling inflation. Our new research shows how careful economic policy choices can make a difference. Fragility takes many forms. It often involves weak state capacity, governance challenges, social tensions, poverty and inequality, and high vulnerability to shocks such as food-price hikes. All this heightens uncertainty and makes it harder for governments to tackle multiple challenges with limited resources. And when left unaddressed, economic issues can trigger and perpetuate conflict.
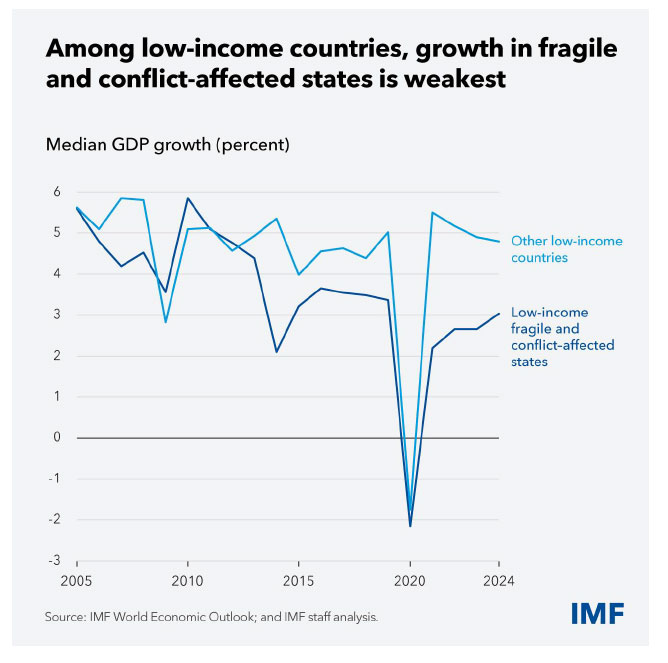
While these conditions are most prevalent in fragile states, some can also emerge in other low-income countries, emerging markets or even advanced economies, as our research shows. The economic costs of fragility are high. For the poorest fragile states, median economic growth lagged their more stable counterparts in 17 of the past 20 years, averaging 3.5 percent versus 4.6 percent, we found. Growth was even lower in countries where institutional fragility was coupled with conflict and abundant natural resources. Slower growth in the poorest fragile states reflects weaker productivity growth and more limited foreign and domestic investment, which is hindered by underdeveloped financial systems.
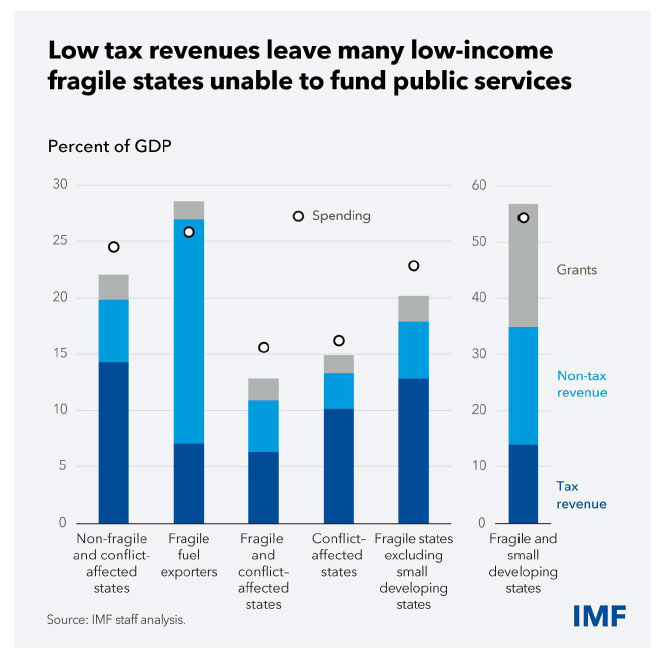
While the poorest fragile states experience the greatest need, they also tend to have the least available resources. This constrains both public spending and their ability to respond to crises. Even as such countries need to spend on public services, infrastructure, and social protection, their budgets are tight.
Their median ratio of tax revenue to economic output is about 10 percent. IMF research shows that, if low-income countries have such a ratio below 15 percent, they will find it extremely hard to foster growth, strengthen institutional capacity, and achieve development goals. Due to their large financing needs, these countries face high debt service costs and debt vulnerabilities.
Some three quarters of the poorest fragile states are at high risk of, or in, debt distress. Low fiscal and foreign exchange reserves make it hard to support economies in a downturn or when stabilization is needed. Indeed, many of these countries saw growth scarring—anemic growth following the recent global shocks—and some suffer from double-digit inflation.
Addressing fragility in any one country or region is critical to ensure broader peace and stability. One of the best ways to deliver progress is to prioritize sound policies that help to strengthen the core functions of government: stabilizing the economy, delivering public services, and supporting efficient markets (including financial sector development). This not only fosters economic performance—it also helps strengthen the social contract by delivering visible benefits and opportunities to people. A key challenge for national leaders is to build and sustain broad coalitions to support effective policies and implement the kinds of reforms needed to help improve economic outcomes. To be sure, pursuing reforms isn’t easy even in the most stable economies, but it can eventually lead to a virtuous circle. For example, even in fragile states’ difficult contexts, better tax administration can raise government revenues.
This may be used to improve public services and make fiscal institutions more effective and transparent. That in turn can strengthen legitimacy, enhance tax compliance, and raise more revenue. The scale of challenges for fragile states means that the international community has an important role to play in supporting their policies and reforms. This can best be done through tailored policy advice, capacity development, and financing.
This is especially true for countries where fragility is most intense and comes with a high risk of conflict. For countries facing a growing risk of fragility, early and targeted support can prevent challenges from spiraling into a worsening crisis. Ultimately, sound economic policies and reforms are crucial for the wellbeing of the people in fragile states. They entail, above all, strengthening institutions, building trust, and reducing vulnerability, so that countries can leave fragility behind.