20 Oct – 24 Oct, 2025
Welcome to this week’s JMP Report,
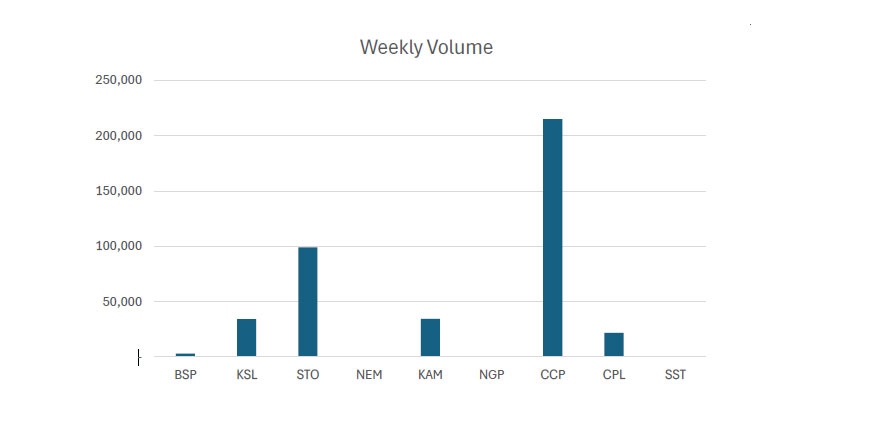
- Last week saw 7 stocks actively traded on PNGX with a total trading value of K3,447,038.72
- BSP traded only 2,989 shares closing 5t higher at K23.60.
- KSL traded 34,172 shares closing 5t lower at K3.80. Market for KSL remains trading at a range of K3.80-K3.85.
- STO managed to maintain there decent trading volumes. Trading 99,0332 shares steady at K20.00.
- KAM traded 34,428 shares closing 2t higher at K1.90.
- CCP traded the highest volumes of the week. Trading 215,100 shares steady at K4.65.
- CPL had the highest percentage change of the week at 33.33%, but only 21,661 shares changed hands at K0.60.
WEEKLY MARKET REPORT | 20 October, 2025 – 24 October, 2025
| STOCK | WEEKLY VOLUME |
CLOSING PRICE | VALUE | BID | OFFER | CHANGE | % CHANGE |
| BSP | 2,989 | 23.0 | 63,782 | – | 23.60 | 0.05 | 0.000 |
| KSL | 34,172 | 3.80 | 341,436 | 3.80 | 3.84 | (0.05) | (1.30%) |
| STO | 99,032 | 20.00 | 1,973,132 | – | – | – | – |
| NEM | – | 181.00 | – | – | – | – | – |
| KAM | 34,428 | 1.90 | 65,413 | 1.90 | – | 0.02 | 1.06% |
| NGP | – | 1.35 | 1,000,215 | 1.35 | – | – | – |
| CCP | 215,100 | 4.65 | 103,060 | – | 4.64 | – | – |
| CPL | 21,661 | 0.60 | – | 0.45 | 0.60 | 0.15 | 33.33% |
| SST | – | 50.00 | – | – | 50.00 | – | – |
| 407,382 | TOTAL | 3,447,039 | 0.06% |
Key takeaways:
- Market Announcement: KSL – TIP Group conference presentation Download >>
- Market Announcement: KAM – Substantial Shareholder Notice and Appendix 10B Download >>
- KAM – September 2025 App 10B Yates Download >>
- CGA – New Aircraft Arrival -P2-ATX Download >>
- Market Announcement: NEM – Third Quarter 2025 Earnings Results Release (Form 8-K) Download >>
- NEM – Quarterly Report – period ended 30 September 2025 (Form 10-Q) Download >>
- Check out our JMP-Kina Securities Limited (PNGX: KSL) Equity Research Report – A solid performer with some interesting risks and opportunities for investors to contemplate. Download >>
WEEKLY MARKET REPORT | 20 October, 2025 – 24 October, 2025
| STOCK | NUMBER ISSUED OF SHARES |
MARKET CAP |
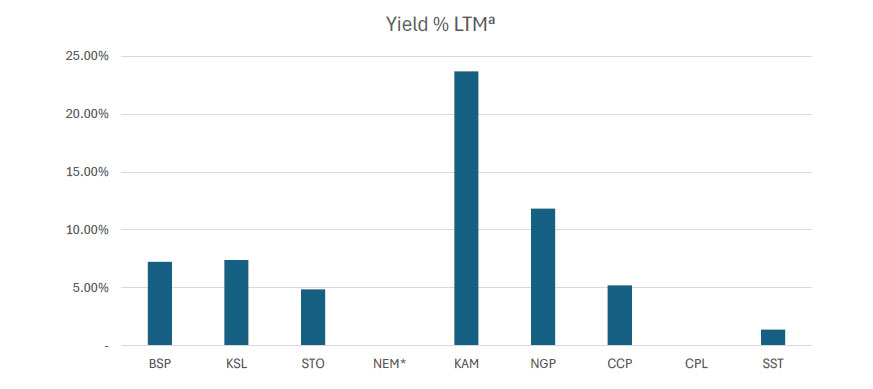
2023 INTERIM DIV | 2023 FINAL DIV | 2024 INTERIM DIV | 2024 FINAL DIV | 2025 INTERIM DIV | YIELD % LTM |
| BSP | 467,219,979 | 11,026,391,504 | K0.370 | K1.060 | K1.210 | K1.210 | K0.500 | 7.25% |
| KSL | 287,949,279 | 1,094,207,260 | K0.100 | K0.160 | K0.106 | K1.155 | K0.126 | 7.39% |
| STO | 3,247,772,961 | 64,955,459,220 | K0.310 | K0.660 | k0.506 | K0.414 | K0.559 | 4.87% |
| NEM* | – | – | – | – | – | – | – | – |
| KAM | 50,693,986 | 96,318,573 | K0.120 | – | – | – | K0.250 | 23.68% |
| NGP | 45,890,700 | 61,952,445 | K0.030 | – | K0.120 | K0.120 | K0.040 | 11.85% |
| CCP | 307,931,332 | 1,431,880,694 | K0.110 | K0.130 | K0.121 | K0.121 | K0.121 | 5.20% |
| CPL | 206,277,911 | 123,766,747 | K0.050 | – | – | – | – | – |
| SST | 31,008,237 | 1,550,411,850 | K0.350 | K0.600 | K0.300 | K0.300 | K0.400 | 1.40% |
| TOTAL | 80,340,388,293 | 5.19% |
a LTM = Last Twelve Months. We have calculated yields based on most recently declared
interim and final dividends.
* NEM pays quarterly dividends. We have added last 4 payments at current FX rates.
Dividend yield – is calculated by dividing a company’s annual dividends per share by its current share price and expressing the result as a percentage.


Domestic Markets Department – Money Markets Operations Unit
Auction Number: 22-oct-25 / GOI / Government Treasury Bill
Settlement Date: 24-Oct-25
Amount on Offer: K268.720 million
|
TERMS |
ISSUE ID |
ISSUE ID |
ISSUE ID |
ISSUE ID |
ISSUE ID |
TOTAL |
|
Weighted Average Yield |
0.000 |
0.00% |
7.49% |
7.51% |
7.58% |
|
|
Amount on offer Kina Million |
0.000 |
0.000 |
10.000 |
20.000 |
238.720 |
268.720 |
|
Bids Received Kina Million |
0.00 |
0.000 |
20.000 |
47.000 |
506.520 |
573.520 |
|
Successful Bids Kina Million |
0.00 |
0.000 |
10.000 |
20.000 |
238.720 |
268.720 |
|
Overall Auction OVER-SUBSCRIBED by |
0.00 |
0.000 |
10.000 |
27.000 |
267.800 |
304.800 |
What we have been reading
AUSTRALIAN EQUITY STRATEGY:DIVIDEND PLAYBOOK

By: Paul Basha, Strategist
- Dividend-paying stocks give investors a way to earn returns during rocky market periods
- When they grow over time, they may provide some protection against inflation.
- Income from dividends is tax-advantaged compared to income from fixed income investments
- On average, dividend-paying stocks are less volatile than non-dividend-paying stocks.
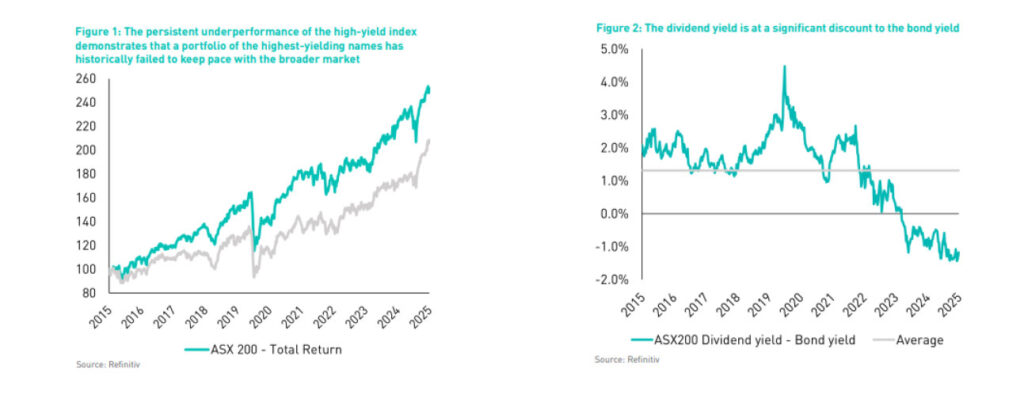
In an environment of slowing growth and valuation risk, the search for reliable returns is critical with dividends providing an anchor for total returns, especially when capital growth feels less certain. This focus on income is particularly relevant in Australia, which has historically been one of the highest dividend-paying markets in the world, where franking credits effectively eliminate the double taxation of profits for local investors, making dividends a highly tax-efficient form of return.
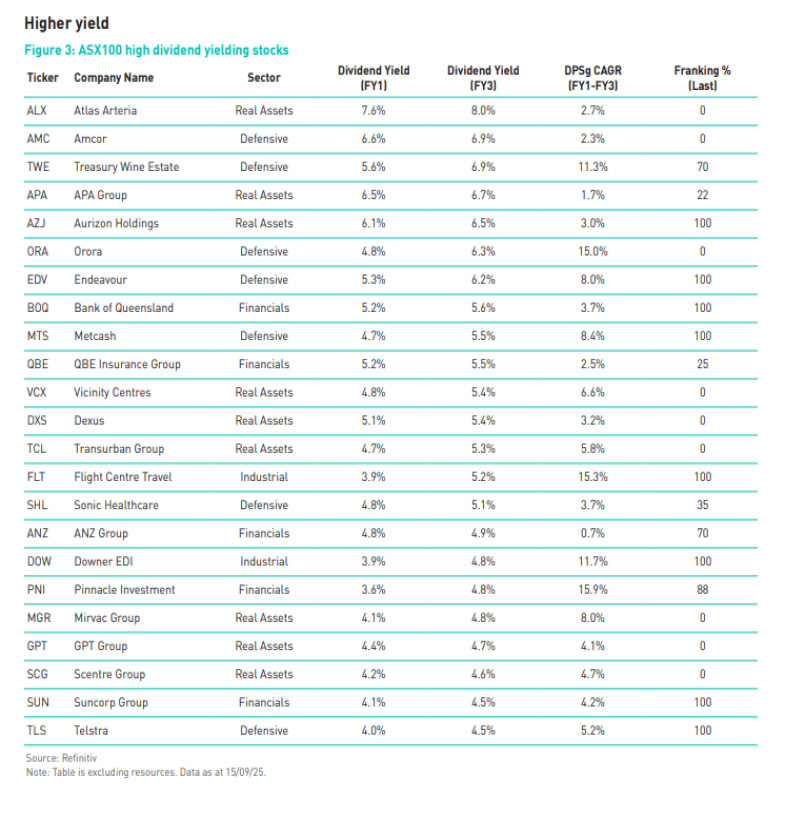
Screening the ASX for income.
It is important to look beyond just ‘spot’ yields when constructing income-oriented portfolios. This simplistic approach can lead to a selection of companies with weak or deteriorating outlooks, which – counterintuitively – can result in relatively weak dividend-based returns in the fullness of time. Therefore, we think it is also paramount to consider companies based on their competitive positioning and industry backdrop, their earnings quality, and their long-term growth outlook. Accordingly, below we have screened the ASX 100 based on:
- FY3 dividend yield >4.5%.
- 2-year forecast DPS CAGR (FY1/FY3) – ideally this should be positive, or at least flat. Long-term growth is the main driver of investment income over time (not the current dividend yield).
We add our own qualitative overlay to judge how reliable a dividend looks over the next 12–24 months. It blends a few common-sense checks, and we filter out companies who do not meet these criteria. Things we look for include: - Cash cover: free cash flow per share vs dividend per share.
- Payout discipline: dividends as a % of EPS.
- Balance-sheet cushion: net debt/EBITDA and interest cover (lower leverage, de-leveraging trend).
AMC, TWE, TCL, FLT and SHL are companies which we hold active positions in the core portfolio and screen as high yielding investments – supported by strong earnings growth and dividend growth.
Regards,
JMP Securities Team
JMP Securities
a. Level 3, ADF Haus, Musgrave St., Port Moresby NCD Papua New Guinea
p. PO Box 2064, Port Moresby NCD Papua New Guinea
Email: lars.mortensen@jmpmarkets.com
Ph: +675 7200 2233
Mobile: +675 7056 5124
Email: nathan.chang@jmpmarkets.com
Ph: +675 7167 3223
Mobile: +61 422 113 630