02 – 06 March 2026
Weekly Trade Commentary
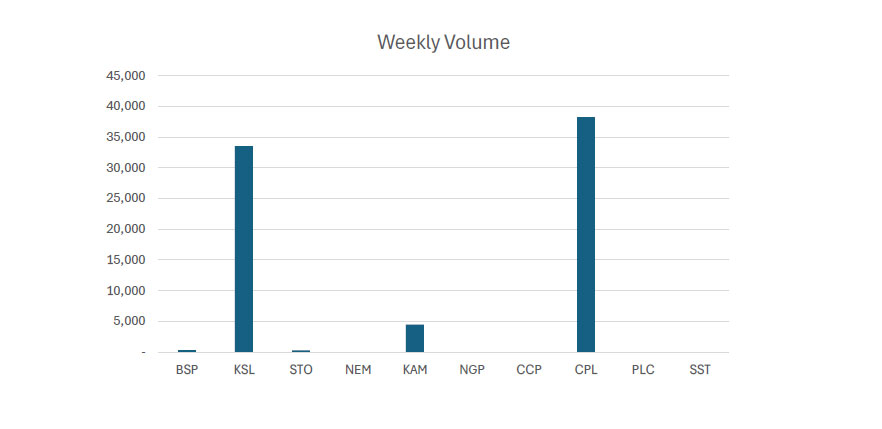
- Last week saw 5 stocks traded on the local market but with a total trading value of only K181,383.91.
- BSP traded only 309 shares higher by 1t at K25.37.
- KSL traded 33,521 shares higher by 1t also, closing at K3.95.
- STO traded only 300 shares but closed higher by K1.45 at K21.50.
- KAM traded 4,488 shares higher by 3t, closing at K1.99.
- Lastly, CPL traded 38,256 shares higher by 1t, closing at K0.65.
*PLC now has PDIs (PNGX Depositary Interests) on offer at K1.10. Yet to be traded on the market.
WEEKLY MARKET REPORT | 02 March, 2026 – 06 March, 2026
| STOCK | WEEKLY VOLUME | CLOSING PRICE | VALUE | BID | OFFER | CHANGE | % CHANGE |
|---|---|---|---|---|---|---|---|
| BSP | 309 | 25.37 | 7,839.33 | 25.37 | 26.90 | 0.01 | 0.04% |
| KSL | 33,521 | 3.96 | 133,319.30 | 3.95 | 3.96 | 0.01 | 0.25% |
| STO | 300 | 21.50 | 6,450.00 | 21.00 | – | 1.45 | 7.23% |
| NEM | – | 480.00 | – | 500.00 | – | – | – |
| KAM | 4,488 | 1.99 | 8,931.12 | 1.98 | 1.99 | 0.03 | 1.53% |
| NGP | – | 1.35 | – | – | – | – | – |
| CCP | – | 4.67 | – | 4.66 | 4.67 | – | – |
| CPL | 38,256 | 0.65 | 24,844.16 | – | 0.65 | 0.01 | 1.56% |
| PLC | – | – | – | – | 1.10 | – | – |
| SST | – | 50.00 | – | – | 50.00 | – | – |
| 76,874 | TOTAL | 181,383.91 | 5.91% |
Key takeaways:
- PLC – Notice of General Meeting and Proxy Form Download >>
- Market Announcement: BSP – 1H 2026 Key Dates Download >>
- Market Announcement: STO – Update to Dividend/ Distribution Download >>
- Market Announcement: SST – Notification of Dividend Distribution – Final Dividend 2025 Download >>
- Market Announcement: CGA – Substantial Shareholding Notice Download >>
- Market Announcement: CGA – Top 20 Shareholders Download >>
WEEKLY YIELD CHART | 02 March, 2026 – 06 March, 2026
| Stock | Number Issued of Shares | Market Cap | 2023 Interim Div |
2023 Final Div |
2024 Interim Div |
2024 Final Div |
2025 Interim Div |
2026 Final Div |
Yield % LTM |
|---|---|---|---|---|---|---|---|---|---|
| BSP | 467,317,665 | 11,855,849,161 | K0.370 | K1.060 | K1.210 | K1.210 | K0.500 | K1.380 | 7.41% |
| KSL | 292,965,754 | 1,160,144,386 | K0.100 | K0.160 | K0.106 | K1.155 | K0.126 | K0.193 | 8.06% |
| STO | 3,261,616,703 | 70,124,759,115 | K0.310 | K0.660 | K0.506 | K0.414 | K0.559 | K0.443 | 4.66% |
| NEM* | 1,097,000,000 | 526,560,000,000 | – | – | – | K2.110 | K2.110 | (USD) $0.260 | 0.88% |
| KAM | 53,259,588 | 105,986,580 | K0.120 | – | – | – | K0.250 | – | 12.56% |
| NGP | 45,890,700 | 61,952,445 | K0.030 | – | K0.120 | K0.120 | K0.040 | – | 11.85% |
| CCP | 307,931,332 | 1,438,039,320 | K0.110 | K0.130 | K0.121 | K0.121 | K0.121 | – | 5.18% |
| CPL | 206,277,911 | 134,080,642 | K0.050 | – | – | – | K0.050 | – | 7.69% |
| PLC | 847,612,686 | – | – | – | – | – | – | – | – |
| SST | 31,008,237 | 1,550,411,850 | K0.350 | K0.600 | K0.300 | K0.300 | K0.400 | – | 1.40% |
| TOTAL | 612,991,223,499 | 5.83% |
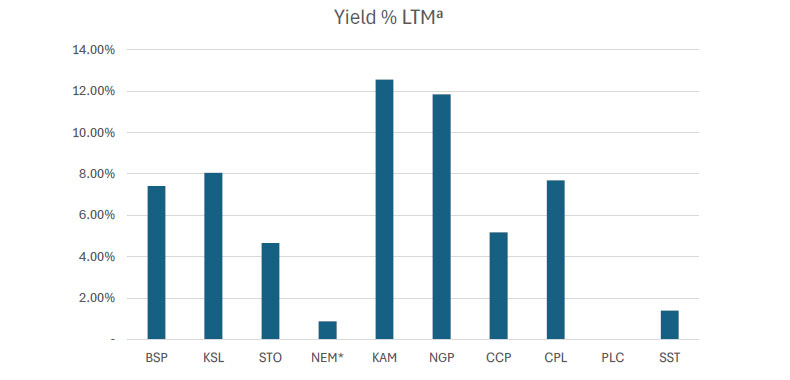
LTM = Last Twelve Months. We have calculated yields based on most recently declared
interim and final dividends.
* NEM pays quarterly dividends. We have added last 4 payments at current FX rates.
Dividend yield – is calculated by dividing a company’s annual dividends per share by its current share price and expressing the result as a percentage.


Domestic Markets Department – Money Markets Operations Unit
Auction Number: 04 MAR-26 / GOI / Government Treasury Bill
Settlement Date: 6-MAR-26
Amount on Offer: K350.000 million
| TERMS | ISSUE ID 2025 / 63 |
ISSUE ID 2025 / 91 |
ISSUE ID 2025 / 4741 182 |
ISSUE ID 2025 / 4700 273 |
ISSUE ID 2025 / 4743 364 |
TOTAL |
|---|---|---|---|---|---|---|
| Weighted Average Yield | 0.000 | 0.00% | 5.42% | 5.40% | 5.61% | |
| Amount on Offer Kina Million | 0.000 | 0.000 | 30.000 | 70.000 | 250.000 | 350.000 |
| Bids Received Kina Million | 0.000 | 0.000 | 77.000 | 96.830 | 536.720 | 710.550 |
| Successful Bids Kina Million | 0.000 | 0.000 | 47.000 | 26.830 | 254.720 | 328.550 |
| Overall Auction OVER-SUBSCRIBED by | 0.000 | 0.000 | 47.000 | 26.830 | 286.720 | 360.550 |
Domestic Markets Department – Money Markets Operations Unit
Auction Number: 17-FEB-26 / GOB / Government Bond
Settlement Date: 20-FEB-26
Amount on Offer: K380.000 million
| SERIES | Amount on Offer (K’million) | Bids Received (K’million) | Successful Bids (K’million) | Successful Bids Yield | Weighted Average Rate (WAR) | Coupon Rate | Overall Auction Net Subscription |
|---|---|---|---|---|---|---|---|
| Issue ID 2026/5057 (3 years) | 60.000 | 118.000 | 58.000 | 6.30%-6.38% | 6.37% | 5.75% | K58.000 |
| Issue ID 2026/5058 (5 years) | 90.000 | 210.000 | 110.000 | 6.50%-6.83% | 6.72% | 6.00% | K120.000 |
| Issue ID 2026/5059 (7 years) | 70.000 | 148.000 | 78.000 | 6.70%-6.80% | 6.76% | 6.25% | K78.00 |
| Issue ID 2026/5060 (10 years) | 100.000 | 195.80 | 95.80 | 6.00%-7.06% | 7.05% | 6.50% | K95.80 |
| Issue ID 2026/5061 (15 years) | 60.000 | 122.000 | 52.00 | 7.46%-7.46% | 7.46% | 6.75% | K62.00 |
| TOTAL | 380.000 | 793.800 | 393.000 | K413.800 |
What we have been reading
Conflicts and markets

MONTHLY BELL MARCH 2026
Rob Crookston, Strategist
BELL POTTER
The recent escalation in the Middle East has generated sharp, broad-based market volatility. The moves have been swift and visible. However, based on a long historical record, they are also most likely temporary.
What markets have done
The initial moves across asset classes have been consistent with prior episodes of geopolitical stress:
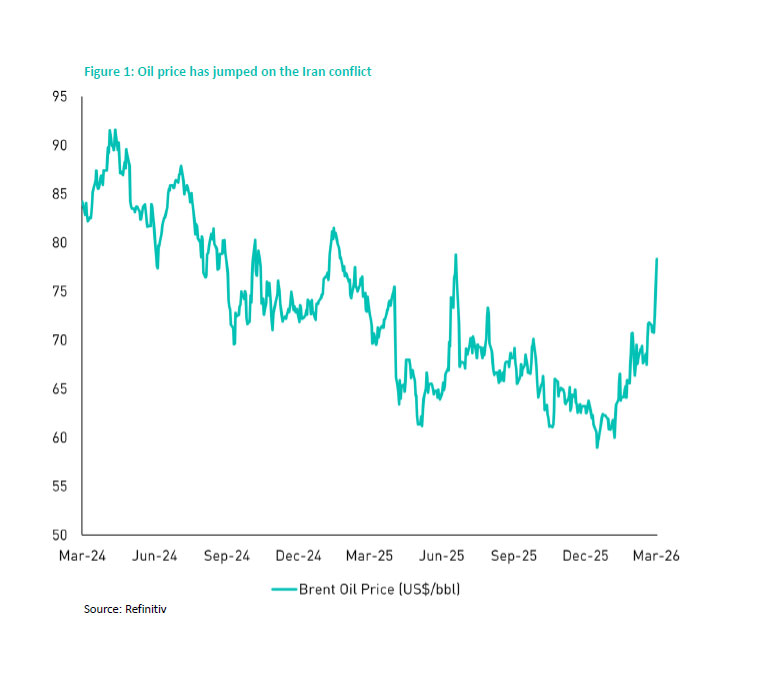
Crude oil and gas prices surged as markets moved to price in potential supply disruption from a key producing region. European gas prices rose sharply, reflecting the continent’s particular sensitivity to energy supply security. Global equities fell, with the steepest declines in sectors most exposed to energy costs and travel demand, including airlines and logistics.
Gold advanced, as investors sought assets that hold value when uncertainty rises sharply.
Shipping through the Strait of Hormuz, through which ~20% of global oil and gas flows, has slowed materially following the strikes.
Concerns have also emerged around potential damage to regional energy infrastructure, which could tighten energy markets further if sustained.
These moves reflect a rational response to a sudden increase in uncertainty. The more useful question is not what has happened, but what history tells us about what
tends to follow.
What history tells us
The historical record on geopolitical shocks and financial markets is consistent. Conflicts produce fear, volatility, and near-term dislocations. They rarely produce the kind of sustained, structural damage that permanently impairs long-term investment outcomes.
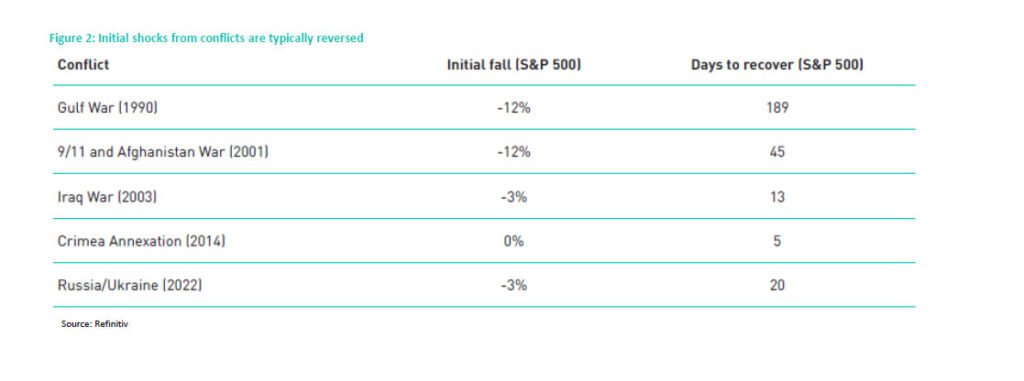
Downturns caused by geopolitical events tend to be shorter and shallower than those driven by economic or financial imbalances. Markets frequently recover reasonably fast.
This pattern has held across Iraq’s invasion of Kuwait in 1990, the September 11 attacks, the invasion of Iraq, Crimea annexation and Russia’s invasion of Ukraine in 2022. Each produced an initial risk-off phase marked by equity weakness and safe-haven demand. In each case where the conflict remained contained and did not coincide with a broader financial crisis, equity markets recovered.
The investment implication is equally well-evidenced. Holding positions through periods of geopolitical uncertainty has, in virtually every historical episode, produced better outcomes than attempting to time the market. Being out of the market when the recovery begins typically costs more than sitting through the initial decline.
Risks worth monitoring
This is not to minimize the genuine risks present in the current situation. As the transit route for 20% of global oil, the Strait of Hormuz serves as a major point of geopolitical vulnerability.
A sustained disruption to transit through this chokepoint would represent a significant global energy supply shock, with consequences for inflation, growth, and central bank policy that would extend well beyond the region. Elevated oil prices, even without that scenario, add to near-term inflation, reduce room for central banks to ease, and weigh on global growth.
The conditions that would require a more cautious reassessment are:
The conflict broadens to involve additional state actors, extending the geographic scope of risk.
Damage to regional energy infrastructure proves sustained rather than short-lived.
Oil prices move to levels historically associated with demand destruction and recession (not ~US$80/bbl).
OPEC is unable or unwilling to deploy spare capacity to offset supply disruptions.
These are tail risks rather than base cases. However, they carry real consequences for inflation and growth and warrant monitoring. Our constructive view on markets does not change in anticipation of them. It changes if and when they materialize.
The bottom line
The current environment warrants attention but not alarm. However, the risks are real and worth monitoring. The historical precedent across a wide range of geopolitical episodes is clear: well-diversified portfolios, held with discipline through periods of uncertainty, consistently produce better outcomes than those managed reactively. There is no strong case for hasty repositioning. The most constructive stance is informed patience, aware of the risks, anchored to a sound long-term strategy, and grounded in historical evidence.
Regards,
JMP Securities Team
a. Level 3, ADF Haus, Musgrave St., Port Moresby NCD Papua New Guinea
p. PO Box 2064, Port Moresby NCD Papua New Guinea
Managing Director
Email: lars.mortensen@jmpmarkets.com
Ph: +675 7200 2233
Mobile: +675 7056 5124
Head of Equity Capital Markets
Email: nathan.chang@jmpmarkets.com
Ph: +675 7167 3223
Mobile: +61 422 113 630