20 – 24 April 2026
Weekly Trade Commentary
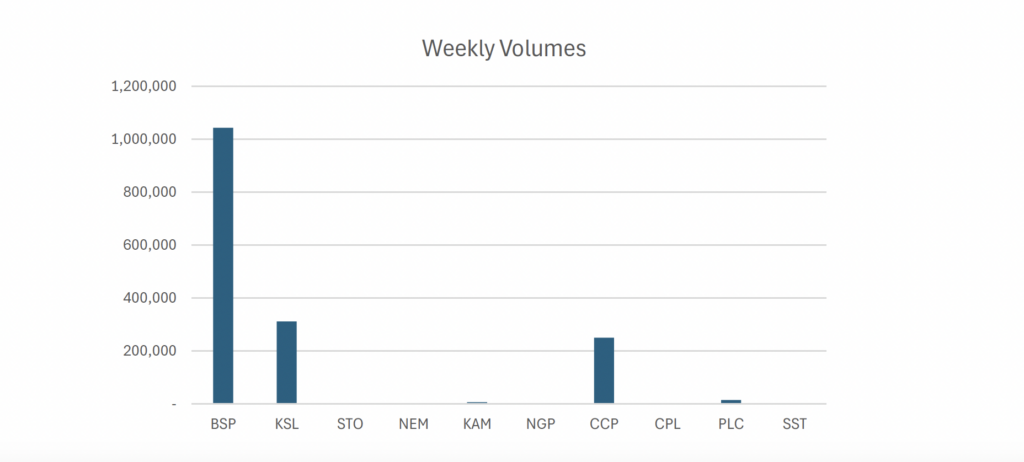
- Last week saw 6 stocks traded on the local market with a total trading value of K30,556,811.96.
- BSP recorded large volumes, totaling over 64% of PNGX volumes this week. 1,042,654 BSP shares changed hands but closed 60t lower at K26.90.
- KSL traded 311,232 shares at K4.10, closing high by 10t.
- STO traded only 753 shares steady at K22.00.
- KAM traded 6,000 shares high by 5t closing at K2.05.
- CCP traded 250,000 shares steady at K4.66.
- Lastly, PLC closed 5t lower trading 13,897 shares at K1.05.
WEEKLY MARKET REPORT | 20 April, 2026 – 24 April, 2026
| STOCK | WEEKLY VOLUME | CLOSING PRICE | VALUE | BID | OFFER | CHANGE | % CHANGE |
|---|---|---|---|---|---|---|---|
| BSP | 1,042,654 | 26.90 | 28,076,907.60 | – | 27.50 | (0.60) | (2.18%) |
| KSL | 311,232 | 4.10 | 1,271,389.60 | 4.05 | 4.80 | 0.10 | 2.50% |
| STO | 753 | 22.00 | 16,566.00 | 22.00 | – | – | – |
| NEM | – | 490.00 | – | – | 530.00 | – | – |
| KAM | 6,000 | 2.05 | 12,300.00 | 2.05 | – | 0.05 | 2.50% |
| NGP | – | 1.35 | – | 1.35 | – | – | – |
| CCP | 250,000 | 4.66 | 1,165,000.00 | – | – | – | – |
| CPL | – | 0.79 | – | – | 0.79 | – | – |
| PLC | 13,897 | 1.05 | 14,648.76 | 1.05 | 1.08 | (0.05) | (4.76%) |
| SST | – | 50.00 | – | – | – | – | – |
| 1,624,536 | TOTAL | 30,556,811.96 | (0.27%) |
Key takeaways:
- Market Announcement: CPL – FY25 Annual Report, AGM Notice and Proxy Form Download >> Download >> Download >> Download >>
- Market Announcement: PLC – Investor Presentation Download >>
- Market Announcement: KAM Notice of Annual General Meeting and Annual Report Download >> Download >>
- Market Announcement: BSP_NoM_Proxy and Q&A Forms Download >>
- Market Announcement: STO – 2026 Santos First Quarter Report Download >>
- NEM – Quarterly Report period ended 31 March 2026 (Form 10-Q) Download >>
- NEM – Notification of dividend / distribution Download >>
- NEM – First Quarter 2026 Earnings Results Release (Form 8-K) Download >>
- Market Announcement: PLC – Strategic MOU signed for dedicated power infrastructure Download >>
- Market Announcement: NGP – 2025 Final Dividend Announcement Download >>
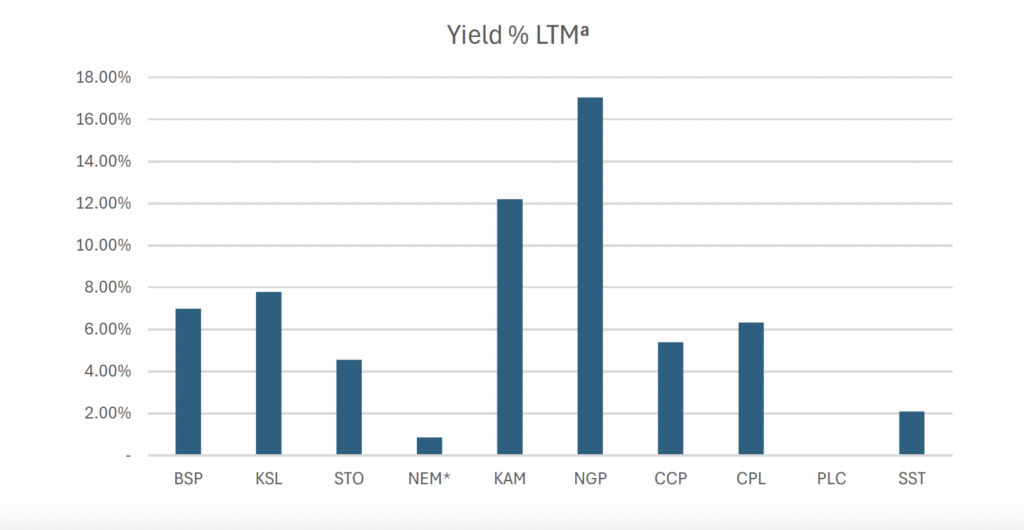
WEEKLY YIELD CHART | 20 April, 2026 – 24 April, 2026
| Stock | Number Issued of Shares | Market Cap | 2023 Interim Div | 2023 Final Div | 2024 Interim Div | 2024 Final Div | 2025 Interim Div | 2025 Final Div | Yield % LTM |
|---|---|---|---|---|---|---|---|---|---|
| BSP | 467,317,665 | 12,570,845,189 | K0.370 | K1.060 | K0.450 | K1.210 | K0.500 | K1.380 | 6.99% |
| KSL | 294,332,296 | 1,206,762,414 | K0.100 | K0.160 | K0.106 | K0.155 | K0.126 | K0.193 | 7.78% |
| STO | 3,261,616,703 | 71,755,567,466 | K0.310 | K0.660 | K0.506 | K0.414 | K0.559 | K0.443 | 4.55% |
| NEM* | 1,097,000,000 | 537,530,000,000 | – | – | – | K2.110 | K2.110 | USD $0.260 | 0.86% |
| KAM | 53,259,588 | 109,182,155 | K0.120 | – | K0.200 | – | K0.250 | – | 12.70% |
| NGP | 45,890,700 | 61,952,445 | K0.030 | – | K0.040 | K0.120 | K0.190 | – | 17.04% |
| CCP | 307,931,332 | 1,434,960,007 | K0.110 | K0.130 | K0.120 | K0.121 | K0.121 | K0.130 | 5.39% |
| CPL | 206,277,911 | 162,959,550 | K0.050 | – | – | – | K0.050 | – | 6.33% |
| PLC | 858,075,186 | 900,978,945 | – | – | – | – | – | – | – |
| SST | 31,008,237 | 1,550,411,850 | K0.350 | K0.600 | K0.400 | K0.300 | K0.400 | K0.650 | 2.10% |
| TOTAL | 627,283,620,021 | 5.69% |
a LTM = Last Twelve Months. We have calculated yields based on most recently declared
interim and final dividends.
* NEM pays quarterly dividends. We have added last 4 payments at current FX rates.
* NEM dividends in $USD until PGK rate is announced.
*PLC now added
Dividend yield – is calculated by dividing a company’s annual dividends per share by its current share price and expressing the result as a percentage.

Domestic Markets Department – Money Markets Operations Unit
Auction Number: 21-APR-26 / GOI / Government Treasury Bill
Settlement Date: 24-APR-26
Amount on Offer: K210.000 million
| TERMS | ISSUE ID 2025 / 63 | ISSUE ID 2025 / 91 | ISSUE ID 2025 / 4741 182 | ISSUE ID 2025 / 4700 273 | ISSUE ID 2025 / 4743 364 | TOTAL |
|---|---|---|---|---|---|---|
| Weighted Average Yield | 0.000 | 0.00% | 5.36% | 5.50% | 5.47% | |
| Amount on Offer Kina Million | 0.000 | 0.000 | 10.000 | 50.000 | 150.000 | 210.000 |
| Bids Received Kina Million | 0.000 | 0.000 | 34.500 | 102.500 | 445.390 | 582.390 |
| Successful Bids Kina Million | 0.000 | 0.000 | 34.500 | 102.500 | 75.000 | 212.000 |
| Overall Auction OVER-SUBSCRIBED by | 0.000 | 0.000 | 24.500 | 52.500 | 295.390 | 372.390 |
Domestic Markets Department – Money Markets Operations Unit
Auction Number: 21-MAR-26 / GOB / Government Bond
Settlement Date: 24-MAR-26
Amount on Offer: K200.000 million
| SERIES | Amount on Offer (K’million) | Bids Received (K’million) | Successful Bids (K’million) | Successful Bids Yield | Weighted Average Rate (WAR) | Coupon Rate | Overall Auction Net Subscription |
|---|---|---|---|---|---|---|---|
| Issue ID 2026/5057 (3 years) | 30.000 | 60.000 | 60.000 | 6.45%-6.50% | 6.48% | 5.75% | K30.000 |
| Issue ID 2026/5058 (5 years) | 40.000 | 42.000 | 42.000 | 6.73%-6.80% | 6.76% | 6.00% | K2.000 |
| Issue ID 2026/5059 (7 years) | 50.000 | 52.000 | 52.000 | 6.89%-6.93% | 6.91% | 6.25% | K2.000 |
| Issue ID 2026/5060 (10 years) | 50.000 | 82.000 | 67.000 | 7.07%-7.20% | 7.11% | 6.50% | K32.000 |
| Issue ID 2026/5061 (15 years) | 30.000 | 32.000 | 32.000 | 7.45%-7.47% | 7.46% | 6.75% | K2.000 |
| TOTAL | 200.000 | 268.000 | 253.000 | K68.000 |
INVESTOR EDUCATION
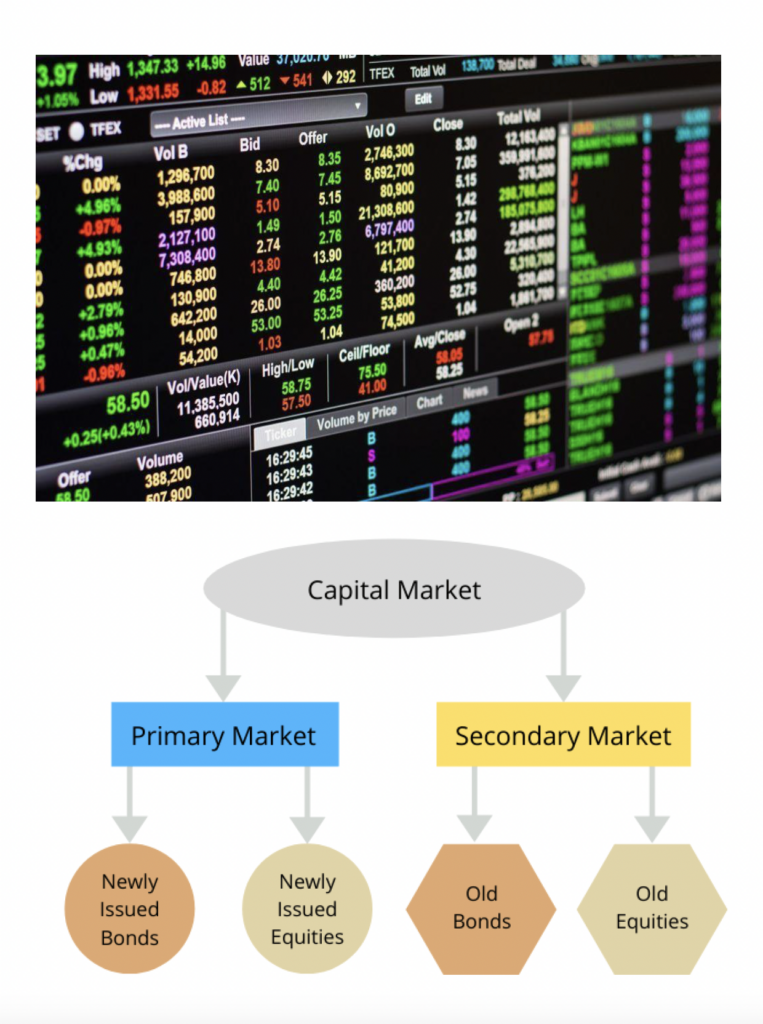
What is Capital Markets?
- Capital markets are the exchange system platform that transfers capital from investors who want to employ their excess capital to businesses that require the capital to finance various projects or investments. Capital markets primarily feature two types of securities: equity securities and debt securities. Both are forms of investments that provide investors with different returns and risks and provide users with capital with different obligations.
Types of Capital Markets
- Equity Securities
Equity securities are traded on the stock market and are essentially ownership shares of a business or venture. When you own equity securities of a company, you essentially own a portion of that company and are entitled to any future earnings that the company brings in.
However, the money that you invest in equity securities is not required to be paid back to you by the business. - Debt Securities
Debt securities are traded on the bond market and are IOUs that can come in the form of bonds or notes. They essentially represent the borrowing of money that will be paid back at a later date with interest.
Interest is the required compensation that entices lenders to lend their money. The borrowers will take the money today, use it to finance their operations, and pay back the money in addition to a prescribed rate of interest at a later date.
The securities can be bought and sold on two types of markets:
- The primary market is when a company directly issues the securities in exchange for capital.
- The secondary market is when the security holders trade with other investors in a transaction that is separate from the issuing company.
Other Financial Markets
Capital markets specifically relate to equity and debt securities… (full text continues with Foreign exchange, Commodities, Derivatives, Functions of a Capital Market: Allocation of Capital, Risk Management, Price Discovery, Facilitation of Economic Growth, Liquidity Provision, Capital Market Transactions…)
• Foreign exchange (forex)
• Commodities
• Derivatives
Functions of a Capital Market
Capital markets serve various essential functions within the financial ecosystem.
Allocation of Capital
One of the primary functions of capital markets is the efficient allocation of capital. Investors channel their savings into productive investments, enabling businesses to finance new projects, research initiatives, and operational expansions. This allocation process fosters economic development by directing resources toward ventures with the highest potential returns.
Risk Management
Capital markets offer diverse financial instruments, such as derivatives, which facilitate risk management for investors and businesses. Through options, futures, and swaps, market participants can hedge against adverse price movements, mitigate volatility, and safeguard their investments. By managing risks effectively, capital markets enhance market stability and investor confidence.
Price Discovery
Capital markets serve as platforms for price discovery, where the forces of supply and demand interact to determine asset prices. Through continuous trading and information dissemination, markets reflect investors’ collective expectations, assessments of intrinsic value, and macroeconomic factors. Accurate price discovery ensures that assets are fairly valued, fostering efficient resource allocation.
What we have been reading
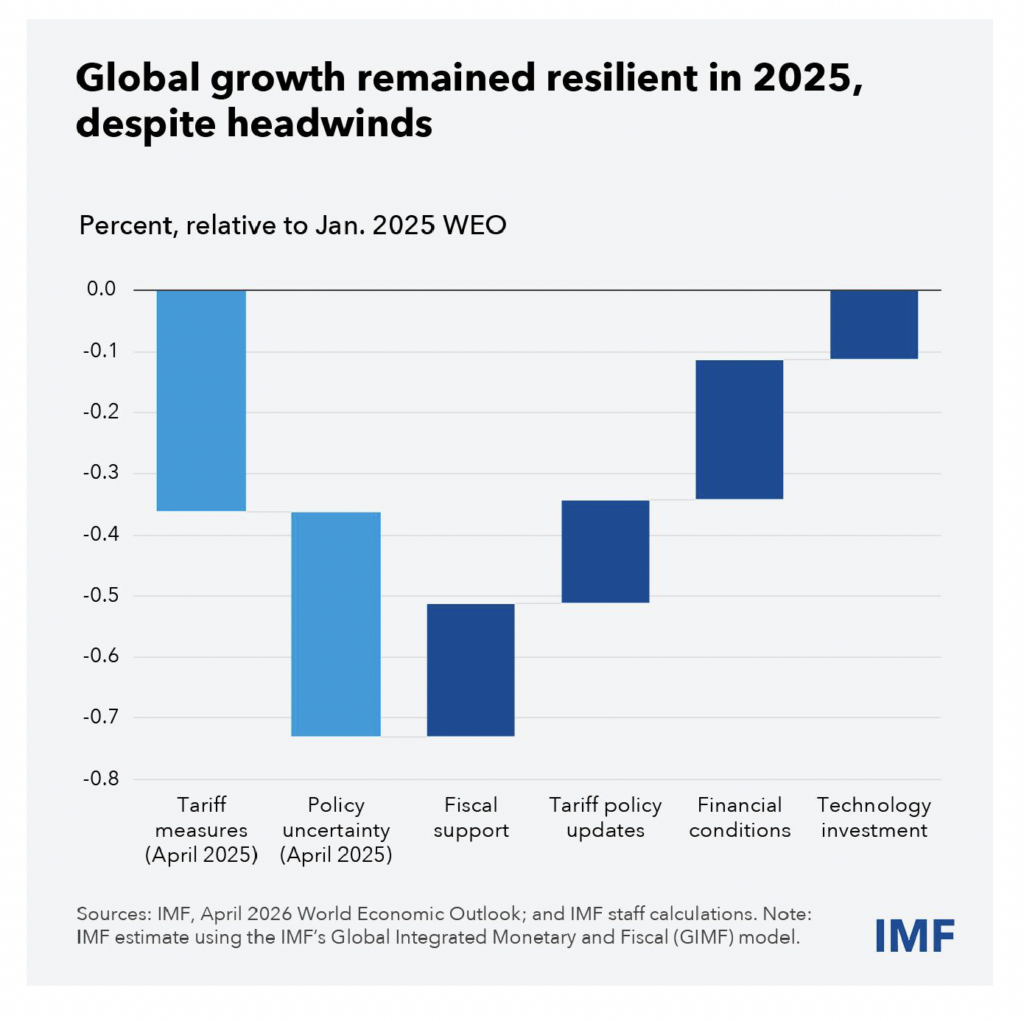
War Darkens Global Economic Outlook and Reshapes Policy Priorities
IMF — Pierre-Olivier Gourinchas

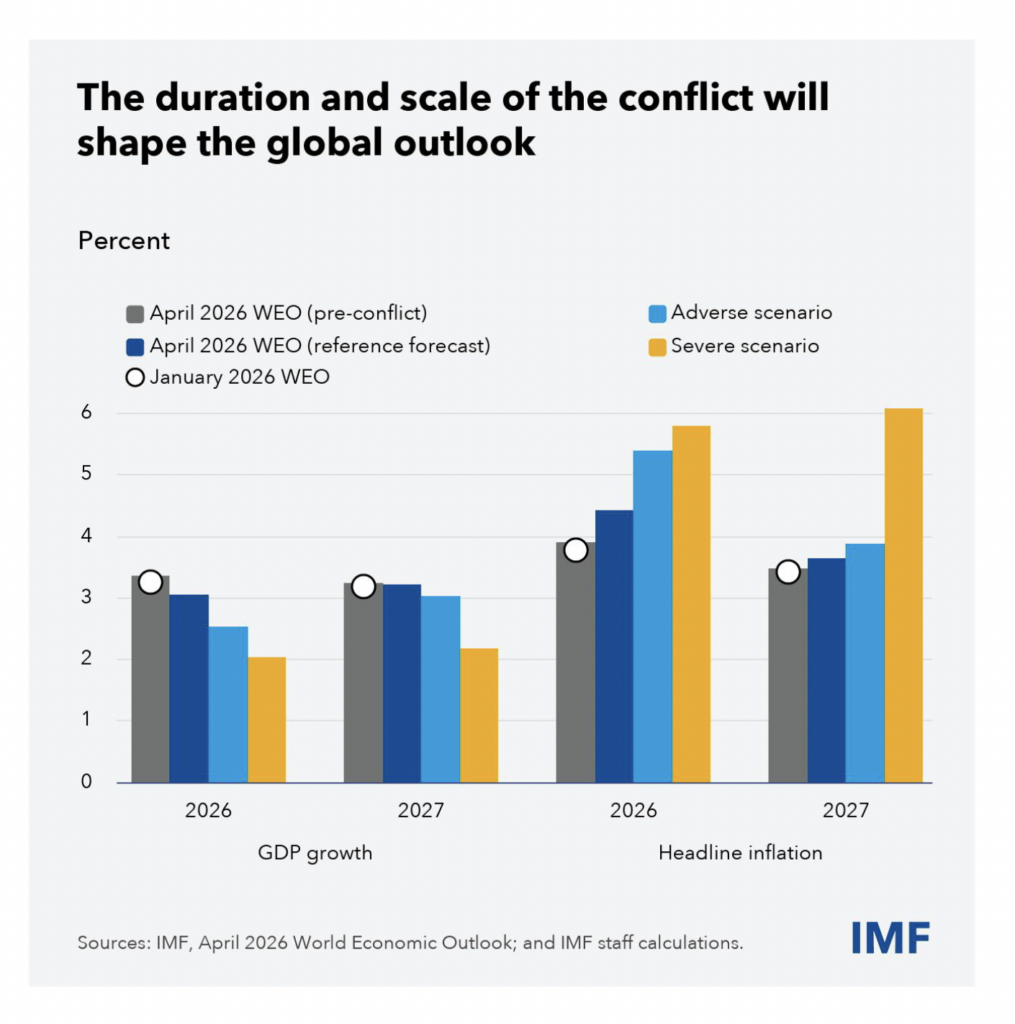
Despite major trade disruptions and policy uncertainty, last year ended on an upbeat note. The private sector adapted to a changing business environment, while powerful offsets came from lower US tariffs than originally announced, some fiscal support, and favorable financial conditions coupled with strong productivity gains and a tech boom. Despite some downside risks, the momentum was expected to carry over into 2026, lifting the pre-conflict global growth forecast to 3.4 percent.
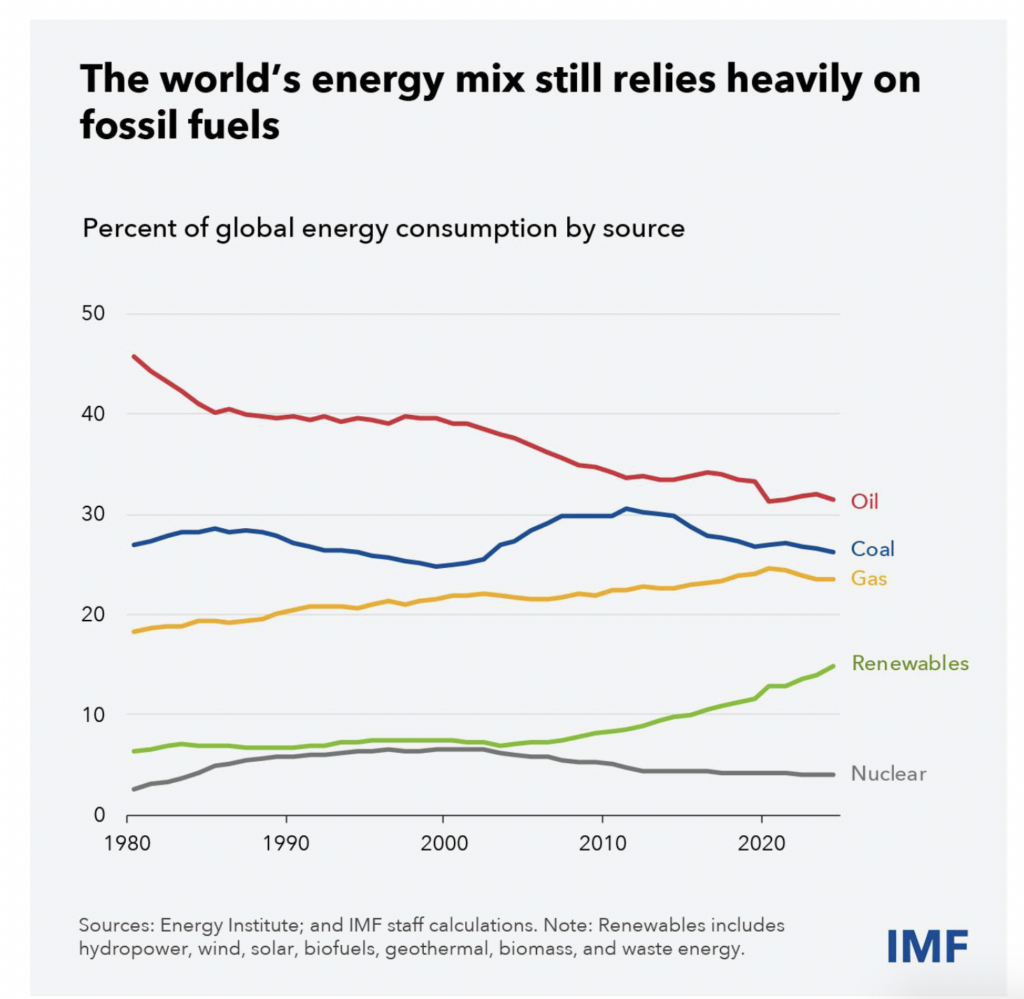
War in the Middle East has halted this momentum. The closing of the Strait of Hormuz and serious damage to critical facilities in a region central to global hydrocarbon supply raise the prospect of a major energy crisis should hostilities continue.
War’s economic impact
The shock’s ultimate magnitude will depend on the conflict’s duration and scale—and how quickly energy production and shipment normalize once hostilities end. This impact will depend on three channels.
First, higher commodity prices are a textbook negative supply shock, raising costs for energy-intensive goods and services, disrupting supply chains, lifting headline inflation, and eroding purchasing power.
Second, these effects could be amplified as firms and workers try to recoup losses, risking wage-price spirals, especially where inflation expectations are poorly anchored.
Third, heightened macro risks and the prospect of tighter monetary policy could trigger a sudden repricing by financial markets—with much lower asset valuations, higher risk premia, more capital flight, and dollar appreciation—tightening financial conditions and dampening aggregate demand.
Our reference forecast, which assumes a short-lived conflict and a moderate 19 percent increase in energy commodities prices in 2026, still puts global growth at only 3.1 percent this year and headline inflation at 4.4 percent, a sharp deviation from the global disinflation trend in recent years.
A longer shutdown of the Strait of Hormuz and further damage to drilling and refining facilities would disrupt the global economy more deeply and for longer. In an adverse scenario, assuming a sharper increase in energy prices this year coupled with rising inflation expectations and some tightening of financial conditions, growth falls to 2.5 percent this year and inflation rises to 5.4 percent.
In a severe scenario where energy supply dislocations extend into next year, inflation expectations become markedly less anchored, and financial conditions tighten sharply, global growth would decline to 2 percent this year and next, while inflation would exceed 6 percent. Despite the recent news of a temporary ceasefire, some damage is already done, and the downside risks remain elevated.
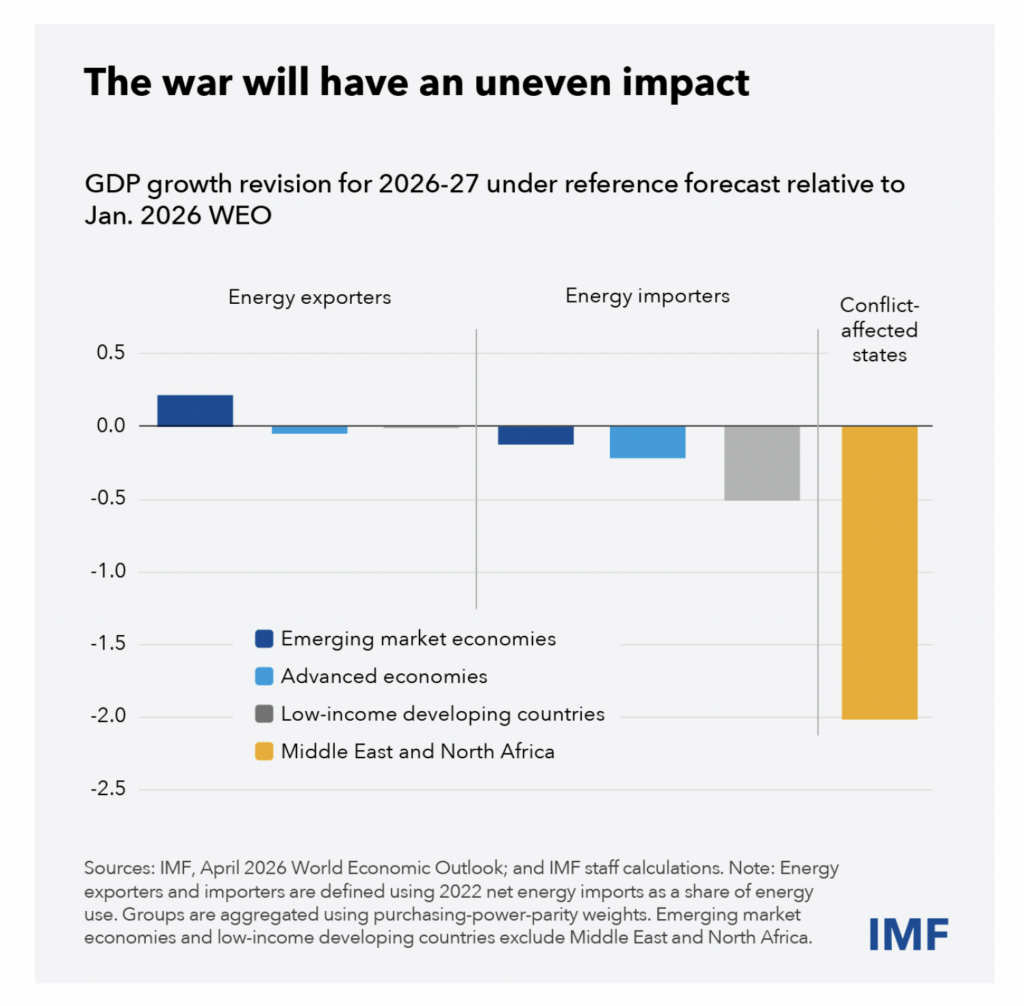
Countries will feel the impact differently. As in past commodity-price surges, importers are highly exposed. Low-income and developing economies—especially those with vulnerabilities and limited buffers—are likely to be hit hardest. Gulf energy exporters will face economic fallout from damaged infrastructure, production disruptions, export constraints, and weaker tourism and business activity. Remittances will fall in countries that supply migrant workers to the region.
Lessons from 2022 crisis
Today’s shock echoes the 2022 commodity price surge following Russia’s invasion of Ukraine, which helped push global inflation to the highest since the 1970s. In that episode, the subsequent synchronized tightening and disinflation without a recession is widely seen as a major policy success.
Can we expect the same outcome now? There are reasons to doubt it. In 2022, inflation pressures were already elevated coming from post-pandemic supply-demand imbalances, tight labor markets, and abundant liquidity. Today, softer labor markets and normalized balance sheets have eased underlying pressures, though inflation remains above target in some countries, notably the United States. If the shock remains modest, inflation may be more contained, consistent with our reference scenario.
Still, the last episode left scars. Permanently higher price levels have raised cost-of-living concerns and made inflation expectations more sensitive to new price increases. Moreover, the 2022 surge reflected an unusually steep aggregate supply curve, with strong demand running into supply bottlenecks, allowing central banks to achieve disinflation with limited output losses. Evidence now suggests a return to a flatter supply curve, making disinflation more costly.
Policies
How should central banks react? Obviously, the best way to limit economic damage is an early and orderly end to the war. Beyond that, central banks can generally look through an energy-price surge but only as long as inflation expectations remain well-anchored. The energy shock already weakens activity while raising prices, and no central bank can influence global energy prices on its own. But if medium- or long-term inflation expectations drift up as prices and wages pick up, restoring price stability must take precedence over near-term growth, with a swift tightening. While exchange rate flexibility allows monetary policy to focus on price stability, foreign exchange interventions or capital flow management measures may be considered in some cases, in line with our Integrated Policy Framework.
What should fiscal policy do? Untargeted measures—price caps, subsidies, and similar interventions—are popular. But they are frequently poorly designed and costly. Given the lack of fiscal space with still elevated budget deficits and rising public debt, any fiscal support should remain narrowly targeted and temporary—with clear sunset clauses, and consistent with medium-term fiscal plans to rebuild buffers. Avoiding fiscal stimulus is also critical when inflation is rising, so as not to complicate central banks’ task.
Preserving price signals is important: high prices signal scarcity, encouraging demand restraint and supply expansion. Price controls and export restrictions cannot change that fact. Worse, such measures often backfire by raising underlying prices, leading to rationing and shifting adverse spillovers to other countries. If needed, direct, targeted transfers to vulnerable households and firms typically provide greater relief at lower fiscal cost than broad subsidies. Too often, this lesson was missed in 2022; countries should do better this time.
Finally, if financial conditions tighten sharply and global activity deteriorates markedly, monetary and fiscal policy should stand ready to pivot to support the economy and safeguard the financial system, alongside appropriate financial and liquidity policies.
Resilience amid challenges
The latest war underscores that the international order is under growing strain, with fraying alliances, new conflicts, and national-security concerns shaping economic policy. Our analytical chapters examine the macroeconomic effects of defense buildups and draw lessons for economies in conflict or reconstruction. The conclusion is sobering beyond its human toll, war imposes large, persistent economic costs and difficult trade-offs.
Beyond active conflicts, geopolitical tensions are reshaping an increasingly multipolar world with waves of trade restrictions imposed by all major economic blocs, harming international cooperation and growth. While these shifts may reinforce inward-looking policies, we also see trade being rerouted through new partners and regional agreements that do not necessarily align with old geopolitical boundaries.
The conflict in the Middle East commands immediate attention, but it should not distract from the pursuit of durable growth. Advances in artificial intelligence—especially agentic AI—offer the potential for large productivity gains, the ultimate driver of living standards. Yet the transition may be bumpy: markets may be ahead of fundamentals, risking corrections, and rapid change could displace workers and weigh on demand. Policymakers should promote diffusion and adoption while investing in skills to ease the labor-market transition. The war should also spur faster adoption of renewable energy, which can strengthen resilience to energy shocks, improve energy security, and support the climate transition.
Regards,
Benny Takin
Equities Trader
(benny.takin@jmpmarkets.com)
(+675 7001 9121/320 0240)
JMP Securities Limited
Level 3, ADF Haus, Musgrave Street
PO Box 2064
Papua New Guinea