04 – 08 May 2026
Weekly Trade Commentary
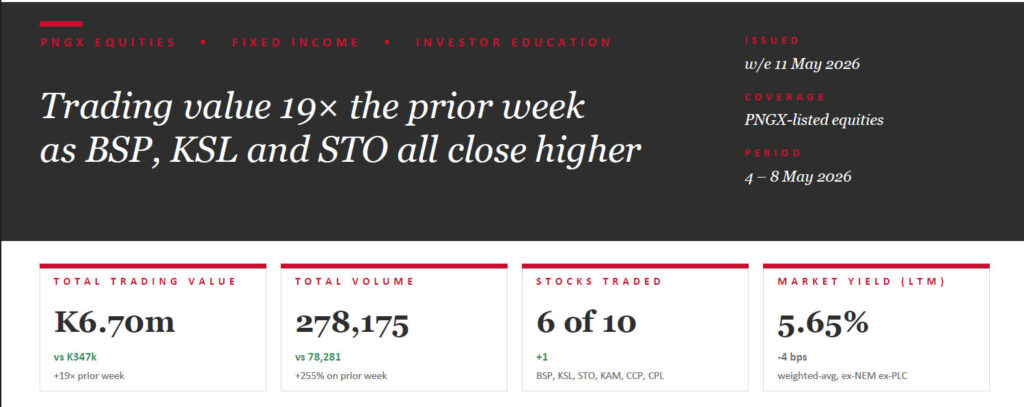
- A markedly busier week — 6 stocks traded with total value of K6.70m, ~19× the prior week’s K347k.
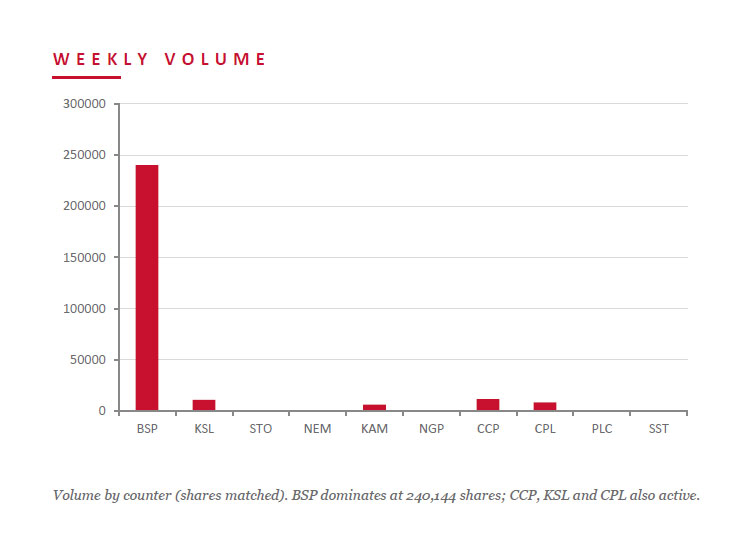
- BSP led with 240,144 shares closing up 60t at K27.50.
- KSL traded 10,914 shares, up 24t to K4.35.
- STO traded 650 shares up 10t at K22.10.
- KAM closed up 4t to K2.10 on 6,270 shares.
- CCP traded 11,775 shares steady at K4.66.
- CPL gave back 14t to K0.65 on 8,422 shares.
WEEKLY MARKET REPORT | 04 May, 2026 – 08 May, 2026
| STOCK | WEEKLY VOLUME | CLOSING PRICE | VALUE | CHANGE | % CHANGE |
|---|---|---|---|---|---|
| BSP | 240,144 | 27.50 | 6,603,610.20 | +0.60 | +2.23% |
| KSL | 10,914 | 4.35 | 47,474.10 | +0.24 | +5.84% |
| STO | 650 | 22.10 | 14,365.00 | +0.10 | +0.45% |
| KAM | 6,270 | 2.10 | 13,167.00 | +0.04 | +1.94% |
| CCP | 11,775 | 4.66 | 54,871.50 | — | — |
| CPL | 8,422 | 0.65 | 5,474.30 | -0.14 | -17.72% |
| 278,175 | TOTAL | 6,702,757.88 | +0.75% |
WEEKLY YIELD CHART | 04 May, 2026 – 08 May, 2026
| STOCK | ISSUED SHARES | MKT CAP (K) | INT 24 | FIN 24 | INT 25 | FIN 25 | YIELD % LTM |
|---|---|---|---|---|---|---|---|
| BSP | 467,317,665 | 12,851,235,788 | 0.450 | 1.210 | 0.500 | 1.380 | 6.84% |
| KSL | 294,332,296 | 1,280,345,488 | 0.106 | 0.155 | 0.126 | 0.193 | 7.33% |
| STO | 3,261,616,703 | 72,081,729,136 | 0.506 | 0.414 | 0.559 | 0.443 | 4.53% |
| NEM* | 1,097,000,000 | 537,530,000,000 | — | 2.110 | 2.110 | $0.260 | 0.86% |
| KAM | 53,259,588 | 111,845,135 | 0.200 | — | 0.250 | — | 11.90% |
| NGP | 45,890,700 | 61,952,445 | 0.040 | 0.120 | 0.040 | 0.190 | 17.04% |
| CCP | 307,931,332 | 1,434,960,007 | 0.120 | 0.121 | 0.121 | 0.130 | 5.39% |
| CPL | 206,277,911 | 134,080,642 | — | — | 0.050 | — | 7.69% |
| PLC | 858,075,186 | 926,721,201 | — | — | — | — | — |
| SST | 31,008,237 | 1,550,411,850 | 0.400 | 0.300 | 0.400 | 0.650 | 2.10% |
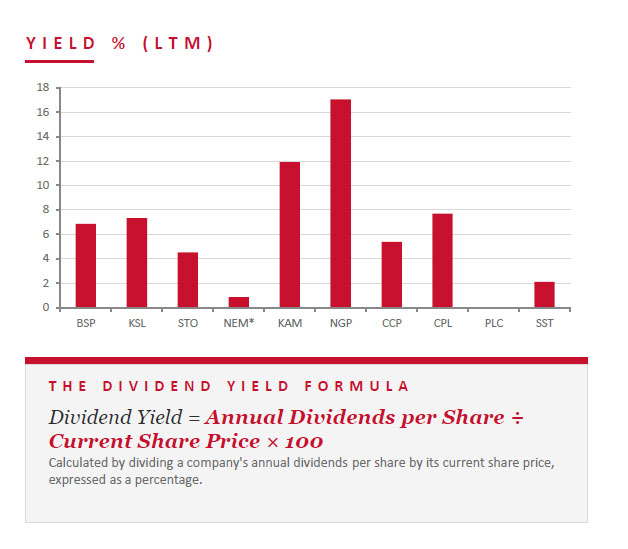
| TOTAL / WEIGHTED-AVG | 5.65% |
LTM = Last twelve months. Yields use most recently declared interim and final dividends. NEM dividends in USD until PGK rate announced; NEM excluded from market-wide yield. PLC now added.

BPNG TREASURY BILL AUCTION
Auction: 06-MAY-26 / GOI / Government Treasury Bill Settlement: 08-MAY-26 Amount on Offer: K227.0m (over-subscribed by K252.67m)
| TERMS | ISSUE / 63 | ISSUE / 91 | ISSUE / 182 | ISSUE / 273 | ISSUE / 364 | TOTAL |
|---|---|---|---|---|---|---|
| Weighted Avg Yield | — | — | 5.26% | 5.40% | 4.88% | — |
| Amount on Offer (K’m) | — | — | 10.00 | 50.00 | 167.00 | 227.00 |
| Bids Received (K’m) | — | — | 33.15 | 30.48 | 416.04 | 479.67 |
| Successful Bids (K’m) | — | — | 10.15 | 25.48 | 204.34 | 239.97 |
| Over / (Under) Subscribed (K’m) | — | — | +23.15 | (19.52) | +249.04 | +252.67 |
BPNG GOVERNMENT BOND AUCTION
MOST RECENT AUCTION — NO NEW ISSUANCE WEEK ENDING 08 MAY 2026
Auction: 21-MAR-26 / GOB / Government Bond Settlement: 24-MAR-26 Amount on Offer: K200.0m
| SERIES | AMOUNT ON OFFER (K’m) | BIDS RECEIVED (K’m) | SUCCESSFUL BIDS (K’m) | SUCCESSFUL YIELD | WEIGHTED AVG RATE | COUPON RATE | NET SUBSCRIPTION (K’m) |
|---|---|---|---|---|---|---|---|
| Issue ID 2026/5057 – 3 yr | 30.00 | 60.00 | 60.00 | 6.45-6.50% | 6.48% | 5.75% | +30.00 |
| Issue ID 2026/5058 – 5 yr | 40.00 | 42.00 | 42.00 | 6.73-6.80% | 6.76% | 6.00% | +2.00 |
| Issue ID 2026/5059 – 7 yr | 50.00 | 52.00 | 52.00 | 6.89-6.93% | 6.91% | 6.25% | +2.00 |
| Issue ID 2026/5060 – 10 yr | 50.00 | 82.00 | 67.00 | 7.07-7.20% | 7.11% | 6.50% | +32.00 |
| Issue ID 2026/5061 – 15 yr | 30.00 | 32.00 | 32.00 | 7.45-7.47% | 7.46% | 6.75% | +2.00 |
| TOTAL | 200.00 | 268.00 | 253.00 | +68.00 |
INVESTOR EDUCATION – Capital Structure
What is Capital Structure?
Capital structure refers to the mix of debt and equity a firm uses to fund its operations and finance its assets. It is typically expressed as a debt-to-equity or debt-to-capital ratio.
Both debt and equity capital fund business operations, capital expenditures, acquisitions and other investments. There are tradeoffs whenever firms choose between them — managers balance the two to find an optimal capital structure that minimises the weighted-average cost of capital while preserving financial flexibility.
When a company raises money, it typically uses a mix of four layers, ranked by priority of repayment, risk and expected return — from senior debt at the top (lowest risk, lowest return) down to common equity at the bottom (highest risk, highest upside).
The Capital Stack
- Senior Debt — Top of the stack — usually bank loans or secured bonds. Often collateralised by company assets, with strict covenants and first claim on cash flow. Lowest cost, lowest risk to the lender.
- Subordinated (Jnr) Debt — Ranks below senior debt but above equity; often called mezzanine financing. Interest rates ~12–18% compensate for lower repayment priority.
- Preferred Equity — Hybrid security with debt-like and equity-like features. Senior to common equity, junior to all debt. Typically pays fixed dividends but carries no voting rights.
- Common Equity — Residual interest in the company. Highest risk but also highest upside — captures all profit growth above debt and preferred claims.
What we’ve been reading
Same shock, different world: why this isn’t the 1970s
Monthly Bell — Bell Potter • Rob Crookston, Strategist
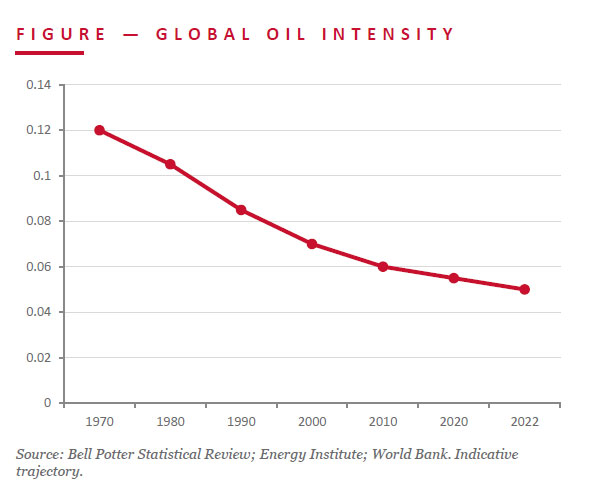
Bell Potter pushes back on the now-familiar 1970s analogy for the current Iran-related oil shock. Developed economies today are services-led, not industrial: oil intensity (tonnes-of-oil per US$1,000 GDP) has more than halved since 1970 — from 0.12 to 0.05 by 2022. The S&P 500 of 2026 is dominated by tech, platforms and chip designers whose oil exposure is structurally low.
The oil market itself is more shock-resistant: OPEC’s share of supply has fallen below 30% (from 37%+ in 1974), US shale and Canadian oil sands have added ~15m bpd since 2010, and strategic petroleum reserves built since 1973 buy time for diplomacy. Deep, liquid futures markets (WTI since 1983, Brent since 1988) let producers and consumers hedge in ways unavailable 50 years ago.
JMP read: Long-run US inflation expectations have barely moved despite the higher oil price — the Fed can look through this as a relative-price adjustment rather than the start of a 1970s wage-price spiral. Bell Potter’s call is to stay overweight growth and quality DM exposure rather than retreat. For PNG investors, the read-through is that energy-driven global recession risk looks lower than headlines suggest.
Regards,
Benny Takin
Equities Trader — Primary contact, JMP Weekly Report
benny.takin@jmpmarkets.com
+675 7001 9121 / 320 0240
JMP Securities Limited
Level 3, ADF Haus, Musgrave Street
PO Box 2064, Port Moresby NCD, Papua New Guinea