30 March – 02 April 2026
Weekly Trade Commentary
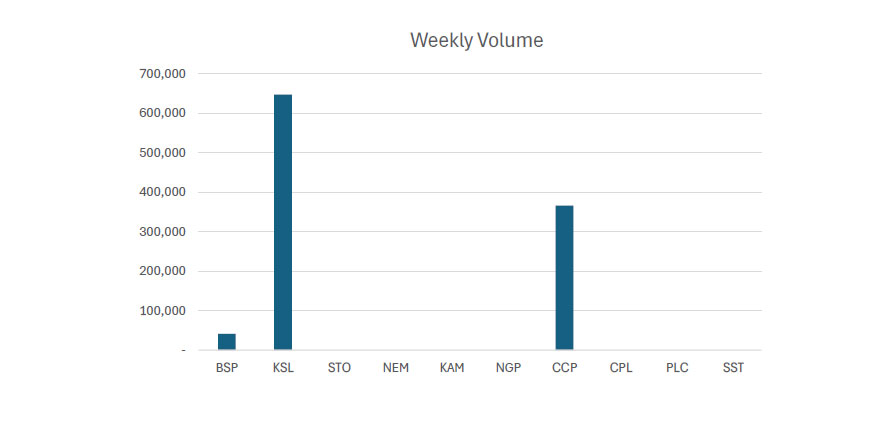
- Last week saw only 3 stocks traded on the local market with a total trading value of K3,479,179.26.
- BSP traded 41,320 shares steady at K26.90.
- KSL traded 646,993 shares, closing 2t higher at K4.00.
- Lastly, CCP traded 250,000 shares steady at K4.66.
WEEKLY MARKET REPORT | 30 March, 2026 – 02 April, 2026
| STOCK | WEEKLY VOLUME | CLOSING PRICE | VALUE | BID | OFFER | CHANGE | % CHANGE |
|---|---|---|---|---|---|---|---|
| BSP | 41,320 | 26.90 | 1,088,311.26 | – | – | – | – |
| KSL | 646,993 | 4.00 | 1,225,868.00 | – | 4.10 | 0.02 | 0.01% |
| STO | – | 21.50 | – | 22.00 | – | – | – |
| NEM | – | 500.00 | – | – | – | – | – |
| KAM | – | 2.00 | – | 2.10 | – | – | – |
| NGP | – | 1.35 | – | – | – | – | – |
| CCP | 250,000 | 4.66 | 1,165,000.00 | – | – | – | – |
| CPL | – | 0.79 | – | – | 0.79 | – | – |
| PLC | – | 1.08 | – | – | 1.10 | – | – |
| SST | – | 50.00 | – | – | 50.00 | – | – |
| 938,313 | TOTAL | 3,479,179.26 | 0.01% |
Key takeaways:
- Market Announcement: SST- 2025 Annual Report Download >>
- Market Announcement: KSL- Variation of the Audited Financial Statements to the Unaudited Preliminary Final Report (Appendix 5C) Download >>
- Market Announcement: SST Appendix 4G 2025 & Corporate Governance Statement 2025 Download >> Download >>
- Market Announcement: NEM- First Quarter 2026 Earning Conference Call Download >>
- Market Announcement: NEM -Form 144 as filed -Peter Toth Download >>
- Market Announcement: SST-2026 AGM & Director Nomination Deadline Download >>
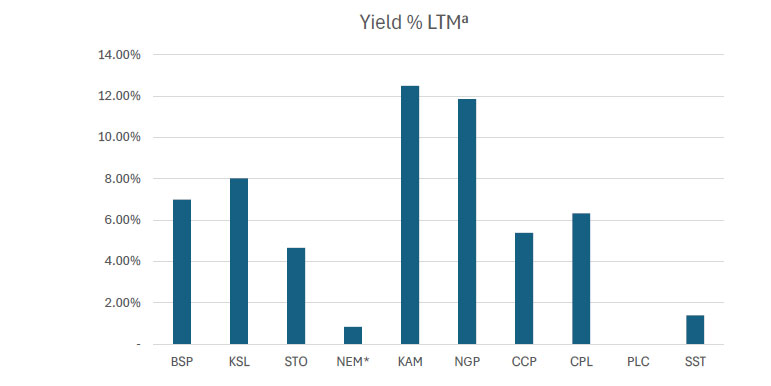
WEEKLY YIELD CHART | 30 March, 2026 – 02 April, 2026
| Stock | Number Issued of Shares | Market Cap | 2023 Interim Div | 2023 Final Div | 2024 Interim Div | 2024 Final Div | 2025 Interim Div | 2025 Final Div | Yield % LTM |
|---|---|---|---|---|---|---|---|---|---|
| BSP | 467,317,665 | 12,570,845,189 | K0.370 | K1.060 | K0.450 | K1.210 | K0.500 | K1.380 | 6.99% |
| KSL | 292,965,754 | 1,166,003,701 | K0.100 | K0.160 | K0.106 | K0.155 | K0.126 | K0.193 | 8.02% |
| STO | 3,261,616,703 | 70,124,759,115 | K0.310 | K0.660 | K0.506 | K0.414 | K0.559 | K0.443 | 4.66% |
| NEM* | 1,097,000,000 | 548,500,000,000 | – | – | – | K2.110 | K2.110 | (USD) $0.260 | 0.84% |
| KAM | 53,259,588 | 106,519,176 | K0.120 | – | K0.200 | – | K0.250 | – | 12.50% |
| NGP | 45,890,700 | 61,952,445 | K0.030 | – | K0.040 | K0.120 | K0.040 | – | 11.85% |
| CCP | 307,931,332 | 1,434,960,007 | K0.110 | K0.130 | K0.120 | K0.121 | K0.121 | K0.130 | 5.39% |
| CPL | 206,277,911 | 162,959,550 | K0.050 | – | – | – | K0.050 | – | 6.33% |
| PLC | 858,075,186 | 926,721,201 | – | – | – | – | – | – | – |
| SST | 31,008,237 | 1,550,411,850 | K0.350 | K0.600 | K0.400 | K0.300 | K0.400 | – | 1.40% |
| TOTAL | 636,605,132,233 | 5.76% |
a LTM = Last Twelve Months. We have calculated yields based on most recently declared
interim and final dividends.
* NEM pays quarterly dividends. We have added last 4 payments at current FX rates.
* NEM dividends in $USD until PGK rate is announced.
*PLC now added
Dividend yield – is calculated by dividing a company’s annual dividends per share by its current share price and expressing the result as a percentage.
INVESTOR EDUCATION
How does the Stock Market work in Papua New Guinea?Investors buy shares in public markets to secure:
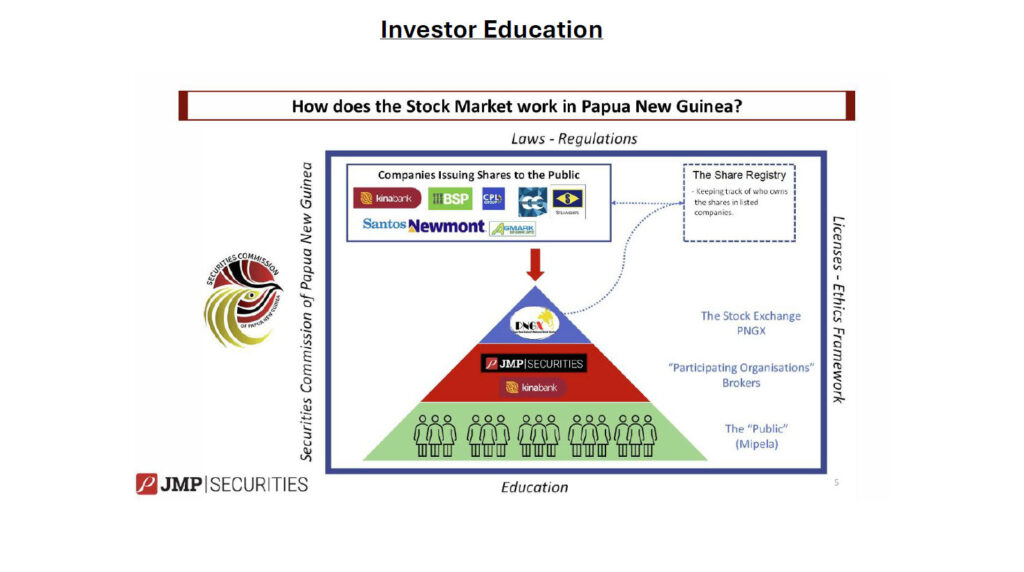
- Income through dividends
- Profits from Price Increases
- Diversified Pool of Assets for their savings
- The Stock Market plays an important role in channeling capital from investors and savers to companies that have profitable opportunities that they wish to pursue.
- This makes the economy more efficient and drives investment, profits and employment.
- Stock Markets are an efficient way for the “Public” to get a chance to invest in companies.
- Without efficient and public markets, it can be difficult for companies to raise sufficient funds AND it can be challenging for the investing public to build diversified and resilient investment portfolios.
- Liquidity and efficient price discovery are key benefits of public capital markets such as PNGX. Companies can get capital at the right price and investors can buy, hold and sell their portfolios in accordance with their changing needs and risk appetite.


Domestic Markets Department – Money Markets Operations Unit
Auction Number: 01-APR-26 / GOI / Government Treasury Bill
Settlement Date: 02-APR-26
Amount on Offer: K287.000 million
| TERMS | ISSUE ID 2025 / 63 | ISSUE ID 2025 / 91 | ISSUE ID 2025 / 4741 182 | ISSUE ID 2025 / 4700 273 | ISSUE ID 2025 / 4743 364 | TOTAL |
|---|---|---|---|---|---|---|
| Weighted Average Yield | 0.000 | 0.00% | 5.42% | 5.60% | 5.62% | |
| Amount on Offer Kina Million | 0.000 | 0.000 | 10.000 | 60.000 | 217.000 | 287.000 |
| Bids Received Kina Million | 0.000 | 0.000 | 42.000 | 130.000 | 423.160 | 595.160 |
| Successful Bids Kina Million | 0.000 | 0.000 | 29.000 | 130.000 | 151.160 | 310.160 |
| Overall Auction OVER-SUBSCRIBED by | 0.000 | 0.000 | 32.000 | 70.000 | 206.160 | 308.160 |
Domestic Markets Department – Money Markets Operations Unit
Auction Number: 17-MAR-26 / GOB / Government Bond
Settlement Date: 20-MAR-26
Amount on Offer: K200.000 million
| SERIES | Amount on Offer (K’million) | Bids Received (K’million) | Successful Bids (K’million) | Successful Bids Yield | Weighted Average Rate (WAR) | Coupon Rate | Overall Auction Net Subscription |
|---|---|---|---|---|---|---|---|
| Issue ID 2026/5057 (3 years) | 30.000 | 33.45 | 23.45 | 5.75%-6.57% | 6.48% | 5.75% | K3.45 |
| Issue ID 2026/5058 (5 years) | 40.000 | 65.000 | 55.000 | 6.58%-6.89% | 6.80% | 6.00% | K25.000 |
| Issue ID 2026/5059 (7 years) | 50.000 | 68.000 | 68.000 | 6.25%-7.11% | 6.95% | 6.25% | K18.000 |
| Issue ID 2026/5060 (10 years) | 50.000 | 72.000 | 42.000 | 6.05%-7.23% | 7.14% | 6.50% | K22.000 |
| Issue ID 2026/5061 (15 years) | 30.000 | 42.000 | 12.000 | 7.46%-7.55% | 7.48% | 6.75% | K12.000 |
| TOTAL | 200.000 | 780.450 | 200.450 | K80.450 |
What we have been reading
Global Imbalances: Old Questions, New Answers?
INTERNATION MONETARY FUND
By: Pierre-Olivier Gourinchas, Christian Mummssen

Widening global current account imbalances are best addressed by simultaneous domestic policy adjustments. Industrial policy and tariffs offer a costly fix with unreliable effects on imbalances.
Global current account imbalances are widening again, reversing a decade of steady decline following the global financial crisis. History suggests a clear risk: widening imbalances have often been accompanied by concentrated and lower-quality growth, triggered sectoral dislocations across trading partners, and preceded financial crises or abrupt reversals of capital flows. With the global economy already absorbing multiple shocks, such a disorderly adjustment could be exceptionally costly.
This renewed widening has revived questions about which policy tools can meaningfully impact external positions. In particular, the recent expansion of industrial policies and the proliferation of trade restrictions have diverse economic and non-economic motives but are limited analytically and empirically clarity on how these policies affect external balances.
Our new policy paper aims to fill this gap by linking domestic drivers to external outcomes. We conclude that traditional macroeconomic policies remain the dominant drivers of external balances and are the best lever for addressing current account imbalances. Our analysis suggests that tariffs only improve the current account in a limited set of circumstances and generally have modest and uncertain effects on the current account. Industrial policies, when applied with economy-wide tools, can have larger impacts by raising national saving and compressing domestic demand.
Saving and investment
For any economy, the current account reflects the difference between what its people, businesses, and government save and invest. This concept anchors the IMF’s long-standing analytical framework for external sector assessments.
Policies affect the current account to the extent that they alter saving or investment. This depends not just how policies affect activity today, but also how they shift expectations. Personal saving rises when people expect income to decline, and it falls when they expect increased income. Companies invest based on their outlook for returns, not just today’s profitability. This insight is central to understanding why many trade and industrial policies often have limited or counterintuitive impacts on the current account.
We can see how standard macroeconomic policies have driven some of the recent increase in global imbalances: bigger budget deficits and robust consumer spending have lowered saving in the United States, while weaker demand and higher saving in China have followed its real estate slowdown.
Of course, positive or negative current account balances are not inherently undesirable, as they can reflect structural factors such as countries saving more as their population ages. It is also important to bear in mind that the relevant metric for assessing imbalances is the overall current account position of a country against the rest of the world, not bilateral or sectoral balances. Nor are imbalances simply about misaligned exchange rates and price competitiveness. A meaningful diagnosis requires a full macroeconomic assessment of influences on saving and investment, including policy drivers and structural forces.
Policy details matter
Tariffs have been justified as a way to narrow trade deficits. However, our analysis finds that they have only small and unreliable effects on the current account because they are often perceived as permanent or are frequently retaliated against. In such cases, people do not adjust saving in anticipation of future price changes. The result is a nearly unchanged current account.
There is one important exception: temporary tariffs can raise saving by encouraging people to postpone consumption. In theory, this can increase the current account balance, though such episodes are rare, and empirical evidence suggests the effects are modest and short-lived.
Industrial policies are more diverse—and so are their effects. We distinguish two types of industrial policies: micro, which target specific companies or sectors, and macro, which are economy-wide policies that are often combined with financial or capital account restrictions.
Micro industrial policies—such as subsidies for a specific industry or targeted tax incentives—generally have ambiguous and limited effects on the current account. When they succeed in raising aggregate productivity, they tend to boost investment and consumption, often lowering the current account balance. When they fail, for example by misallocating resources and depressing productivity, they can increase the current account balance, but at the cost of lost output. Either way, large and systematic effects on external balances are uncommon.
Macro industrial policies, by contrast, can have larger effects. These strategies, often associated with export-led growth models, combine foreign asset accumulation, capital flow restrictions, financial repression, or other mechanisms that boost national saving. These policies work not by improving efficiency but by forcing saving, often at the expense of economic welfare. The current account balance increases, but mainly because domestic demand is restrained and resources are redirected toward external surpluses.
The conclusion is clear: industrial policies and tariffs are not shortcuts to external rebalancing. When they affect the current account, they often do so by suppressing consumption or investment—hardly a recipe for sustainable growth. Durable rebalancing still depends on sound domestic policies, not trade barriers.
Future imbalances and output
Applying our findings to the current economic picture, scenario analysis shows that global imbalances could widen further if trends persist. This would reflect continued large fiscal deficits and strong domestic demand in the United States, additional government support to exporters in China alongside weaker safety net provision and consumption, and subdued investment and weak productivity growth in Europe. In this setting, an escalation of tariffs does little to change current account positions, largely because these measures are reciprocated or perceived as permanent, but it does lower output across regions.
By contrast, an alternative scenario anchored in domestic rebalancing—fiscal consolidation in deficit countries, more consumption-led growth in surplus economies, and productivity-enhancing investment elsewhere—would narrow global imbalances and raise global output.
This synchronized adjustment would lead to the best outcome for the global economy. The economic drag from US fiscal tightening would be offset by stronger demand from China and Europe. But even if such coordination proves difficult, the best course of action for each country is clear: start addressing domestic imbalances now, regardless of what others do. Delaying adjustment poses a threat to domestic and global economic stability. Unilateral adjustment will also add pressure for other economies to adjust. Stronger domestic demand in China, by lifting global demand, would increase global interest rates and make fiscal adjustment more likely in other regions such as the United States. Fiscal consolidation in the United States could further stoke deflationary forces in China and incentivize efforts to boost consumption.
What is clear is that global imbalances will be shaped by domestic macroeconomic trajectories and policies rather than by tariffs or narrowly targeted industrial policies. It’s also evident that reducing global imbalances works best when countries move together. The IMF, through its analysis, policy advice, and convening power, can help its members move toward this better outcome.
Regards,
Benny Takin
Equities Trader
(benny.takin@jmpmarkets.com)
(+675 7001 9121/320 0240)
JMP Securities Limited
Level 3, ADF Haus, Musgrave Street
PO Box 2064
Papua New Guinea