07 – 10 April 2026
Weekly Trade Commentary
- Last week saw 5 stocks traded on the local market with a total trading value of K2,568,947.24.
- BSP traded 29,900 shares high by 60t closing at K27.50.
- KSL traded 376,790 shares steady at K4.00.
- NEM traded 490 units down by K10.00 closing at K490.00.
- CCP traded only 1,029 shares closing steady at K4.66.
- Lastly, PLC traded 2,263 units high by 2t closing the week-off at K1.10.
WEEKLY MARKET REPORT | 07 April, 2026 – 10 April, 2026
| STOCK | WEEKLY VOLUME | CLOSING PRICE | VALUE | BID | OFFER | CHANGE | % CHANGE |
|---|---|---|---|---|---|---|---|
| BSP | 29,900 | 27.50 | 814,006.80 | – | – | 0.60 | 2.23% |
| KSL | 376,790 | 4.00 | 1,507,160.00 | – | 4.10 | – | – |
| STO | – | 21.50 | – | 22.00 | – | – | – |
| NEM | 490 | 490.00 | 240,100.00 | – | – | (10.00) | (2.00%) |
| KAM | – | 2.00 | – | 2.10 | – | – | – |
| NGP | – | 1.35 | – | – | – | – | – |
| CCP | 1,029 | 4.66 | 4,795.14 | – | – | – | – |
| CPL | – | 0.79 | – | – | 0.79 | – | – |
| PLC | 2,263 | 1.10 | 2,885.30 | – | 1.10 | 0.02 | 1.85% |
| SST | – | 50.00 | – | – | 50.00 | – | – |
| 410,832 | TOTAL | 2,568,947.24 | (1.39%) |
Key takeaways:
- Market Announcement: NEM -Form 4 as filed – Peter Toth Download >>
- Market Announcement – KSL – Appendix 10B – Notice of Change in Director’s or CEO’s Interest – Ian Clough Download >>
- Market Announcement -STO- Santos announces Alaska appraisal success and provides major projects update Download >>
- Market Announcement – BSP- Board Changes – Appointment of Director Michael Makap Download >>
- Market Announcement -BSP- Appendix 10A & Appendix 1E Download >> Download >>
- Market Announcement-STO- Appendix 3G & Appendix 3H Download >> Download >>
- Market Announcement-PLC- Appendix 3Y- Change of Director’s Interest Notice Download >>
- Market Announcement: KAM – Public Notice Announcement Download >>
- Market Announcement: NEM- Form 3 as filed -Deborah Levya Download >>
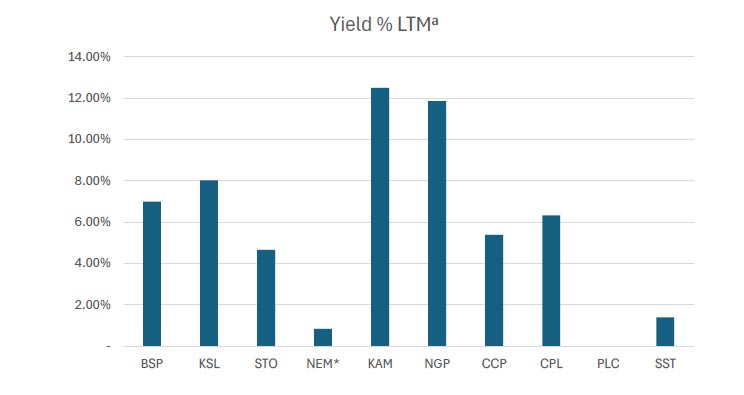
WEEKLY YIELD CHART | 07 April, 2026 – 10 April, 2026
| Stock | Number Issued of Shares | Market Cap | 2023 Interim Div | 2023 Final Div | 2024 Interim Div | 2024 Final Div | 2025 Interim Div | 2025 Final Div | Yield % LTM |
|---|---|---|---|---|---|---|---|---|---|
| BSP | 467,317,665 | 12,570,845,189 | K0.370 | K1.060 | K0.450 | K1.210 | K0.500 | K1.380 | 6.99% |
| KSL | 292,965,754 | 1,166,003,701 | K0.100 | K0.160 | K0.106 | K0.155 | K0.126 | K0.193 | 8.02% |
| STO | 3,261,616,703 | 70,124,759,115 | K0.310 | K0.660 | K0.506 | K0.414 | K0.559 | K0.443 | 4.66% |
| NEM* | 1,097,000,000 | 548,500,000,000 | – | – | – | K2.110 | K2.110 | (USD) $0.260 | 0.84% |
| KAM | 53,259,588 | 106,519,176 | K0.120 | – | K0.200 | – | K0.250 | – | 12.50% |
| NGP | 45,890,700 | 61,952,445 | K0.030 | – | K0.040 | K0.120 | K0.040 | – | 11.85% |
| CCP | 307,931,332 | 1,434,960,007 | K0.110 | K0.130 | K0.120 | K0.121 | K0.121 | K0.130 | 5.39% |
| CPL | 206,277,911 | 162,959,550 | K0.050 | – | – | – | K0.050 | – | 6.33% |
| PLC | 858,075,186 | 926,721,201 | – | – | – | – | – | – | – |
| SST | 31,008,237 | 1,550,411,850 | K0.350 | K0.600 | K0.400 | K0.300 | K0.400 | – | 1.40% |
| TOTAL | 636,605,132,233 | 5.76% |
a LTM = Last Twelve Months. We have calculated yields based on most recently declared
interim and final dividends.
* NEM pays quarterly dividends. We have added last 4 payments at current FX rates.
* NEM dividends in $USD until PGK rate is announced.
*PLC now added
Dividend yield – is calculated by dividing a company’s annual dividends per share by its current share price and expressing the result as a percentage.

Domestic Markets Department – Money Markets Operations Unit
Auction Number: 08-APR-26 / GOI / Government Treasury Bill
Settlement Date: 10-APR-26
Amount on Offer: K287.000 million
| TERMS | ISSUE ID 2025 / 63 | ISSUE ID 2025 / 91 | ISSUE ID 2025 / 4741 182 | ISSUE ID 2025 / 4700 273 | ISSUE ID 2025 / 4743 364 | TOTAL |
|---|---|---|---|---|---|---|
| Weighted Average Yield | 0.000 | 0.00% | 5.41% | 5.58% | 5.59% | |
| Amount on Offer Kina Million | 0.000 | 0.000 | 10.000 | 60.000 | 217.000 | 287.000 |
| Bids Received Kina Million | 0.000 | 0.000 | 37.530 | 177.100 | 493.780 | 708.410 |
| Successful Bids Kina Million | 0.000 | 0.000 | 20.530 | 50.000 | 312.780 | 383.310 |
| Overall Auction OVER-SUBSCRIBED by | 0.000 | 0.000 | 27.530 | 117.100 | 276.780 | 421.410 |
Domestic Markets Department – Money Markets Operations Unit
Auction Number: 17-MAR-26 / GOB / Government Bond
Settlement Date: 20-MAR-26
Amount on Offer: K200.000 million
| SERIES | Amount on Offer (K’million) | Bids Received (K’million) | Successful Bids (K’million) | Successful Bids Yield | Weighted Average Rate (WAR) | Coupon Rate | Overall Auction Net Subscription |
|---|---|---|---|---|---|---|---|
| Issue ID 2026/5057 (3 years) | 30.000 | 33.45 | 23.45 | 5.75%-6.57% | 6.48% | 5.75% | K3.45 |
| Issue ID 2026/5058 (5 years) | 40.000 | 65.000 | 55.000 | 6.58%-6.89% | 6.80% | 6.00% | K25.000 |
| Issue ID 2026/5059 (7 years) | 50.000 | 68.000 | 68.000 | 6.25%-7.11% | 6.95% | 6.25% | K18.000 |
| Issue ID 2026/5060 (10 years) | 50.000 | 72.000 | 42.000 | 6.05%-7.23% | 7.14% | 6.50% | K22.000 |
| Issue ID 2026/5061 (15 years) | 30.000 | 42.000 | 12.000 | 7.46%-7.55% | 7.48% | 6.75% | K12.000 |
| TOTAL | 200.000 | 780.450 | 200.450 | K80.450 |
INVESTOR EDUCATION
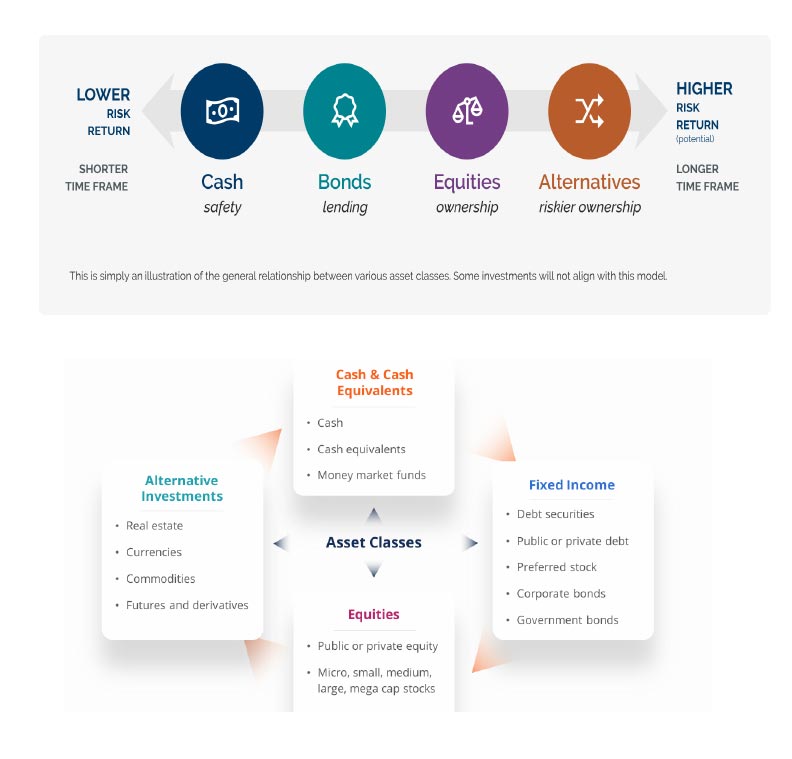
Asset classes are groups of financial instruments with similar characteristics, behaviors, and regulations, used to build diversified portfolios. The primary classes are equities (stocks), fixed income (bonds), and cash equivalents, often expanded to include real estate, commodities, and alternatives to manage risk and return.
4 main classes
- Cash & Cash Equivalents
- Fixed Income
- Equities
- Alternative Investments
Risk and Return
Risk and Return are highly correlated, and more risk results in higher volatility
- Risk of Investments
– Volatility of returns
– Unsystematic RISK (asset-specific)
– Can be mitigated - Return on Investment
– The value of the gain or loss on an investment
– Measured on an absolute or relative basis
What we have been reading
How the Iran War Is Impacting Investment Portfolios
Goldman Sachs

Stocks have declined and bond yields have spiked since the start of the war in Iran, but losses to balanced portfolios have been limited.
Our strategists’ baseline expectation is for markets to recover based on steady economic growth expectations, limited long-term inflation impact, and continued policy easing, but there are still risks in the near term.
After 15 years of innovation having been a major driver of balanced portfolio returns, the average investment portfolio is now overweight innovation and does not have enough assets that protect against inflation, according to Goldman Sachs Research.
The war in Iran and jump in oil prices represent a risk to traditional balanced portfolios, even as losses have so far been limited, according to Goldman Sachs Research. To build more robust portfolios, our strategists recommend an equal split between assets exposed to innovation, those protecting against inflation, and those that benefit from a flight to safety.
Stocks have declined and bond yields have spiked since the start of the conflict, but so far, the losses to balanced portfolios like those containing 60% stocks and 40% bonds have been “relatively small,” according to Christian Mueller-Glissmann, head of asset allocation in Goldman Sachs Research.
“To assess how little damage has been done to global 60/40 type strategies, you can look at our world portfolio proxy,” Mueller-Glissmann says. This portfolio, which is worth around $300 trillion and made up of virtually all the world’s financial assets, has only declined by around five percent since the start of the war. “Compared to historical 60/40 drawdowns such as in 2022, that’s a very modest decline so far,” Mueller-Glissmann says. A 60/40 portfolio typically refers to a portfolio split between S&P 500 stocks (60%) and 10-year US Treasury bonds (40%).
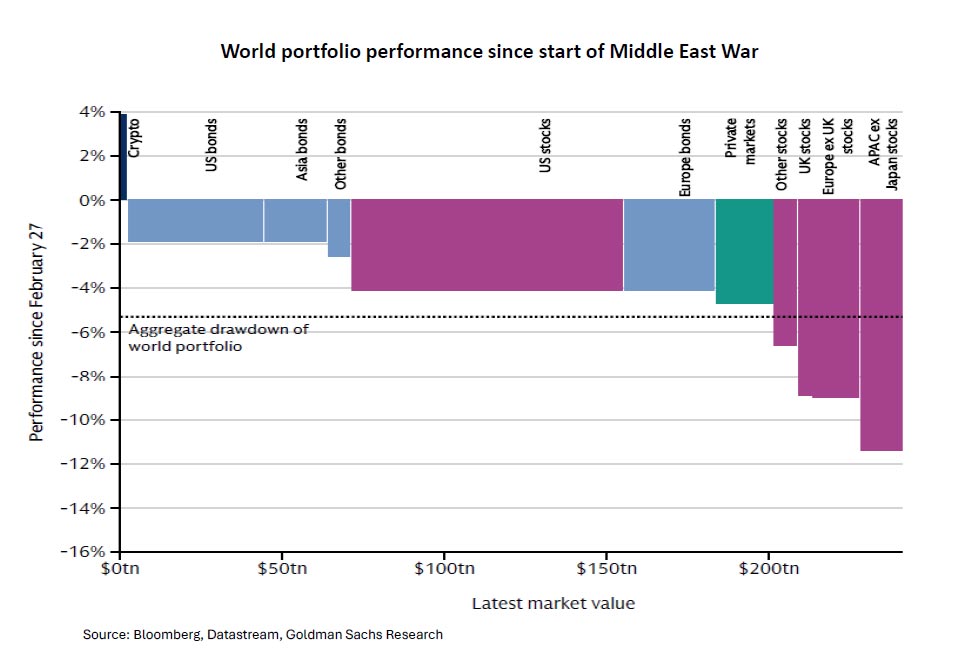
Outside of commodities the biggest moves have been in bonds, where short-term yields have spiked. But the upward pressure on longer-dated bonds has been less extreme compared with previous market shocks like the 2022 inflation surge caused by the Covid pandemic and stagflation in the 1970s. At the same time, expectations for economic growth have not been heavily impacted by the war, which has limited the pain for stocks.
Why didn’t stock markets decline more due to the Iran war?
We’ve been surprised by how resilient equities have been in the face of both the energy and the rate shock. The big concern now is that the rate shock eventually weighs on growth expectations.
There is going to be some lasting damage, and our economists have downgraded their growth and upgraded their inflation forecasts pretty much around the world. But the growth pricing has been remarkably resilient across assets as well as within equities, and by extension, equities have also been resilient.
Why is that? I think there are two elements. First of all, there’s a certain concern about reversal risk. Around the Liberation Day shock when equities reacted very strongly, the market aggressively re-priced growth, and then you got a pivot on the policy side that prompted a major reversal in markets. Maybe investors have been reluctant to adjust portfolios too aggressively around the geopolitical shock this time.
But the other thing that’s important is that the macro conditions with which we entered the year were very strong. We had the Big Beautiful Bill, which supported an expectation for above-trend growth in the first half of the year. And tracking GDP growth estimates were above 3%. That means that you had a very good anchor in terms of growth. The same is true globally—we were right in the middle of a cyclical acceleration.
So, the market went from being very optimistic overall to being less optimistic, but it has not turned bearish so far.
How are rising interest rates impacting investment portfolios?
Generally, when you get a rate shock, it weighs on 60/40 portfolios and means that bonds cannot help you in buffering growth shocks. The risk is always that the rate shock becomes a growth shock, because higher rates tighten financial conditions, tighten credit conditions, and can weigh on markets more broadly, which can in turn feed into growth.
This time, the rate shock is so far particularly large in short-term rates, not in longer-term rates. And I think there are a few reasons for that: First of all, inflation in 2022 (when Russia invaded Ukraine) was already at 5% with strong demand from the reopening after Covid shutdowns—and then you had an energy shock on top. This time, inflation was much lower, much closer to central bank targets.
And the other big difference is the starting point of bond yields. Compared with 2022, bond yields are much higher going into this inflationary period. In 2022, you had the Covid crisis leading to a sharp collapse in bond yields, and because inflation already picked up in 2021 going into 2022, real yields were very low. At the beginning of the year, the 10-year real yield for Treasuries was close to negative 100 basis points and increased to more than 150 basis points in a few months due to aggressive central bank tightening. Now, if you look at real yields for longer-term government bonds, they’re already quite high at around 2%.
How can investors adjust their portfolios in response to the conflict?
There will be continued geopolitical volatility in the next few weeks and possibly months, so I think it’s important for investors to step back and really look at what assets and what type of allocation changes can create robustness.
After 15 years of innovation and US tech stocks having been a major driver of global equity returns, portfolios are now overweight innovation, and they don’t have enough assets that protect you from inflation.
Obviously, some assets have repriced inflation risk already very sharply, like shorter-dated index-linked bonds in the US and the UK. But there are opportunities—for example, in the medium term, real yields for longer-dated inflation-linked bonds have picked up, but inflation expectations have not risen as much yet.
Within equities, we like infrastructure assets that have real cash flow growth potential in the medium term. There are two drivers that help these assets. First of all, there’s the prospect of a bit more inflation and inflation volatility which should support their relative valuations. But we’ve also seen since the beginning of the year increasing concerns about disruption from artificial intelligence (AI) for tech incumbents like software stocks. This has pushed people towards so-called “HALO” assets—heavy assets, low obsolescence, which often overlap with infrastructure assets.
The last thing that I’ll mention in that vein is gold. Because of central banks reacting to inflation risk very strongly this time and the sharp move in short-term rates, gold has sold off, reversing its strong performance last year. But the idea of gold as a diversifier both for medium-term inflation risk and for foreign currency risk (the dollar has strengthened over the last month, and we expect that to reverse to some extent) will likely support gold again in the medium term.
The risk of a large 60/40 decline is relatively low, based on current macroeconomic conditions.
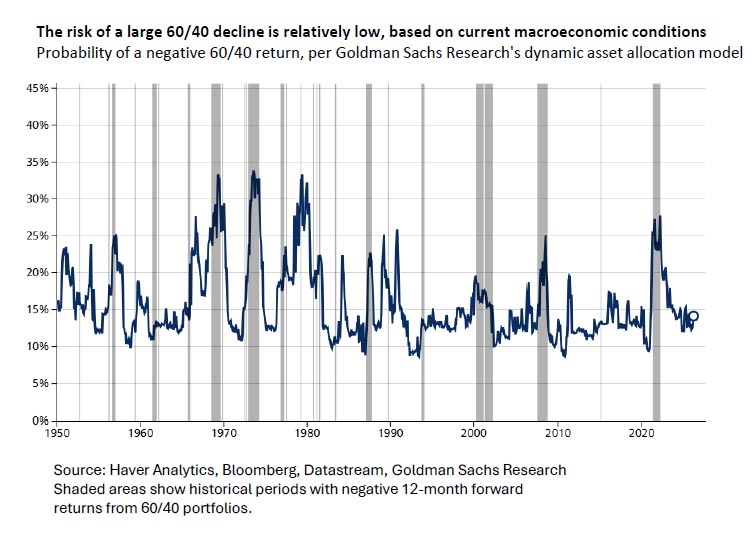
Our rule of thumb for optimal portfolio construction in the next decade is one third of assets exposed to innovation, one third protecting against inflation, and one third for risk mitigation.
In the innovation bucket, you’ll still have equities exposed to tech and AI, but investors need to be more selective with both more winners and losers due to AI disruption. In the inflation bucket, you’ll have real assets, maybe some gold and inflation-protected Treasuries, as well as some shorter-duration value stocks that have real cash flow growth potential (such as infrastructure stocks) that can counter inflation risk over the long run.
And in the risk-mitigation bucket you can have bonds, but there is more benefit from allocations to factors such as defensive equity styles (like low-volatility equities and quality equities), selective safe-haven foreign exchange and allocations to alternatives. The idea is to get the balance right across those categories so it’s not necessarily dependent on just the traditional asset class splits like 60/40.
Regards,
Benny Takin
Equities Trader
(benny.takin@jmpmarkets.com)
(+675 7001 9121/320 0240)
JMP Securities Limited
Level 3, ADF Haus, Musgrave Street
PO Box 2064
Papua New Guinea