
PNGX Equities • Fixed Income • Investor Education
Turnover surges to K25.99m
BSP and PLC dominate the tape
JMP Weekly Report | Week ending 4 September 2026
| TRADING VALUE K25.99m ×5.7 on prior week |
TOTAL VOLUME 7,391,421 ×7.8 on prior week |
STOCKS TRADED 6 of 10 BSP, KSL, STO, KAM, CPL, PLC |
MARKET YIELD (LTM) 5.31% −18 bps wow |
Download PDF >>
Weekly Trade Commentary
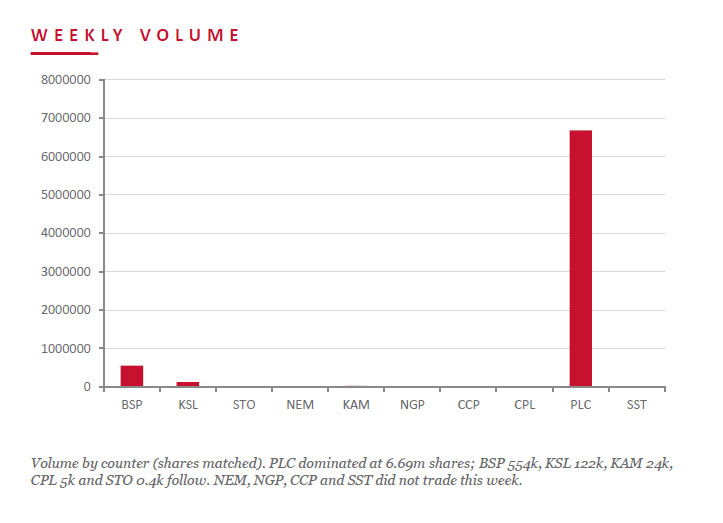
A blockbuster week — turnover surged to K25.99m on 7.39m shares, roughly 5.7× the value and 7.8× the volume of the prior week. BSP dominated on value at K15.47m, easing 5t to K27.95 on 553,611 shares, while PLC drove volume with a 6.69m-share block steady at K1.48 for K9.90m. KSL added 122,246 shares up 4t to K4.49, STO firmed 14t to K22.75 on 393 shares, and KAM traded 23,880 shares steady at K2.25. CPL added 5,000 shares. NEM, NGP, CCP and SST did not trade.
| Stock | Volume | Close (K) | Value (K) | Change | Change % |
|---|---|---|---|---|---|
| BSP | 553,611 | 27.95 | 15,473,965.20 | −0.05 | −0.18% |
| KSL | 122,246 | 4.49 | 548,884.54 | +0.04 | +0.90% |
| STO | 393 | 22.75 | 8,940.75 | +0.14 | +0.62% |
| NEM | — | 490.00 | — | — | — |
| KAM | 23,880 | 2.25 | 53,730.00 | — | — |
| NGP | — | 1.36 | — | — | — |
| CCP | — | 4.66 | — | — | — |
| CPL | 5,000 | 1.05 | 5,250.00 | — | — |
| PLC | 6,686,291 | 1.48 | 9,895,529.28 | — | — |
| SST | — | 50.00 | — | — | — |
| TOTAL | 7,391,421 | 25,986,299.77 | +0.48% |
Source: PNGX matched on-market trades, week ending 04 September 2026. JMP Securities analysis.
Dividend Yield
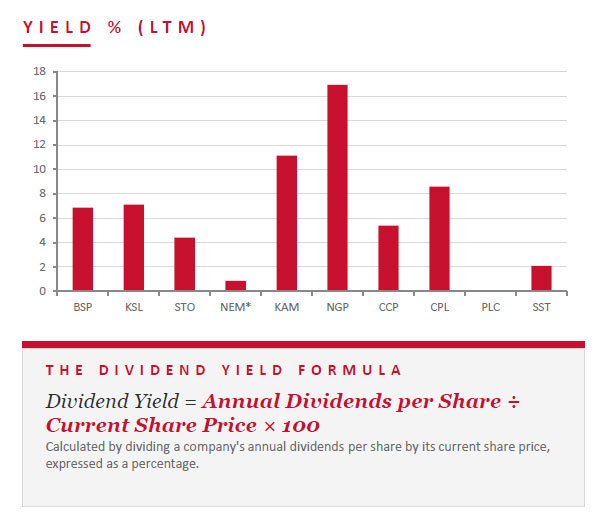
Market-wide LTM dividend yield eased to 4.73% this week (weighted by market cap, legacy methodology), down about 2 bps as BSP, KSL and STO firmed in price. On the report tables BSP carries a 6.87% LTM yield, KSL 7.10% and STO 4.40%. NGP (16.91%) still leads, with KAM (11.11%) and CPL (8.57%) next; CCP (5.39%) and STO (4.40%) follow, and SST sits at 2.10%. KSL, STO and SST each declared 2026 interim dividends this week. PLC remains pre-dividend.
| Stock | Issued Shares | Mkt Cap (K) | Int 24 | Fin 24 | Int 25 | Fin 25 | Yield |
|---|---|---|---|---|---|---|---|
| BSP | 467,317,665 | 13,061,528,737 | 0.450 | 1.210 | 0.500 | 1.380 | 6.87% |
| KSL | 294,332,296 | 1,321,552,009 | 0.106 | 0.155 | 0.126 | 0.193 | 7.10% |
| STO | 3,261,616,703 | 74,201,779,993 | 0.506 | 0.414 | 0.559 | 0.443 | 4.40% |
| NEM* | 1,097,000,000 | 537,530,000,000 | — | 2.110 | 2.110 | USD $0.520 | 0.86% |
| KAM | 53,259,588 | 119,834,073 | 0.200 | — | 0.250 | — | 11.11% |
| NGP | 45,890,700 | 62,411,352 | 0.040 | 0.120 | 0.040 | 0.190 | 16.91% |
| CCP | 307,931,332 | 1,434,960,007 | 0.120 | 0.121 | 0.121 | 0.130 | 5.39% |
| CPL | 206,277,911 | 216,591,807 | — | — | 0.050 | 0.040 | 8.57% |
| PLC | 860,718,662 | 1,273,863,620 | — | — | — | — | — |
| SST | 31,008,237 | 1,550,411,850 | 0.400 | 0.300 | 0.400 | 0.650 | 2.10% |
| TOTAL / WEIGHTED-AVG | 5.31% | ||||||
Key Market Announcements
A busy filings week dominated by dividends and STO. STO reported a significant milestone at its Pikka oil project — ramp-up to plateau production — alongside a dividend-distribution update and a Form 4 lifting its Papua LNG interest. KSL lodged (and amended) its Appendix 3A.1 dividend notice, SST notified a 2026 interim dividend, BSP filed Appendix 10B director and CEO interest changes, and NEM lodged a batch of Form 4/144 substantial-shareholding filings.
| Stock | Announcement |
|---|---|
| STO | Pikka oil project — significant milestone, ramp-up to plateau production – Click here >> |
| STO | Update — dividend distribution; Form 4, increased Papua LNG interest – Click here >> |
| KSL | Appendix 3A.1 — dividend distribution (amended, new record date) – Click here >> |
| SST | Notification of 2026 interim dividend distribution – Click here >> |
| BSP | Appendix 10B — change in director’s & CEO’s interest (Cooper, Robinson) – Click here >> |
| NEM | Form 4 / Form 144 — substantial shareholding & director filings – Click here >> |
BPNG Treasury Bill Auction
Auction: 02-SEP-26 / GOI / Government Treasury Bill | Settlement: 04-SEP-26 | Amount on offer: K270.0m
| Terms | Issue / 63 | Issue / 91 | Issue / 182 | Issue / 273 | Issue / 364 | Total |
|---|---|---|---|---|---|---|
| Weighted Avg Yield | — | — | 4.62% | 4.99% | 5.02% | — |
| Amount on Offer (K’m) | — | — | 20.00 | 50.00 | 200.00 | 270.00 |
| Bids Received (K’m) | — | — | 6.00 | 9.00 | 242.52 | 257.52 |
| Successful Bids (K’m) | — | — | 6.00 | 9.00 | 207.52 | 222.52 |
| Over / (Under) Subscribed (K’m) | — | — | −14.00 | −41.00 | +42.52 | −12.48 |
Source: Bank of Papua New Guinea — Domestic Markets Department, T-Bill auction 02 September 2026 (settlement 04 September 2026).
BPNG Government Bond Auction
NO NEW ISSUANCE — WEEK ENDING 4 SEPTEMBER 2026
Auction: 18-AUG-26 / GOB / Government Bond | Settlement: 21-AUG-26 | Amount on offer: K480.0m
| Series | Amount on Offer (K’m) | Bids Received (K’m) | Successful Bids (K’m) | Successful Yield | Weighted Avg Rate | Coupon Rate | Net Subscription (K’m) |
|---|---|---|---|---|---|---|---|
| Issue ID 2026/5057 — 3 yr | 50.00 | 60.00 | 50.00 | 6.10–6.27% | 6.26% | 6.30% | +10.00 |
| Issue ID 2026/5058 — 5 yr | 100.00 | 118.00 | 100.00 | 6.43–6.70% | 6.61% | 6.70% | +18.00 |
| Issue ID 2026/5059 — 7 yr | 80.00 | 85.00 | 80.00 | 6.73–6.80% | 6.76% | 6.80% | +5.00 |
| Issue ID 2026/5060 — 10 yr | 150.00 | 180.00 | 150.00 | 6.73–6.90% | 6.84% | 6.90% | +30.00 |
| Issue ID 2026/5061 — 15 yr | 100.00 | 120.00 | 50.00 | 7.13–7.30% | 7.26% | 7.30% | +20.00 |
| TOTAL | 480.00 | 563.00 | 480.00 | +83.00 |
Source: Bank of Papua New Guinea — Domestic Markets Department, GOB auction 18 August 2026 (settlement 21 August 2026).
Investor Education: Financial Modeling
A financial model is a structured, numbers-based representation of a real business, asset or transaction — used to forecast performance, test decisions and support judgment before capital is committed. In short, it is a spreadsheet that turns assumptions into forecasts, and forecasts into decisions: raw business drivers flow through the model’s logic into a forecast that decision-makers can act on.
Models drive the big decisions across finance. In valuation they estimate what a company, asset or deal is worth; in forecasting they project revenue, costs and cash flow under stated assumptions; in capital raising and M&A they structure financings, IPOs and mergers; and in budgeting they set targets and allocate capital. They show up in equity research, corporate finance, M&A and credit analysis alike.
Most models share an anatomy: assumptions (growth, margins, macro inputs, pricing and volume) drive the three financial statements — income statement, balance sheet and cash flow — which feed the outputs decision-makers actually use: valuation, scenarios and summary charts. Common builds include the 3-statement model, DCF valuation, M&A and LBO models, budget/forecast models and comparable-company analysis. Good practice separates inputs, calculations and outputs, colour-codes them, and stress-tests with scenarios rather than a single case.
| 01 | Valuation Estimate what a company, asset or deal is worth today — via DCF, comparable companies or precedent transactions. |
| 02 | Forecasting Project future revenue, costs and cash flow under a clear, documented set of assumptions. |
| 03 | Capital raising & M&A Structure financings, IPOs, mergers and buyouts, and test deal accretion or dilution before it is committed. |
| 04 | Budgeting & planning Set internal targets and allocate capital across the business over the planning horizon. |
What We’ve Been Reading

FEATURED READ
How much capital should a central bank hold?
IMF Blog • Romain Veyrune
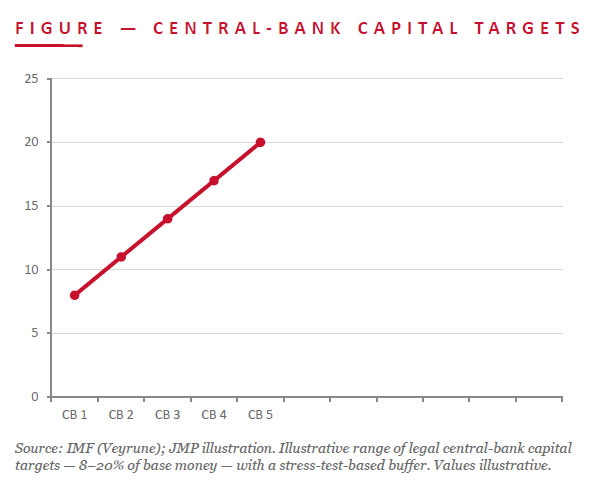
Unlike commercial banks, central banks have no universally prescribed minimum capital requirement. Yet a weak capital position can erode institutional credibility and independence, so central banks do care about buffers. Legal targets, where they exist, range from 8% to 20% of base money.
Large-scale asset purchases after the global financial crisis and pandemic increased balance-sheet risk. IMF staff propose stress-testing central banks across interest-rate, credit and FX risk to gauge the capital needed to absorb large but plausible shocks.
JMP read: For PNG the relevance is direct. A transparent, stress-test-based approach to central-bank capital would strengthen policy credibility and independence, reinforce confidence in the kina, and support the rate and currency backdrop for PNGX issuers.
For Further Enquiries
Speak to your equities trader for any orders, research questions or market colour.
Benny Takin
Equities Trader – Primary contact, JMP Weekly Report
benny.takin@jmpmarkets.com
+675 7001 9121 / 320 0240
JMP Securities Limited
Level 3, ADF Haus, Musgrave Street
PO Box 2064, Port Moresby NCD, Papua New Guinea
Disclaimer
This report has been prepared by JMP Securities Limited (Capital Market Licence holder, Securities Commission of PNG). It is general information only and does not take into account the objectives, financial situation or needs of any particular person. It is not an offer or solicitation to buy or sell any security. Information is sourced from PNGX, Bank of Papua New Guinea and external publications cited herein, with JMP analysis. While reasonable care has been taken, no warranty is given as to accuracy or completeness; to the maximum extent permitted by law JMP accepts no liability for loss arising from reliance on this material. Investors should obtain independent professional advice before making any investment decision.