
PNGX Equities • Fixed Income • Investor Education
A very thin week; turnover collapses to K0.47m
JMP Weekly Report | Week ending 7 August 2026
|
Trading Value
K0.47m
−93% on prior week
|
Total Volume
81,973
−93% on prior week
|
Stocks Traded
7 of 10
BSP, KSL, STO, KAM, NGP, CCP, PLC
|
Market Yield (LTM)
5.47%
−3 bps week on week
|
Download PDF >>
Weekly Trade Commentary
An exceptionally quiet week — total turnover collapsed to just K0.47m on 81,973 shares, both down about 93% from last week, though seven counters managed small trades. KSL was the most active by value at 54,238 shares, off 15t (−3.3%) to K4.42 for K0.24m. CCP traded 21,555 shares steady at K4.66; STO firmed to K22.55 on 527 shares, and NGP added 2,940 shares at K1.36. BSP (713 shares), KAM (500) and PLC (1,500) traded only token volumes. NEM, CPL and SST sat out.
| Stock | Volume | Close (K) | Value (K) | Change | Change % |
|---|---|---|---|---|---|
| BSP | 713 | 28.20 | 20,106.60 | — | — |
| KSL | 54,238 | 4.42 | 241,780.21 | −0.15 | −3.28% |
| STO | 527 | 22.55 | 11,883.85 | +0.05 | +0.22% |
| NEM | — | 490.00 | — | — | — |
| KAM | 500 | 2.21 | 1,105.00 | — | — |
| NGP | 2,940 | 1.36 | 3,998.40 | — | — |
| CCP | 21,555 | 4.66 | 100,446.30 | — | — |
| CPL | — | 1.05 | — | — | — |
| PLC | 1,500 | 1.48 | 2,220.00 | — | — |
| SST | — | 50.00 | — | — | — |
| TOTAL | 81,973 | 466,751.43 | +0.13% |
Source: PNGX matched on-market trades, week ending 7 August 2026. JMP Securities analysis.
JMP WEEKLY REPORT DTD 10.08.26 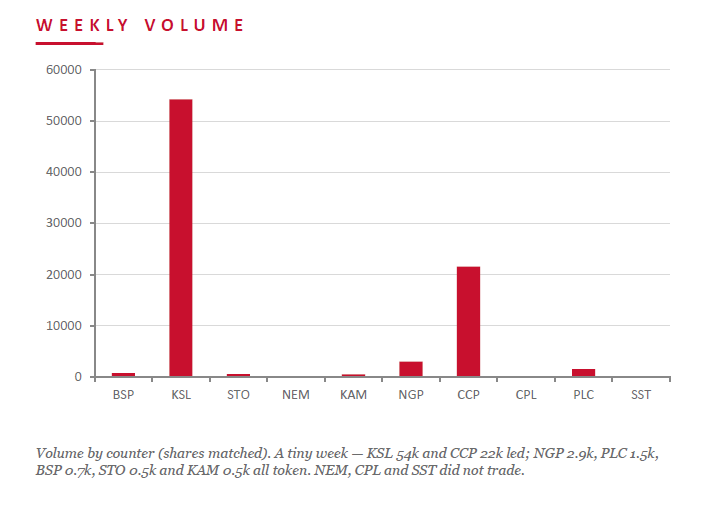
Dividend Yield
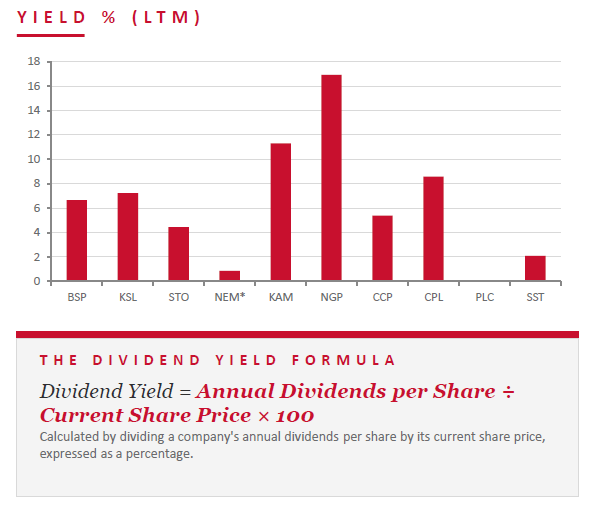
Market-wide LTM dividend yield eased to 4.74% this week (weighted by market cap, legacy methodology), down about 3 bps as STO — the dominant weight — firmed to K22.55, trimming its yield to 4.44%. KSL’s yield rose to 7.22% as it fell to K4.42. NGP (16.91%) still leads, with KAM (11.31%) and CPL (8.57%) next. KSL (7.22%), BSP (6.67%), CCP (5.39%) and STO (4.44%) follow, with SST at 2.10%. PLC remains pre-dividend.
| Stock | Issued Shares | Market Cap (K) | Int 24 | Fin 24 | Int 25 | Fin 25 | Yield |
|---|---|---|---|---|---|---|---|
| BSP | 467,317,665 | 13,178,358,153 | 0.450 | 1.210 | 0.500 | 1.380 | 6.67% |
| KSL | 294,332,296 | 1,300,948,748 | 0.106 | 0.155 | 0.126 | 0.193 | 7.22% |
| STO | 3,261,616,703 | 73,549,456,653 | 0.506 | 0.414 | 0.559 | 0.443 | 4.44% |
| NEM* | 1,097,000,000 | 537,530,000,000 | — | 2.110 | 2.110 | USD $0.520 | 0.86% |
| KAM | 53,259,588 | 117,703,689 | 0.200 | — | 0.250 | — | 11.31% |
| NGP | 45,890,700 | 62,411,352 | 0.040 | 0.120 | 0.040 | 0.190 | 16.91% |
| CCP | 307,931,332 | 1,434,960,007 | 0.120 | 0.121 | 0.121 | 0.130 | 5.39% |
| CPL | 206,277,911 | 216,591,807 | — | — | 0.050 | 0.040 | 8.57% |
| PLC | 860,718,662 | 1,273,863,620 | — | — | — | — | — |
| SST | 31,008,237 | 1,550,411,850 | 0.400 | 0.300 | 0.400 | 0.650 | 2.10% |
| TOTAL / WEIGHTED AVERAGE | 5.47% | ||||||
LTM = Last twelve months. Yields use most recently declared interim and final dividends. NEM dividends in USD until PGK rate announced; NEM excluded from market-wide yield. PLC now added.
Key Market Announcements
Three filers this week, headlined by results calendars. BSP notified the market of its 2026 Half-Year Results Investor Briefing, PLC lodged its Quarterly Activities and Cash Flow Report, and Niuminco (NIU) filed a batch of June and March 2026 quarterly reports. NIU sits outside the ten-stock coverage universe and is shown for completeness.
| Stock | Announcement |
|---|---|
| BSP | 2026 Half-Year Results — Investor Briefing Notification Click here >> |
| PLC | Quarterly Activities and Cash Flow Report Click here >> |
| NIU | June & March 2026 Quarterly Reports (Activities + Appendix 5A) Click here >> |
Source: PNGX market announcements, 03–07 August 2026.
BPNG Treasury Bill Auction
Auction: 5 August 2026 | Settlement: 7 August 2026 | Amount on offer: K270.0 million
| Terms | 63 days | 91 days | 182 days | 273 days | 364 days | Total |
|---|---|---|---|---|---|---|
| Weighted Average Yield | — | — | 4.84% | 5.04% | 5.04% | — |
| Amount on Offer (K’m) | — | — | 20.00 | 50.00 | 200.00 | 270.00 |
| Bids Received (K’m) | — | — | 15.74 | 95.26 | 300.65 | 411.65 |
| Successful Bids (K’m) | — | — | 15.74 | 45.26 | 80.65 | 141.65 |
| Over / (Under) Subscribed (K’m) | — | — | −4.26 | +45.26 | +100.65 | +141.65 |
BPNG Government Bond Auction
No new Government Bond auction was held during the week ending 7 August 2026. The most recent auction was held on 21 July 2026, with settlement on 24 July 2026. K300.0 million was offered, with bids received totalling K325.00 million and successful bids of K305.00 million, resulting in a net subscription of K25.00 million.
| Series | Offer (K’m) | Bids (K’m) | Successful (K’m) | Successful Yield | Weighted Avg | Coupon | Net Subscription (K’m) |
|---|---|---|---|---|---|---|---|
| 2026/5057 – 3 yr | 50.00 | 65.00 | 55.00 | 6.11–6.17% | 6.12% | 6.40% | +15.00 |
| 2026/5058 – 5 yr | 50.00 | 50.00 | 50.00 | 6.43–6.43% | 6.43% | 6.80% | 0.00 |
| 2026/5059 – 7 yr | 50.00 | 60.00 | 50.00 | 6.59–6.59% | 6.59% | 6.90% | +10.00 |
| 2026/5060 – 10 yr | 100.00 | 100.00 | 100.00 | 6.73–6.73% | 6.73% | 7.10% | 0.00 |
| 2026/5061 – 15 yr | 50.00 | 50.00 | 50.00 | 7.13–7.13% | 7.13% | 7.40% | 0.00 |
| TOTAL | 300.00 | 325.00 | 305.00 | +25.00 | |||
Investor Education: Buy-Side vs Sell-Side
A buy-side institution deploys capital to purchase and hold securities as an investor — rather than selling securities or services to clients. Buy-side firms including fund managers, hedge funds, pension funds, insurers and sovereign wealth funds own or manage the capital that flows into markets and are judged on portfolio returns, not transaction volume.
The sell-side sits on the other side of the trade: brokers, investment banks and market makers — JMP’s role on PNGX and ASX — providing research, execution and liquidity for commissions, spreads and advisory fees. The buy-side is, in effect, the sell-side’s client: research notes, roadshows and trade ideas are built to win and retain buy-side order flow.
| 01 | Asset managers Run pooled mutual funds and unit trusts for retail and institutional clients — the largest and most familiar slice of the buy-side. |
| 02 | Hedge funds Active, often leveraged strategies across asset classes and derivatives, aiming for absolute returns rather than tracking a benchmark. |
| 03 | Pension funds & insurers Long-horizon, conservative investors matching assets to future liabilities — retiree payouts for pensions, policyholder claims for insurers. |
| 04 | SWFs & private equity Sovereign wealth funds invest national reserves or resource surpluses for public benefit; private equity and VC take direct stakes in private companies rather than public securities. |
What We’ve Been Reading
Featured Read
What are commodities? Civilisation’s raw materials, and its fault lines
IMF F&D Magazine • Jean-Marc Natal
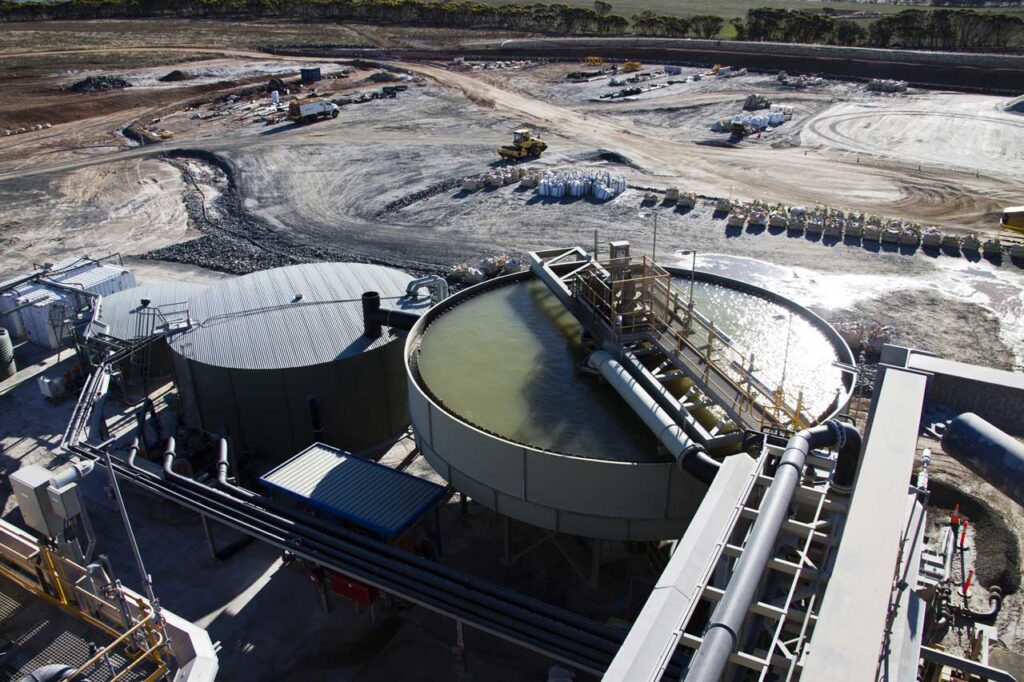
Commodities are the raw material of civilisation — oil, copper, iron and gold (hard) and wheat, coffee, cotton and cocoa (soft). Their defining feature is that they are uniform and interchangeable, which lets them trade seamlessly on global markets; the phone in your hand contains about 42 minerals, from Congolese cobalt to Australian iron ore. Because they are essential yet unevenly distributed, commodities have always been both an economic opportunity and a geopolitical vulnerability.
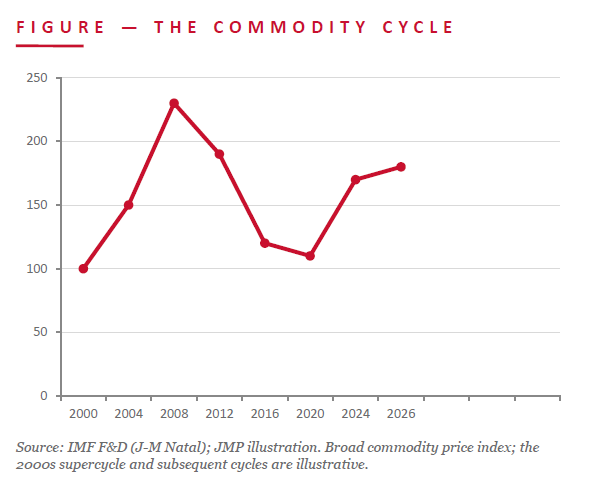
Markets brought order to volatile prices. The Chicago Board of Trade (1848) created the first standardised futures marketplace; NYMEX, the LME and others followed. But as markets matured, trading shifted from the physical goods to the contracts tied to them — futures, options and derivatives became assets in their own right, attracting speculators and leverage. Prices stay volatile because supply is slow to adjust and demand is hard to substitute.
JMP read: This one sits close to PNG’s core. As an exporter of gold, copper, LNG and agricultural soft commodities, PNG is on the supply side of exactly the dynamics the article describes — and the critical-minerals scramble (lithium, cobalt, rare earths, plus copper for electrification) is reshaping who holds strategic leverage. For a resource economy, commodity wealth is as much about geopolitics, contracts and price-risk management as what is in the ground.
For Further Enquiries
Speak to your equities trader for orders, research questions or market colour.
Benny Takin
Equities Trader – Primary contact, JMP Weekly Report
benny.takin@jmpmarkets.com
+675 7001 9121 / 320 0240
Disclaimer
This report has been prepared by JMP Securities Limited (Capital Market Licence holder, Securities Commission of PNG). It is general information only and does not take into account the objectives, financial situation or needs of any particular person. It is not an offer or solicitation to buy or sell any security. Information is sourced from PNGX, Bank of Papua New Guinea and external publications cited herein, with JMP analysis. While reasonable care has been taken, no warranty is given as to accuracy or completeness; to the maximum extent permitted by law JMP accepts no liability for loss arising from reliance on this material. Investors should obtain independent professional advice before making any investment decision.