
PNGX Equities • Fixed Income • Investor Education
Turnover falls back to K3.35m
Six counters trade a quiet week
JMP Weekly Report | Week ending 11 September 2026
| TRADING VALUE K3.35m −87% on prior week |
TOTAL VOLUME 238,422 −97% on prior week |
STOCKS TRADED 6 of 10 BSP, KSL, STO, KAM, CCP, CPL |
MARKET YIELD (LTM) 5.31% flat wow |
Download PDF >>
Weekly Trade Commentary
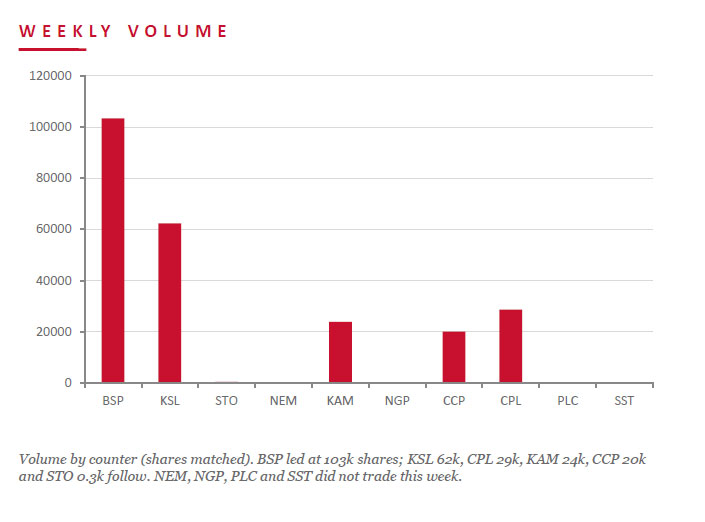
A quiet week after the blockbuster — turnover fell back to K3.35m on 238,422 shares as six counters traded and the big blocks disappeared. BSP led on value at K2.89m, steady at K27.95 on 103,398 shares. KSL traded 62,293 shares, easing 5t to K4.44, and CCP returned with 20,000 shares steady at K4.66. CPL added 28,605 shares at K1.05, KAM 23,812 at K2.25, and STO just 314 shares at K22.75. NEM, NGP, PLC and SST did not trade.
| Stock | Volume | Close (K) | Value (K) | Change | Change % |
|---|---|---|---|---|---|
| BSP | 103,398 | 27.95 | 2,890,394.72 | — | — |
| KSL | 62,293 | 4.44 | 276,546.70 | −0.05 | −1.11% |
| STO | 314 | 22.75 | 7,143.50 | — | — |
| NEM | — | 490.00 | — | — | — |
| KAM | 23,812 | 2.25 | 53,577.00 | — | — |
| NGP | — | 1.36 | — | — | — |
| CCP | 20,000 | 4.66 | 93,200.00 | — | — |
| CPL | 28,605 | 1.05 | 30,035.25 | — | — |
| PLC | — | 1.48 | — | — | — |
| SST | — | 50.00 | — | — | — |
| TOTAL | 238,422 | 3,350,897.17 | 0.00% |
Source: PNGX matched on-market trades, week ending 11 September 2026. JMP Securities analysis.
Dividend Yield
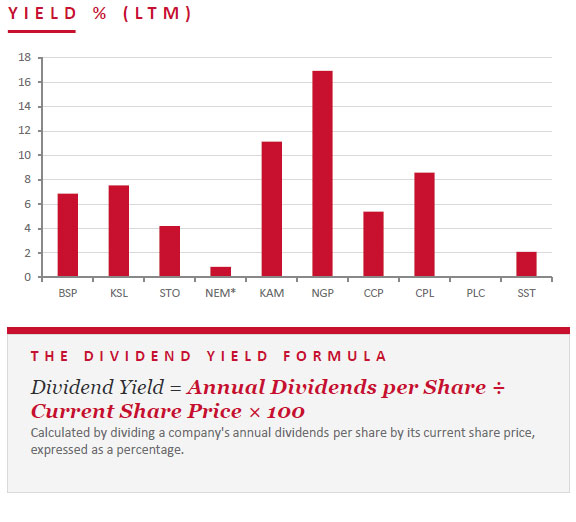
Market-wide LTM dividend yield held steady at 4.58% this week (weighted by market cap, legacy methodology). The report tables now fully roll the 2026 interim dividends into LTM — KSL to 7.55%, STO to 4.21%, BSP at 6.87% — resolving last week’s basis divergence; like-for-like the yield is essentially flat. NGP (16.91%) leads, then KAM (11.11%), CPL (8.57%), CCP (5.39%), STO (4.21%) and SST (2.10%). PLC remains pre-dividend.
| Stock | Issued Shares | Mkt Cap (K) | Int 24 | Fin 24 | Int 25 | Fin 25 | Yield |
|---|---|---|---|---|---|---|---|
| BSP | 467,317,665 | 13,061,528,737 | 0.450 | 1.210 | 0.500 | 1.380 | 6.87% |
| KSL | 294,332,296 | 1,306,835,394 | 0.106 | 0.155 | 0.126 | 0.193 | 7.55% |
| STO | 3,261,616,703 | 74,201,779,993 | 0.506 | 0.414 | 0.559 | 0.443 | 4.21% |
| NEM* | 1,097,000,000 | 537,530,000,000 | — | 2.110 | 2.110 | USD $0.520 | 0.86% |
| KAM | 53,259,588 | 119,834,073 | 0.200 | — | 0.250 | — | 11.11% |
| NGP | 45,890,700 | 62,411,352 | 0.040 | 0.120 | 0.040 | 0.190 | 16.91% |
| CCP | 307,931,332 | 1,434,960,007 | 0.120 | 0.121 | 0.121 | 0.130 | 5.39% |
| CPL | 206,277,911 | 216,591,807 | — | — | 0.050 | 0.040 | 8.57% |
| PLC | 860,718,662 | 1,273,863,620 | — | — | — | — | — |
| SST | 31,008,237 | 1,550,411,850 | 0.400 | 0.300 | 0.400 | 0.650 | 2.10% |
| TOTAL / WEIGHTED-AVG | 5.31% | ||||||
LTM = Last twelve months. Yields use most recently declared interim and final dividends. NEM dividends in USD until PGK rate announced; NEM excluded from market-wide yield. PLC now added.
Key Market Announcements
A busy corporate week led by KAM’s results. KAM released its Half-Year 2026 results — with Appendix 5B, interim financials and an NTA update. STO increased its interest in Papua LNG, CPL signed an MOU with Apollo, and BSP announced a landmark NRL sponsorship of the PNG Chiefs. KSL lodged a revised Appendix 3A.1 dividend notice and PLC filed an Appendix 2A application for quotation of securities.
| Stock | Announcement | Source |
|---|---|---|
| KAM | Half-Year 2026 Results (Appendix 5B, interim financials) & NTA at 31 Aug | PNGX |
| STO | Santos increases interest in Papua LNG | PNGX |
| CPL | MOU with Apollo | PNGX |
| BSP | BSP & PNG Chiefs landmark NRL sponsorship deal | PNGX |
| KSL | Revised Appendix 3A.1 (dividend distribution) | PNGX |
| PLC | Appendix 2A — application for quotation of securities | PNGX |
Source: PNGX market announcements, 07 – 11 September 2026.
BPNG Treasury Bill Auction
Auction: 09-SEP-26 / GOI / Government Treasury Bill | Settlement: 11-SEP-26 | Amount on offer: K270.0m
| Terms | Issue / 63 | Issue / 91 | Issue / 182 | Issue / 273 | Issue / 364 | Total |
|---|---|---|---|---|---|---|
| Weighted Avg Yield | — | — | 4.64% | 5.00% | 5.03% | |
| Amount on Offer (K’m) | — | — | 20.00 | 50.00 | 200.00 | 270.00 |
| Bids Received (K’m) | — | — | 15.82 | 32.30 | 275.79 | 323.91 |
| Successful Bids (K’m) | — | — | 15.82 | 32.30 | 245.79 | 293.91 |
| Over / (Under) Subscribed (K’m) | — | — | −4.18 | −17.70 | +75.79 | +53.91 |
Source: Bank of Papua New Guinea — Domestic Markets Department, T-Bill auction 09 September 2026 (settlement 11 September 2026).
BPNG Government Bond Auction
NO NEW ISSUANCE — WEEK ENDING 11 SEPTEMBER 2026
Auction: 18-AUG-26 / GOB / Government Bond | Settlement: 21-AUG-26 | Amount on offer: K480.0m
| Series | Amount on Offer (K’m) | Bids Received (K’m) | Successful Bids (K’m) | Successful Yield | Weighted Avg Rate | Coupon Rate | Net Subscription (K’m) |
|---|---|---|---|---|---|---|---|
| Issue ID 2026/5057 — 3 yr | 50.00 | 60.00 | 50.00 | 6.10–6.27% | 6.26% | 6.30% | +10.00 |
| Issue ID 2026/5058 — 5 yr | 100.00 | 118.00 | 100.00 | 6.43–6.70% | 6.61% | 6.70% | +18.00 |
| Issue ID 2026/5059 — 7 yr | 80.00 | 85.00 | 80.00 | 6.73–6.80% | 6.76% | 6.80% | +5.00 |
| Issue ID 2026/5060 — 10 yr | 150.00 | 180.00 | 150.00 | 6.73–6.90% | 6.84% | 6.90% | +30.00 |
| Issue ID 2026/5061 — 15 yr | 100.00 | 120.00 | 50.00 | 7.13–7.30% | 7.26% | 7.30% | +20.00 |
| TOTAL | 480.00 | 563.00 | 480.00 | +83.00 |
Source: Bank of Papua New Guinea — Domestic Markets Department, GOB auction 18 August 2026 (settlement 21 August 2026).
Investor Education: The OTC Market
The over-the-counter (OTC) market is a decentralised marketplace where securities are traded directly between two parties, without a central exchange floor or order book. Trading runs through a network of dealers who quote prices and take the other side of client trades. Commonly traded OTC: unlisted and small-cap equities, corporate and government bonds, currencies and interest-rate swaps, and forwards, options and structured products.
OTC markets work through four core dealer functions. First, price discovery: with no central order book, dealers continuously quote bid and ask prices — built from their inventory, client flow and market conditions — establishing fair value for instruments that don’t trade on an exchange. Second, liquidity provision: dealers commit their own capital and hold inventory, standing ready to buy or sell even when a natural counterparty isn’t immediately available.
Third, market access and capital formation: the OTC market gives smaller companies, newer debt issues and non-standard instruments access that listed exchanges don’t always provide, widening the pool of capital for issuers and the range of exposures for investors. Fourth, flexibility: because trades are negotiated bilaterally, counterparties can tailor size, maturity and settlement to their exact needs — something standardised exchange contracts cannot. The trade-off is lower price transparency and direct counterparty (rather than central-clearing) risk.
| 01 | Price discovery & quotation With no central order book, dealers continuously quote two-way bid/ask prices — a reference value even for infrequently-traded or unlisted instruments. |
| 02 | Liquidity provision Dealers commit capital and hold inventory, standing ready to trade even when a natural counterparty isn’t immediately available. |
| 03 | Market access & capital formation Gives smaller issuers, new debt and non-standard instruments a venue that exchanges don’t always provide, widening access to capital. |
| 04 | Flexibility & customisation Bilaterally negotiated trades let counterparties tailor size, maturity and settlement — at the cost of lower transparency and direct counterparty risk. |
What We’ve Been Reading

Featured Read
US–China borrowing costs diverge to a record
Financial Times • William Sandlund
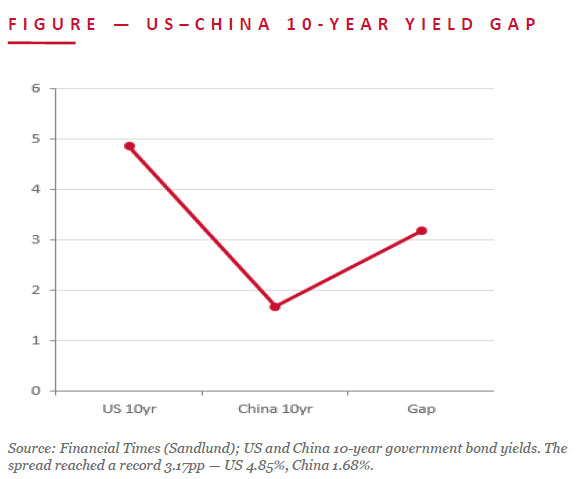
The gap between benchmark borrowing costs in the US and China has reached its widest ever — a record 3.17 percentage points. The 10-year US Treasury yield climbed to 4.85%, its highest since 2023, while the 10-year Chinese government bond yield sat at just 1.68%. The two economies face opposite forces: US yields are rising on worries about the growing federal debt pile and expectations the Fed may have to raise rates against inflation (a disappointing Treasury buyback plan added to the sell-off), while Chinese yields grind lower amid weak credit demand and deflationary pressure from slowing growth.
Higher Treasury yields — and lower US bond prices — threaten to accelerate capital flows out of China, which Beijing is working to contain. Cheap onshore yields have driven an explosion in offshore renminbi borrowing as multinationals and foreign governments lock in low rates, aiding China’s push to internationalize its currency; but the widening rate differential pulls the other way. Authorities have tightened tax collection on overseas capital gains, scrutinized offshore insurance and brokerage channels, and raised the quota for domestic institutions to invest abroad — steering outflows into supervised channels rather than unofficial ones.
JMP read: For PNG the signal is in the backdrop, not the direct exposure. A 4.85% US 10-year resets the global cost of capital and the dollar’s pull on emerging-market flows and currencies — including the kina — while firmer US rates and a stronger dollar tighten financial conditions for commodity exporters. China’s disinflation and soft demand, meanwhile, weigh on the metals and energy that anchor PNG’s export receipts. The widest-ever US–China spread is a reminder that PNGX issuers trade inside a global rate and FX cycle set well beyond Port Moresby.
Also on our desk
- The US–China 10-year yield gap hit a record 3.17 percentage points — Financial Times
- US 10-year at 4.85% (highest since 2023) vs China’s 1.68%, on opposite inflation paths — Financial Times
- A wider gap threatens to accelerate capital outflows from China, which Beijing is moving to contain — Financial Times
For Further Enquiries
Speak to your equities trader for any orders, research questions or market colour.
Benny Takin
Equities Trader — Primary contact, JMP Weekly Report
benny.takin@jmpmarkets.com
+675 7001 9121 / 320 0240
JMP Securities Limited
Level 3, ADF Haus, Musgrave Street
PO Box 2064, Port Moresby NCD, Papua New Guinea
What this report covered this week
- Weekly trade activity — 6 stocks traded, K3.35m value (−87% pw)
- Dividend yields — market-wide LTM 5.31% (flat; 2026 interims now rolled into LTM)
- Busy filings week — KAM HY results, STO Papua LNG, CPL–Apollo MOU, BSP NRL deal
- BPNG T-Bill auction — over-subscribed by K53.91m
- BPNG bond auction — most recent (no new issuance this week)
- Investor Education — The OTC Market
- External research — FT on the record US–China yield gap
Disclaimer
This report has been prepared by JMP Securities Limited (Capital Market Licence holder, Securities Commission of PNG). It is general information only and does not take into account the objectives, financial situation or needs of any particular person. It is not an offer or solicitation to buy or sell any security. Information is sourced from PNGX, Bank of Papua New Guinea and external publications cited herein, with JMP analysis. While reasonable care has been taken, no warranty is given as to accuracy or completeness; to the maximum extent permitted by law JMP accepts no liability for loss arising from reliance on this material. Investors should obtain independent professional advice before making any investment decision.