24 April, 2023
Welcome to this week’s JMP Report
Before we deep dive into this week’s report, JMP, like many businesses have been experiencing issues relating to the PNGX Trading Platform and issues with the new BSP Banking Platform. On behalf of JMP Management we would like to thank our clients for being so patient and understanding.
Last week saw 3 stocks trade on the PNGX, BSP, STO and KAM. BSP trading 82,371shares, closing 18t higher at K12.80. STO traded 1,017, to close 2 t higher at 19.10 and KAM traded 3,403 shares, closing steady at K0.95.
WEEKLY MARKET REPORT | 17 April, 2023 – 21 April, 2023
| STOCK | QUANTITY | CLOSING PRICE | CHANGE | % CHANGE | 2021 FINAL DIV | 2021 INTERIM | YIELD % | EX-DATE | RECORD DATE | PAYMENT DATE | DRP | MARKET CAP |
| BSP | 82.371 | 12.60 | 0.18 | 1.41 | K1.4000 | – | 13.53 | THUR 9 MAR 2023 | FRI 10 MAR 2023 | FRI 21 APR 2023 | NO | 5,317,971,001 |
| KSL | 0 | 2.48 | – | – | K0.1610 | – | 9.93 | FRI 3 MAR 2023 | MON 6 MAR 2023 | TUE 11 APR 2023 | NO | 64,817,259 |
| STO | 1,017 | 19.10 | 0.02 | 0.10 | K0.5310 | – | 2.96 | MON 27 FEB 2023 | TUE 28 FEB 2023 | WED 29 MAR 2023 | YES | – |
| KAM | 3,403 | 0.95 | – | – | – | – | – | – | – | – | YES | 49,891,306 |
| NCM | 0 | 74.00 | – | – | USD$1.23 | – | – | FRI 24 FEB 2023 | MON 27 FEB 23 | THU 30 MAR 23 | YES | 33,774,150 |
| NGP | 0 | 0.69 | – | – | – | – | – | – | – | – | – | 32,123,490 |
| CCP | 0 | 2.00 | – | – | K0.225 | – | 6.19 | FRI 24 MAR 2023 | WED 29 MAR 2023 | FRI 5 MAY 2023 | YES | 569,672,964 |
| CPL | 0 | 0.95 | – | – | K0.05 | – |
4.20 |
WED 22 MAR 2023 | THUR 30 MAR 2023 | THU 30 JUL 2023 | – | 195,964,015 |
On the dual listed stock – PNGX/ASX
BFL -$4.86 +2c
KSL – .75 +1c
NCM – -28.90 -38c
STO – 7.16 -31c
Our order book has us net buyers of BSP, STO and KSL.
Alternatives
Gold – 1982
Palladium 1606
Platinum 1128
Silver – 25
Bitcoin – 27510
Ethereum – 1859
PAXGold – 1983
Interest Rate Market
There was a little weakening in 364 TBill market with this week’s auction average coming in at 3.06%. The bank initially had 78million on offer but the Bank met the market bid volume and issued 252mill.
On the GIS auction, due to the Public Holiday, last weeks auction has been deferred to this week. We will bring you the results later in the week.
FIFL depo rates range from 1% for the 30days, out to 2.1% in the 1yr.
What we’ve been reading this week
Oliver’s insights – investment outlook Q&A
inflation, interest rates, recession, the US debt ceiling, geopolitics, house prices and other issues
Dr Shane Oliver – Head of Investment Strategy and Economics and Chief Economist, AMP Investments
Key points
– Inflation is likely to have peaked and this means that central banks are either at or close to the top on rates.
– The risk of recession has increased but should be avoided in Australia, providing the RBA is at or near the top on rates.
– Geopolitical risk remains high and US debt ceiling brinkmanship is likely to return in the September quarter.
– Our base case is that Australian home prices still have more downside, but a shortage of property is again worsening home buyer and rental affordability and making the property market very hard to read.
Introduction
Investment markets continue to be buffeted by multiple uncertainties, but so far returns this year have been okay as shares have climbed the “wall of worry”. This note takes a look at the main questions investors commonly have in a simple Q & A format.
Have we seen the peak in inflation?
Inflation is still too high but it looks to have peaked. US inflation led on the way up and it looks to be leading on the way down. It has fallen to 5%yoy from a high of 9.1% in mid last year. Supply bottlenecks have improved, freight costs have fallen and slowing demand is reducing demand side inflation. While core services inflation excluding shelter remains sticky it is starting to slow, shelter (or rent) inflation also looks to have peaked and our US Pipeline Inflation Indicator continues to point to lower inflation.
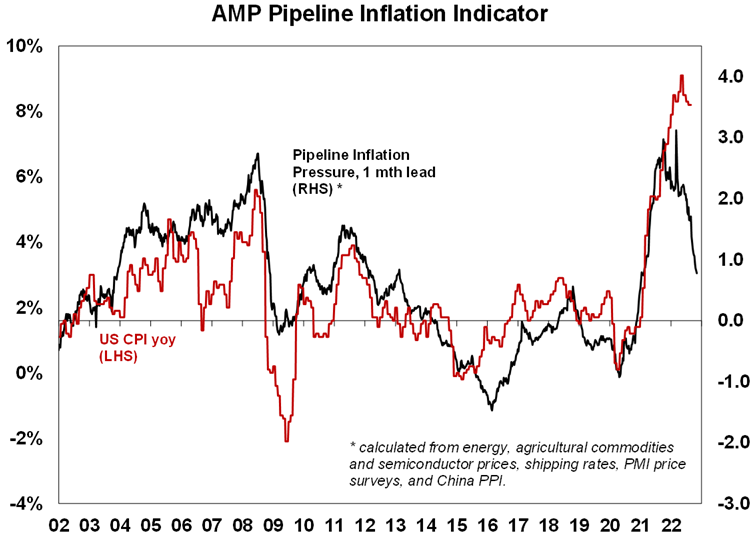 Source: Bloomberg, AMP
In Australia, inflation is lagging the US by about six months and looks to have peaked in the December quarter. There is likely more upside in electricity prices and rents, and based on the US experience underlying measures of inflation may take a bit longer to peak. However, the ABS’ Monthly CPI Indicator fell back to 6.8%yoy in February from a high of 8.4% in December and our Australian Pipeline Inflation indicator points to a further fall in inflation ahead.
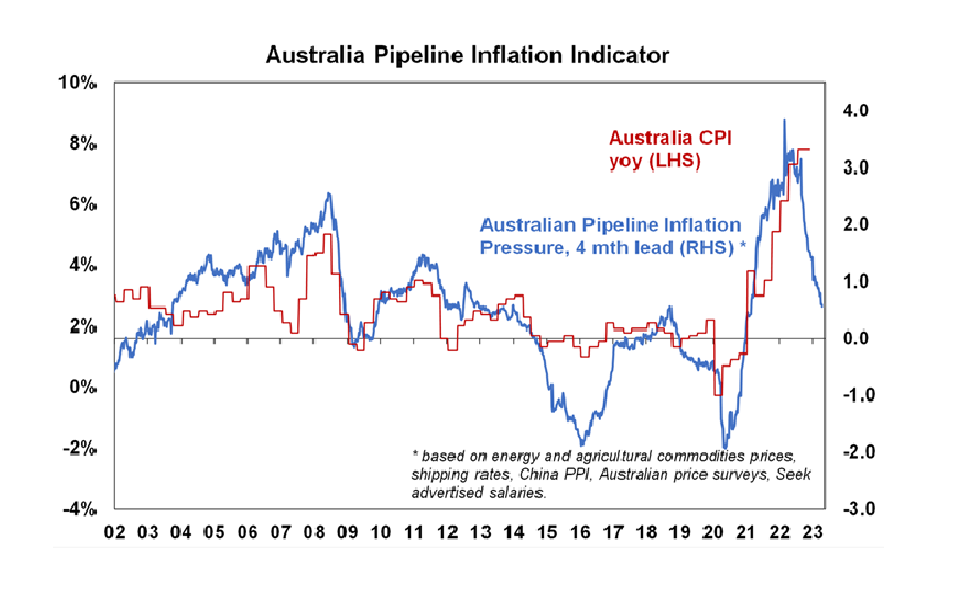 Source: Bloomberg, AMP
What impact will US banking strains have?
Quick action by US and Swiss authorities have settled the banking problems seen in March. However, the banking strains likely have further to run as tighter monetary policy impacts borrowers & hence the quality of loans and the banking strains look to have increased bank funding costs and pressure on margins and appears to be resulting in tighter lending standards. Estimates of its impact by the Fed range from being equivalent to 0.25%-1.5% of Fed rate hikes. So it should take pressure off the Fed.
Are central banks nearly done?
The combination of easing inflation pressures, the defacto monetary tightening flowing from banking strains in the US and Europe and increasing evidence of cooling economies and labour markets suggests that major central banks are at or close to the top on interest rates:
- Several central banks have paused monetary policy tightening in the last month or so – including the RBA, Bank of Canada, Bank of Korea and the Singapore Monetary Authority.
- The ECB has continued to tighten but has softened its tightening bias.
- The sticky core US inflation evident in March likely leans the Fed towards one last 0.25% rate hike at its May meeting. But with falling job openings, a mixed jobs report for March, rising jobless claims the minutes from the last Fed meeting indicating that the Fed’s staff expect bank stress to contribute to a “mild recession” it’s a close call.
- In Australia, with the labour market being a lagging indicator and economic growth and inflation likely to continue to slow our view is that we are either at or very close to the peak in rates ahead of cuts later this year or early next. Another hike in May is still a very high risk though – as still strong jobs data has added to the risk of a wages breakout and the upswing in the property market if sustained could reverse the negative wealth effect from lower home prices. March quarter inflation data will be watched closely.
What is the risk of recession?
While the risk of recession has receded in Europe (with lower gas prices) it remains high in the US with various leading indicators – including inverted yield curves (where short term interest rates are above longer term yields) – warning of a high risk of US recession in the next 6-12 months. Over the last 50 years all US recessions have been preceded by inverted yield curves as is the case now – but the lag can be up to 18 months and it can give false signals. However, if the Fed soon stops tightening a US recession could still be averted or it could be mild which would limit further downside in US shares. In Australia, the risk of recession is high. But our base case is that it will be avoided thanks to strong business investment, Chinese reopening and providing the RBA soon stops hiking. Economic growth will still slow to a crawl this year though.
Have geopolitical threats faded?
These have increased in recent years with the loss of global faith in liberal democracy and relative decline of US giving rise to a multipolar world. So far this year geopolitical issues have not had a major impact on markets, helped by the absence of significant elections in major countries and the stalemate in Ukraine. But risks remain around China and Taiwan, Iran’s progress towards nuclear weapons, Russia/Ukraine and the possible return of Trump in next year’s US election.
How big a problem is the US debt ceiling?
The US Congress imposes a ceiling on Government debt that needs to be raised every so often given its ongoing budget deficit. If it’s not raised once reached spending would have to be slashed back to the level of revenue – leading to a 5% or so hit to GDP and talk of default on its commitments. As we saw in 2011 and 2013 raising it can lead to brinkmanship as fiscally conservative Republicans seek to reduce the budget deficit and as always Washington leaves things to the last minute to resolve. Back then it was resolved but only in the nick of time and after investment markets fell sharply. The process then caused damage to Republican’s political standing so in subsequent years it was resolved relatively smoothly. However, with Republican’s regaining control of the House of Representatives and demanding a commitment to spending cuts it looks like it will be an issue again this year. The US has already hit its debt ceiling but cash balances mean it can probably hold out to mid-year or the third quarter without needing to raise it. Raising it will be a long process where the House passes a bill with spending cuts that’s rejected by the Senate and Biden ahead of inevitable negotiations at some point. But any resolution will again be last minute, and markets will fret at the prospect of no deal and a default causing the potential for share markets falls at the time. The odds are a deal will be reached enabling shares to rebound or Republican’s will get the blame for any default and big cuts to spending which won’t look good for them ahead of next year’s election.
Are bonds dead as a portfolio diversifier?
Last year saw both shares and bonds sell off leading many to question the role of bonds as a portfolio diversifier to equity volatility. However, last year’s poor performance from bonds and shares together was driven by a common driver of inflation. This is not that unusual historically when the surge in inflation in the 1970s and then its collapse in the 1980s into the early 1990s boosted the correlation between them. However, with bond yields now higher and inflation falling bonds are likely now to provide a better diversifier to equities should equities be hit by recession risks.
Will high levels of global debt de-rail things?
This is now estimated to be up around $US300trn or nearly 350% of GDP globally and clearly poses a risk with interest rates rising, particularly in emerging countries with $US debt. However, much of the rise in debt since the pandemic has been in the public sector where the risk of major problems is less (as governments can raise taxes) and high debt levels may make central banks jobs easier as they won’t have to raise rates as much as otherwise to slow down spending and hence inflation.
Have Australian house prices already bottomed?
From their low in February, average dwelling prices in the five biggest capital cities are up 1.3% led by Sydney which is up 2.6%. This appears to reflect bargain hunters, first home buyers and investors stepping in after sharp falls, expectations that mortgage rates have peaked, the return of immigrants and low listings. Our base case remains for Australian home prices to fall further out to later this year as interest rate hikes impact and slower economic growth impact. The RBA estimates that 40% of home borrowers have less than 3 months prepayment buffers, 15% of variable rate borrowers will have negative cash flow by year end if the cash rate rises to 3.75% and nearly 900,000 fixed rate mortgages are due to reset to interest rates that are more than double their initial level. This all runs the risk of increased distressed sales, particularly as growth slows. But the rapid return of immigration, very low rental vacancy rates & constrained supply mean that our expectation for a top to bottom fall of 15-20% may be too pessimistic and we may have already seen the low. So given the conflicting forces at present the property market has become hard to call.
How can we improve housing affordability?
The resurgence of immigration, record low rental vacancy rates, still very high home price to income and debt to income ratios and surging rents have all refocussed attention on poor housing affordability in Australia. Fixing this requires a multifaceted solution across all levels of government with targets to be achieved over say a five-year period. My list of policies to improve affordability includes:
- Measures to boost new supply – relaxing land use rules within reason, releasing land faster and speeding up approval processes.
- Matching the level of immigration to the ability to supply housing. The pandemic driven pause in immigration provided a perfect opportunity to get this right upon reopening but we botched it yet again.
- Encouraging greater decentralisation – the “work from home” phenomenon shows this is possible, but it should be helped along with infrastructure and measures to boost regional housing supply. Excess CBD office space should be converted to residential.
- Tax reform – to replace stamp duty with land tax (to make it easier for empty nesters to downsize & cutting the upfront burden for first home buyers), cut the capital gains tax discount (to end a distortion favouring speculation) and to encourage build to rent property.
What is the risk of commercial property slump?
Commercial property benefited like other assets from the search for yield as bond yields plunged in the decades into the pandemic providing a positive valuation effect. Some saw the asset class as a replacement for bonds in portfolios. However, its now vulnerable from the double whammy of the rise in bond yields driving a negative valuation effect at the same time as reduced space demand flowing from “work from home” in the case of office property and online retail in the case of retail property. Of these threats, the first looks more manageable as commercial property still offers a reasonable (but lower) risk premium over bonds but the second is more significant. An economic downturn would add to the threat. The experience of the early 1990s where office valuations fell for 3 years as oversupply & recession pushed vacancy rates to 20-30% warns that commercial property slumps can be drawn out.
Energy from Green Hydrogen will be expensive even by 2050
Benny Falk
CEO NATIONAL GREEN ENERGY PARK NV
- Our Team
Green hydrogen is considered a crucial solution to decarbonise ‘hard-to-abate’ sectors and, whilst some commentators suggest it will be available for ~$0.5 /kg – a cost level that is infeasible in our view – we don’t believe it will be available for <$3 /kg (real 2022) at the point of use, even in 2050. $3 /kg is equivalent to ~$80 /MWh, higher than natural gas prices today and 6x higher than pre-energy crisis, steady-state thermal coal prices.
In our view, projections of $0.5 /kg costs do not stand up to rigorous, techno-economic assessment. Such low-cost projections are misleading because they imply that no great change to the economics of the global energy system is needed and that the energy transition will be easy. While CRU believes that green hydrogen will play a major role in the energy transition, the switch to hydrogen will necessarily lead to significantly higher energy prices and this will have ramifications on the economy, the competitiveness of different sectors and on how consumers spend their money.
CRU provides a credible and independent view of costs and technology development vital for the energy transition. This Insight is one in a series highlighting this work.
Green hydrogen is key for achieving net zero by 2050
Various countries and regions have set up ambitious goals for clean hydrogen production in the coming decades as part of their net zero roadmap. For example, in September 2022, the United States Department of Energy (DOE) identified opportunities for 10 Mt/y of clean hydrogen production by 2030 and 50 Mt/y by 2050 in its draft National Clean Hydrogen Strategy and Roadmap. In May 2022, the EU announced its target of reaching 20 Mt/y of renewable hydrogen use by 2030 in the REPowerEU plan and, in March 2019, the Ministry of Economy, Trade and Industry of Japan (METI) targeted a “one-fourth cost” for water electrolysis equipment – from $1,500 /kW installed capacity to $380 /kW by 2030 – in its Hydrogen and Fuel Cell Roadmap.
Although large-scale deployment of green hydrogen is not necessarily a prerequisite for the achievement of each country’s 2030 announced pledges, green hydrogen is an essential component in the 2050 net zero roadmaps of most developed nations.
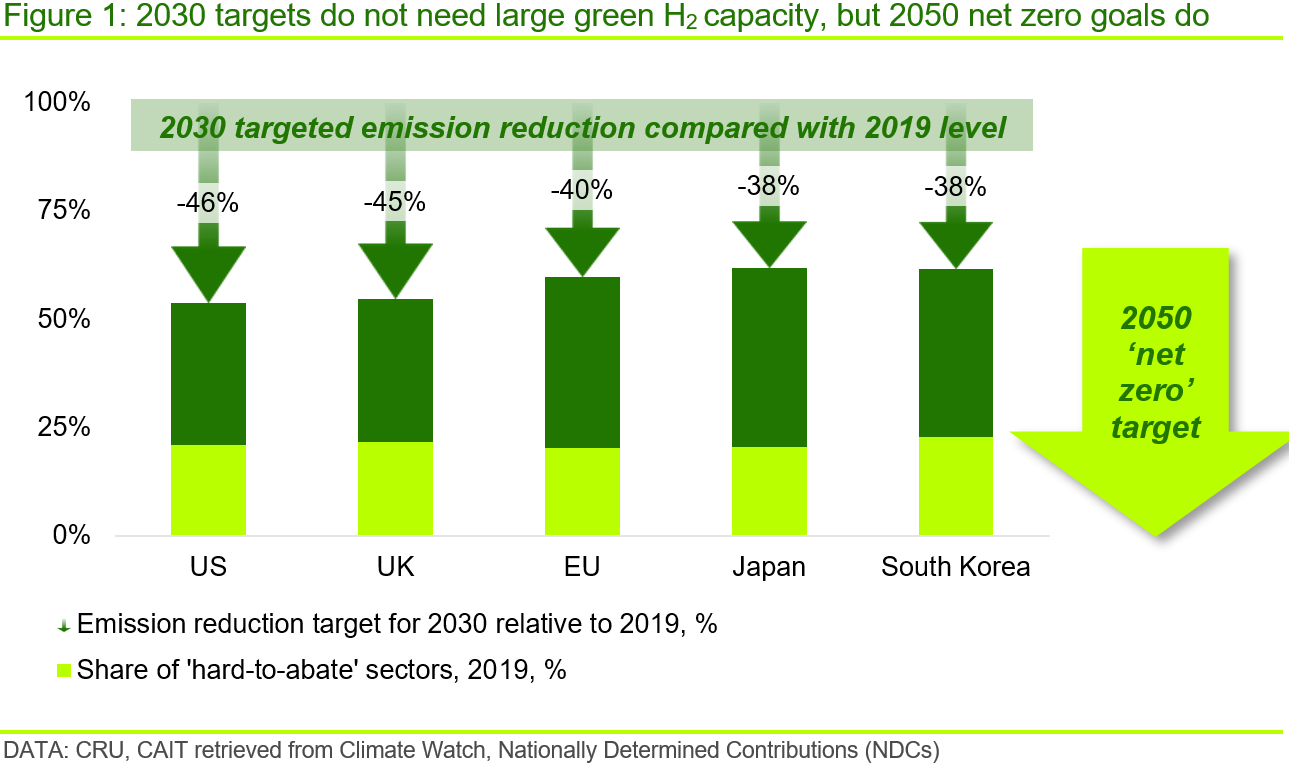
Green hydrogen uses green power to produce hydrogen through electrolysis and this route accounts for ~1% of current global hydrogen production. The rest is predominantly grey hydrogen that is produced from methane or coal through natural gas reformation or coal gasification. Blue hydrogen refers to hydrogen derived from fossil fuels but where reforming/gasification plants are coupled with carbon capture facilities.
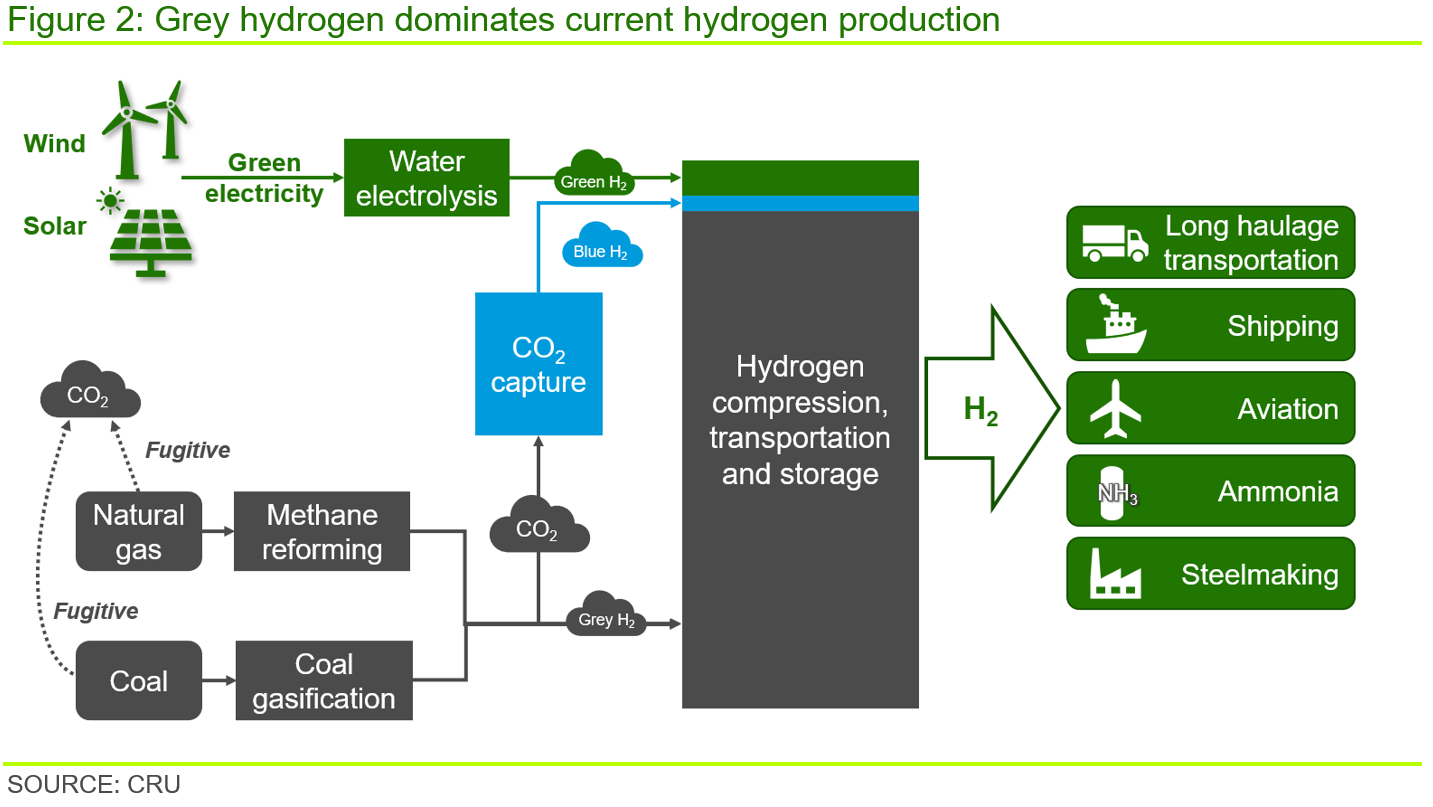
Long haulage transportation, shipping, aviation and industrial sectors such as steel and ammonia can utilise green hydrogen to mitigate carbon emissions by 2050.
Green H2 at $0.5 /kg is unrealistic, even by 2050
Green hydrogen cost projections of ~$0.5 /kg have been cited by many commentators in recent years and costs below $1 /kg routinely proposed, sometimes stated as achievable as early as 2030. However, in our view, costs this low are unrealistic. Rather, it is our belief that the $0.5 /kg cost aspiration has been put forward less because it is the result of a rigorous assessment of the relevant technologies but simply because it aligns with the pre-energy crisis, steady-state cost of thermal coal (i.e. ~$3.5 /GJ). That is, hydrogen at this cost level implies that no great change to the economics of the global energy system is needed and so is intended to imply that the energy transition is easy and little sacrifice is required to make it happen. This is untrue – under a decarbonised future, energy costs will necessarily be higher than we have been used to.
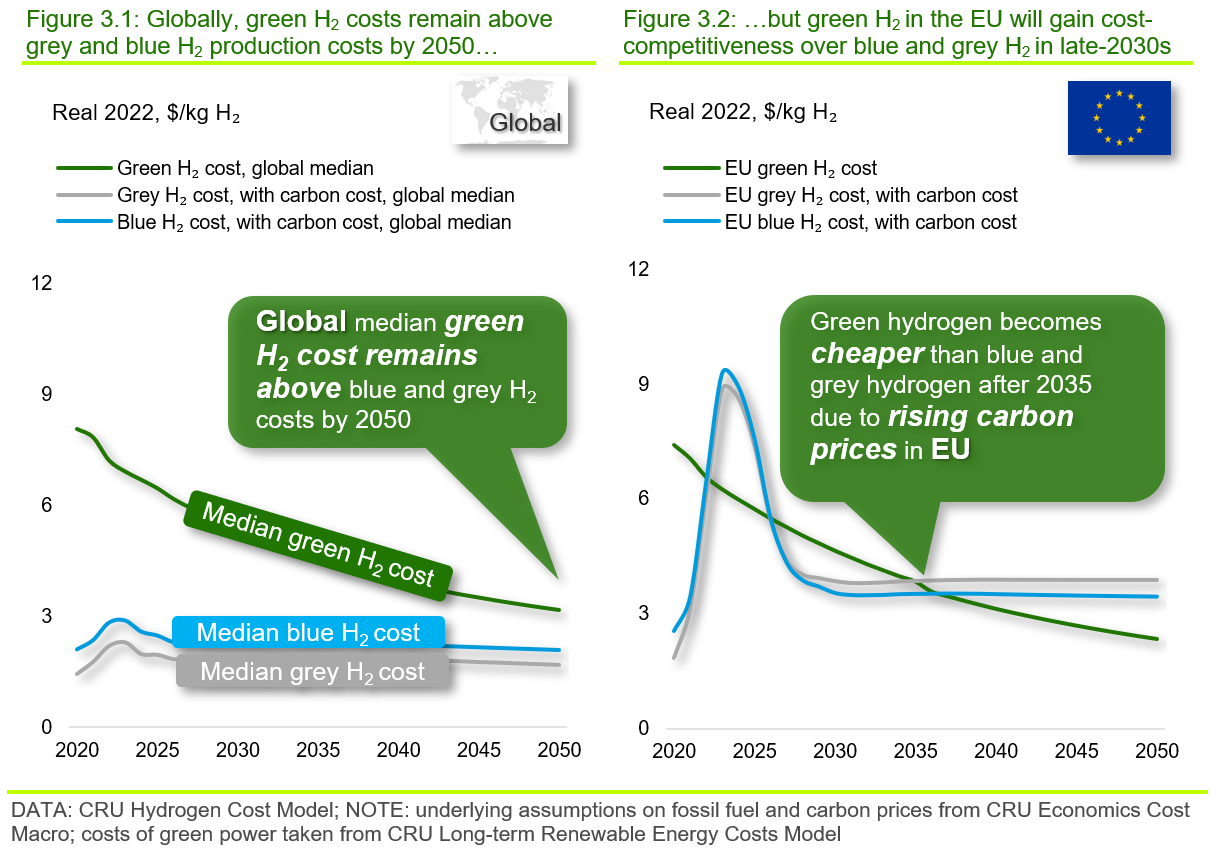
CRU’s Hydrogen Cost Model, which builds on our long-term renewable energy costs research, finds that, even for green hydrogen production facilities in very favourable renewable energy locations, ~$2 /kg is already a stretch goal for 2050. This is equivalent to a 50–70% fall from current levels, depending on country, and is largely due to halved renewable power costs and a 75% reduction in electrolyser system capex. It should be noted, this $2 /kg cost is quoted on a ‘net ex-works’ basis. It assumes a cost-free connection of the renewable power source directly to the electrolyser and omits the hydrogen storage, compression and distribution costs that would need to be added to reflect the full cost at point of use (n.b. see further on for more details).
Further, apart from the EU, the UK and China, which are expected to have access to low-cost renewable energy by 2050 and/or relatively high carbon prices, most countries exhibit green hydrogen costs above blue and grey hydrogen costs by 2050.
Even $1.5 /kg will be an extreme stretch target for green H2
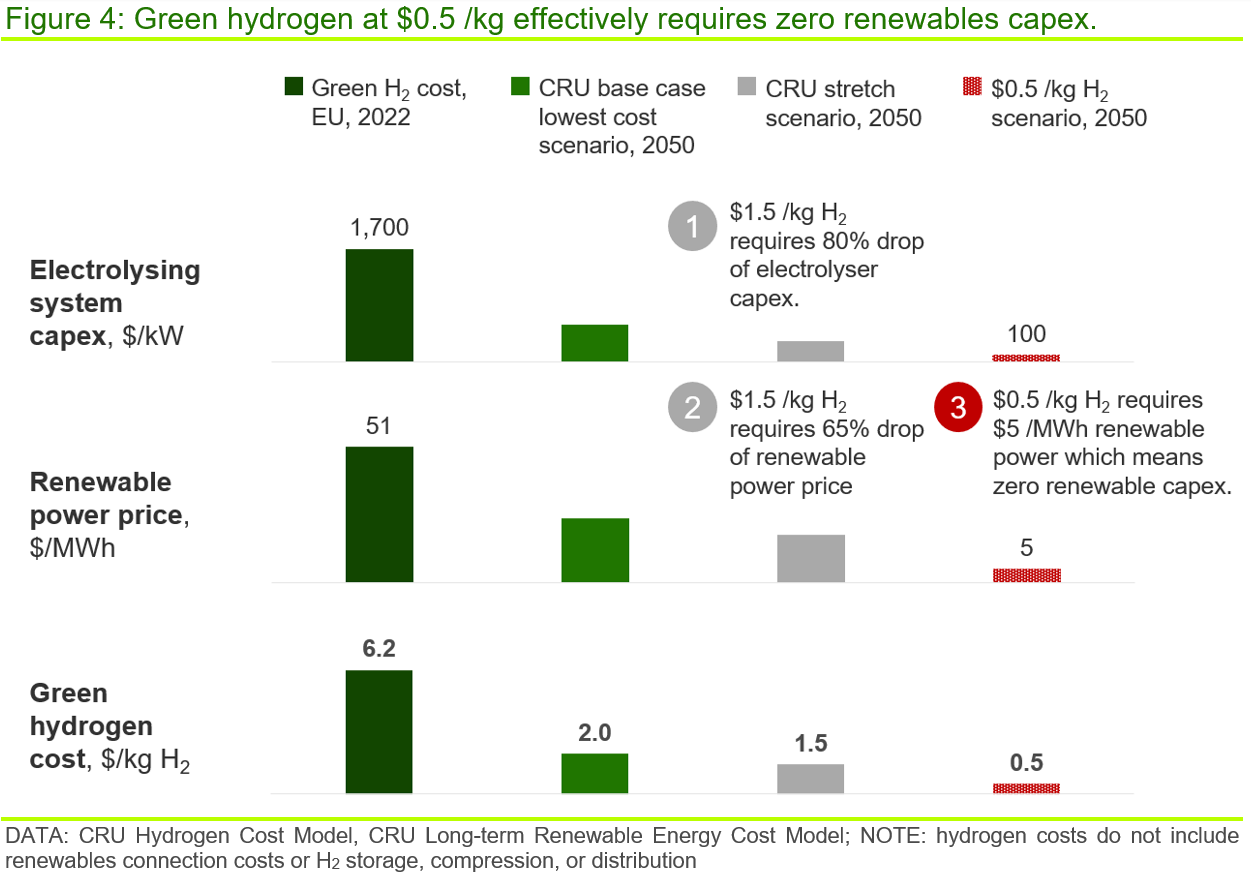
In CRU’s most optimistic case, green hydrogen costs could drop to ~$1.5 /kg by 2050 (n.b. net ex-works, with no power connection cost or H2 storage, compression, or distribution costs), a price that puts green hydrogen broadly on a par with grey and blue hydrogen in most regions. However, to achieve this, the scale of cost improvements needed is significant, requiring an 80% cost reduction of system capex. and 65% reduction of renewable energy costs as illustrated in Figure 4. The electrolyser would need to be able to deal with a fluctuating electricity supply with a 54% utilisation rate (i.e. no battery storage is assumed, as this is costly). A number of these assumptions are challenging.
For example, renewable energy at ~$18 /MWh requires an average renewable capex. of ~$300 /kW for both wind and solar operating at their largest load factor potentials. Assuming a grouping of solar and wind – which provides the most favourable power output profile for an electrolyser – the $1.5 /kg scenario is asking for a 70–80% capex. reduction in the next three decades. Note that, according to IEA, although the capex. of solar has dropped by ~50% over the past eight years, a period of rapid costs decreases, the capex. for onshore wind fell by only ~10%.
To achieve $0.5 /kg, even if we assume electrolyser system capex. drops to $100 /kW in 2050 (i.e. by 95%) and other operating costs fall, renewable power costs would have to fall to $5 /MWh – a price level that doesn’t cover any of the renewables capex. That is, the renewables capex. would need to be zero to achieve a power price of $5 /MWh, which is infeasible.
Received price of green H2 likely >$3 /kg (real 2022) in 2050
We don’t believe a ‘net ex-works’ price of below $2 /kg H2 (real 2022) is feasible and, in addition to this, we would expect further costs associated with an electrical grid or renewables connection – even for a local grid – as well as hydrogen storage, compression and distribution. Taking these costs into account, the total green hydrogen cost to a typical end-user is expected in the range ~$3–7 /kg (real 2022) in 2050.
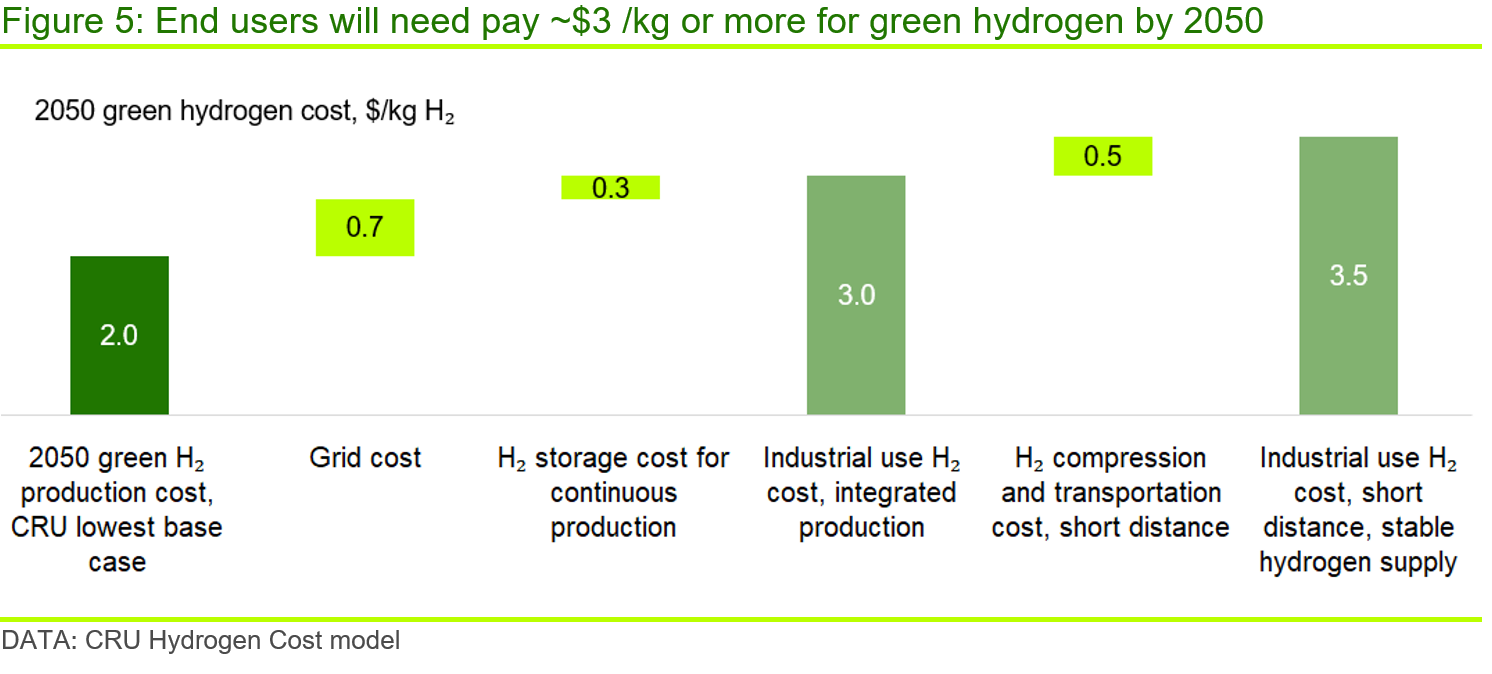
‘Renewable-to-electrolyser’ interconnectors could add ~$0.7 /kg
While a typical, full grid charge (i.e. assuming an electrolyser facility takes power via a grid after purchasing renewable power directly) might add ~$2.5–3.0 /kg to the cost of hydrogen, a more likely scenario is the direct connection of nearby, but differently located solar and wind resources (i.e. a mix that provides the flattest power profile) to a central electrolyser via interconnectors. According to CRU’s Interconnector Database, this could add ~$0.7 /kg, on average, to the cost the green hydrogen production.
Storage, compression and distribution costs could add further ~$0.8 /kg or more
Compression and transportation of hydrogen over 100–200 km can add $1–3 /kg if using trucks, as is mostly the case currently. However, the best-case scenario for 2050 includes the large-scale deployment of hydrogen pipelines operated at a high utilisation rate that could bring costs down within the range of $0.1–2 /kg, depending on distance. Some level of storage will also be required, and this could add a further ~$0.3 /kg.
As such, at best, sectors such as the transportation and aviation that would need a distributed hydrogen supply are expected to have to bear a ‘best’ cost/price closer to ~$3.5 /kg (real 2022). This cost includes a renewables connection cost and hydrogen storage, compression and transportation, and assumes a short distance between the hydrogen production facility and the user’s hydrogen refuelling station. Separately, the lowest possible cost for industrial green hydrogen users, such as steelmakers or green ammonia producers, could be closer ~$3.0 /kg, provided plants are fully integrated with green hydrogen production facilities such that shipment costs are negligible. A cost of ~$2.0 /kg, as quoted above, is only applicable if a renewable connection charge is exempted, no storage is required and hydrogen is used directly after production, which itself would engender its own set of challenges.
Green hydrogen is the only zero emission hydrogen among current options
The other possible carbon emission mitigation solution for ‘hard-to-abate’ sectors seems to be blue hydrogen, which is sometimes also quoted as ‘clean’. By 2050, based on our forecasts for fossil energy prices, blue hydrogen is expected to have lower cost compared with green hydrogen overall. However, blue hydrogen is not an emission-free hydrogen production route. In fact, the lowest possible emission intensity of blue hydrogen, assuming continued fugitive emissions of methane along the full natural gas supply chain, will be ~30% that of natural gas. That is, 1 t of blue hydrogen will still be responsible >2 t of carbon dioxide emissions.
If the world is going to rely heavily on green hydrogen to achieve its net zero target, ‘hard-to-abate’ sectors will face much higher energy costs in 2050.
HeavyFinance Launches Green Loans to Generate Carbon Credits in European Agricultural Land
HeavyFinance, a European climate tech investment marketplace for the agricultural industry, has launched Green Loans to tap into a rapidly growing carbon credit market.
This new debt instrument enables both retail and institutional investors to get returns from the sale of CO2 removal credits generated in European farmland. With the urgent need to take an action on climate change and the high demand on the voluntary carbon credit market, investors in Green Loans can now expect up to 30 per cent annual returns with an investment period of 4 years.
With this financial product, farmers taking a Green Loan do not pay an interest rate, as returns for investors are generated from the sale of CO2 certificates.
HeavyFinance estimate to facilitate €7-10 million of debt capital during the first year after the launch of Green Loans, providing high-quality carbon certificates for investors while supporting farmers with the mass adoption of regenerative practices to tackle climate change.
Laimonas Noreika, Founder of HeavyFinance, said: “Green Loans is an exciting new offering, supporting institutional investors and farmers alike to play a central role in tackling climate change. Following our successful seed round, we are keen to make a splash in the European market, offering impact investing options to support the removal of greenhouse gas emissions. The agricultural sector has an important role to play in combating climate issues, requiring a unified effort from those within, and investing in, the industry to promote sustainable, low-carbon practices such as no-till farming across Europe.”
Violeta Gevorkjan, Decarbonisation and Sustainability expert at HeavyFinance, added: “Benefits for farmers are clear in terms of the results of the triple bottom line becoming environmentally friendly, socially responsible, and economically viable. Improved practices reduce soil erosion and increase resiliency to high temperatures, droughts, and floods”.
The programme represents a solution to the agriculture sector being labelled the third largest contributor to greenhouse gas emissions in Europe, according to the quarterly greenhouse gas emissions in the EU report.
Green Loans was set up to support carbon farming – an innovative approach aimed at reducing the amount of carbon dioxide entering the atmosphere by storing it within the soil, in turn leading to increased yields.
This regenerative approach to farming is based on sustainable agricultural practices such as no-tillage, strip or minimal cultivation, as well as crop rotation and management of crop residues, and according to a recent report by the Food and Land Use Coalition, regenerative agriculture could remove 1 billion tons of carbon dioxide equivalent per year by 2050.
HeavyFinance has recently closed a €3 million funding round and plans to enrol over 150,000 hectares across Europe to generate carbon credits in countries such as Poland, Lithuania and Bulgaria by the end of the year.
Article from Fintec Finance FFNews – thank you
Note: JMP Securities does not promote this investment, this article is for information reading only
I hope you have enjoyed this week’s read. If you would like more information on opening a trading account, please feel free to contact me.
Regards,
Head, Fixed Interest and Superannuation
JMP Securities
Level 1, Harbourside West, Stanley Esplanade
Port Moresby, Papua New Guinea
Mobile (PNG):+675 72319913
Mobile (Int): +61 414529814