4 July, 2023
Hello and welcome to this week’s JMP Report
Last week we saw 5 stocks trade on the local market. BSP traded 2,176 closing 5t higher at K12.85. KSL traded 833, closing steady at K2.40. STO traded 405, closing steady at K19.11. NCM traded 739, closing steady at K75.00 and CCP traded 16,917 shares also steady K2.00.
WEEKLY MARKET REPORT | 27 June, 2023 – 2 July, 2023
| STOCK | QUANTITY | CLOSING PRICE | CHANGE | % CHANGE | 2021 FINAL DIV | 2021 INTERIM | YIELD % | EX-DATE | RECORD DATE | PAYMENT DATE | DRP | MARKET CAP |
| BSP | 2,176 | 12.85 | 0.05 | 0.39 | K1.4000 | – | 13.53 | THUR 9 MAR 2023 | FRI 10 MAR 2023 | FRI 21 APR 2023 | NO | 5,317,971,001 |
| KSL | 833 | 2.40 | – | 0.00 | K0.1610 | – | 9.93 | FRI 3 MAR 2023 | MON 6 MAR 2023 | TUE 11 APR 2023 | NO | 64,817,259 |
| STO | 405 | 19.11 | – | 0.00 | K0.5310 | – | 2.96 | MON 27 FEB 2023 | TUE 28 FEB 2023 | WED 29 MAR 2023 | YES | – |
| KAM | 0 | 0.85 | – | 0.00 | – | – | – | – | – | – | YES | 49,891,306 |
| NCM | 739 | 75.00 | – | 0.00 | USD$1.23 | – | – | FRI 24 FEB 2023 | MON 27 FEB 23 | THU 30 MAR 23 | YES | 33,774,150 |
| NGP | 0 | 0.69 | – | 0.00 | – | – | – | – | – | – | – | 32,123,490 |
| CCP | 16,917 | 2.00 | – | 0.00 | K0.225 | – | 6.19 | FRI 24 MAR 2023 | WED 29 MAR 2023 | FRI 5 MAY 2023 | YES | 569,672,964 |
| CPL | 0 | 0.80 | – | 0.00 | K0.05 | – |
4.20 |
WED 22 MAR 2023 | THUR 30 MAR 2023 | THU 30 JUL 2023 | – | 195,964,015 |
Learn More | 2022 Ok Tedi Report
Dual listed Stock – PNGX/ASX
BFL – 4.83 -10c
KSL – 75c +.5c
NCM – 26.33 +1.15
STO – 7.60 + 30c
Order Book
Our Order Book has us as nett buyers of BSP, CCP, KSL and STO.
Other Asset Prices
Gold – 1923
Silver – 22.98
Natural Gas – 2.71
WTI – 70.62
Platinum – 910
Bitcoin – 30774 +1.71% 7days
Ethereum – 1950 +3.74% 7days
PAX Gold – 19898 – .52% 7days
Interest Rate Market
The Central Bank Bill market was oversubscribed again this week with the 7days being the target area by the Central Bank. 7 day auction results saw the average at 2.23%, issuing 304mill and leaving the market short 100mill. In the 91days, the average was 2.81% and issued 59mill. A total of 488mill was issued in this weeks auction, leaving the market short 207mill.
In the TBill auction the average remained flat at 2.99% with the Bank issuing 300mill leaving the market short 6mill.
No word on the next GIS auction, I will advise when details are released. But we do expect to see the next auction later this month
What we’ve been reading this week
Oliver’s insights – Australian recession Q&A
Why the worry? What’s the risk? And what would it mean
for investors?
Dr Shane Oliver – Head of Investment Strategy and Economics and Chief Economist, AMP Investment
Key points
– The risk of recession globally and in Australia has increased with ongoing central bank rate hikes.
– Signs of faster wages growth has seen the RBA turn more hawkish. The risk of recession here is now around 50%.
– Recession would mean higher unemployment, less job security & a likely further leg down in shares & home prices.
– By Feb we may need a Taylor Swift lift to help “shake it off”!
– Share market volatility is bad news but the best approach for most investors is to stick to a long-term strategy.
Introduction
The past few weeks have seen lots of talk again about a recession – particularly in Australia. This has been a recurring theme over the last year or so but has intensified lately. But what’s driving it? How serious is the risk of recession? And what would it mean for Australians and investors?
But first what is a recession?
A recession is generally defined as a contraction in the level of economic activity. In some countries it’s technically defined as two or more quarters in a row of falling economic activity as measured by GDP but this measure can have its failings, e.g. if GDP falls 1% in one quarter, rises 0.1% the next and then falls 1% it wouldn’t meet the technical definition of a recession but most would agree that it is. So, some like the US adopt a wider definition based around a period of contraction as measured by GDP and a range of other economic indicators including industrial production, income and employment.
Because Australia has strong population growth there been a focus on “per capita recession” which is where the economy still grows but at a lower rate than the population so GDP per person goes backwards. This is arguably more relevant for individual living standards. GDP per capita has already contracted in the March quarter and most, including the RBA and the Government, are forecasting at least a per capita recession.
Why the concern now?
The concern about recession has been rising with central bank interest rate hikes. The rise in interest rates is aimed at slowing inflation by slowing demand and hence economic activity. It does this by:
- increasing debt servicing costs for households (particularly those with mortgages) and businesses with debt, which reduces spending power;
- raising the cost of future borrowing which slows down home building and business investment;
- lowering asset values – for say shares and property – which results in less spending as people feel poorer via the “wealth effect”; and
- by pushing the currency higher than otherwise making it cheaper to bring in imports and reducing demand for exports.
Because central banks never know when they have raised interest rates enough to control inflation they often go too far – pushing the economy into recession. This was the case prior to recessions in Australia in the early 1980s and 1990s and in the US in the early 2000s and 2008.
We have been off the view that easing global inflationary pressures – as evident in improving supply and falling price pressures in various business surveys, etc – would have enabled central banks to have stopped raising interest rates by now. But central banks have gone further than we thought and remain hawkish. This includes the RBA which following signs of increasing upside risks to wages growth – particularly the higher than expected increase in minimum and award wages at a time of low productivity growth – appears to have become more hawkish and be giving less weight to keeping the economy on an “even keel”.
Why all the fuss about faster wages growth?
Everyone wants to see their wages grow faster than inflation. But when wages are simply chasing inflation higher as we saw in the 1970s it can lead to a wage price spiral which perpetuates high inflation as companies raise prices to maintain profits in response to stronger wages. As a result the second round response to the initial spike in inflation of catch up wage growth risks entrenching high inflation. Hence the more aggressive approach by central banks to guard against this. The Bank of England has gone down this path & the RBA appears to be doing the same.
But unemployment is low & shares are up 10% plus from 2022 lows so how can there be a recession?
It’s true the Australian economy has been remarkably resilient despite a 4%, or 400 basis points, rise in the official cash rate and a doubling or more in mortgage rates. The economy is still growing, the roads are congested, restaurants seem full, travel has surged and unemployment is just 3.6%. However, this provides little comfort.
- Interest rate hikes normally impact with a lag of up to 12 months as its takes time for rate hikes to be passed through to borrowers, for borrowers to cut spending and for companies to cut their workforces.
- This time around the lag is likely longer thanks to massive pandemic fiscal stimulus which left many households with much higher than normal savings balances, the release of pent-up demand with reopening, 40% of home borrowers at record low fixed mortgage rates (compared to a norm of 15%) and a highly competitive mortgage market that has blunted the flow through of rate hikes.
This lag was evident in the late 1980s and early 1990s. Despite the RBA progressively hiking rates to 18% over 1988 and 1989 the unemployment rate kept falling prompting many to argue the economy was impervious. But then in late 1989 and early 1990 the lagged impact of rate hikes hit and the economy went into deep recession with the RBA having to rapidly reverse course. It was a classic case of the economy being ok until it’s not!
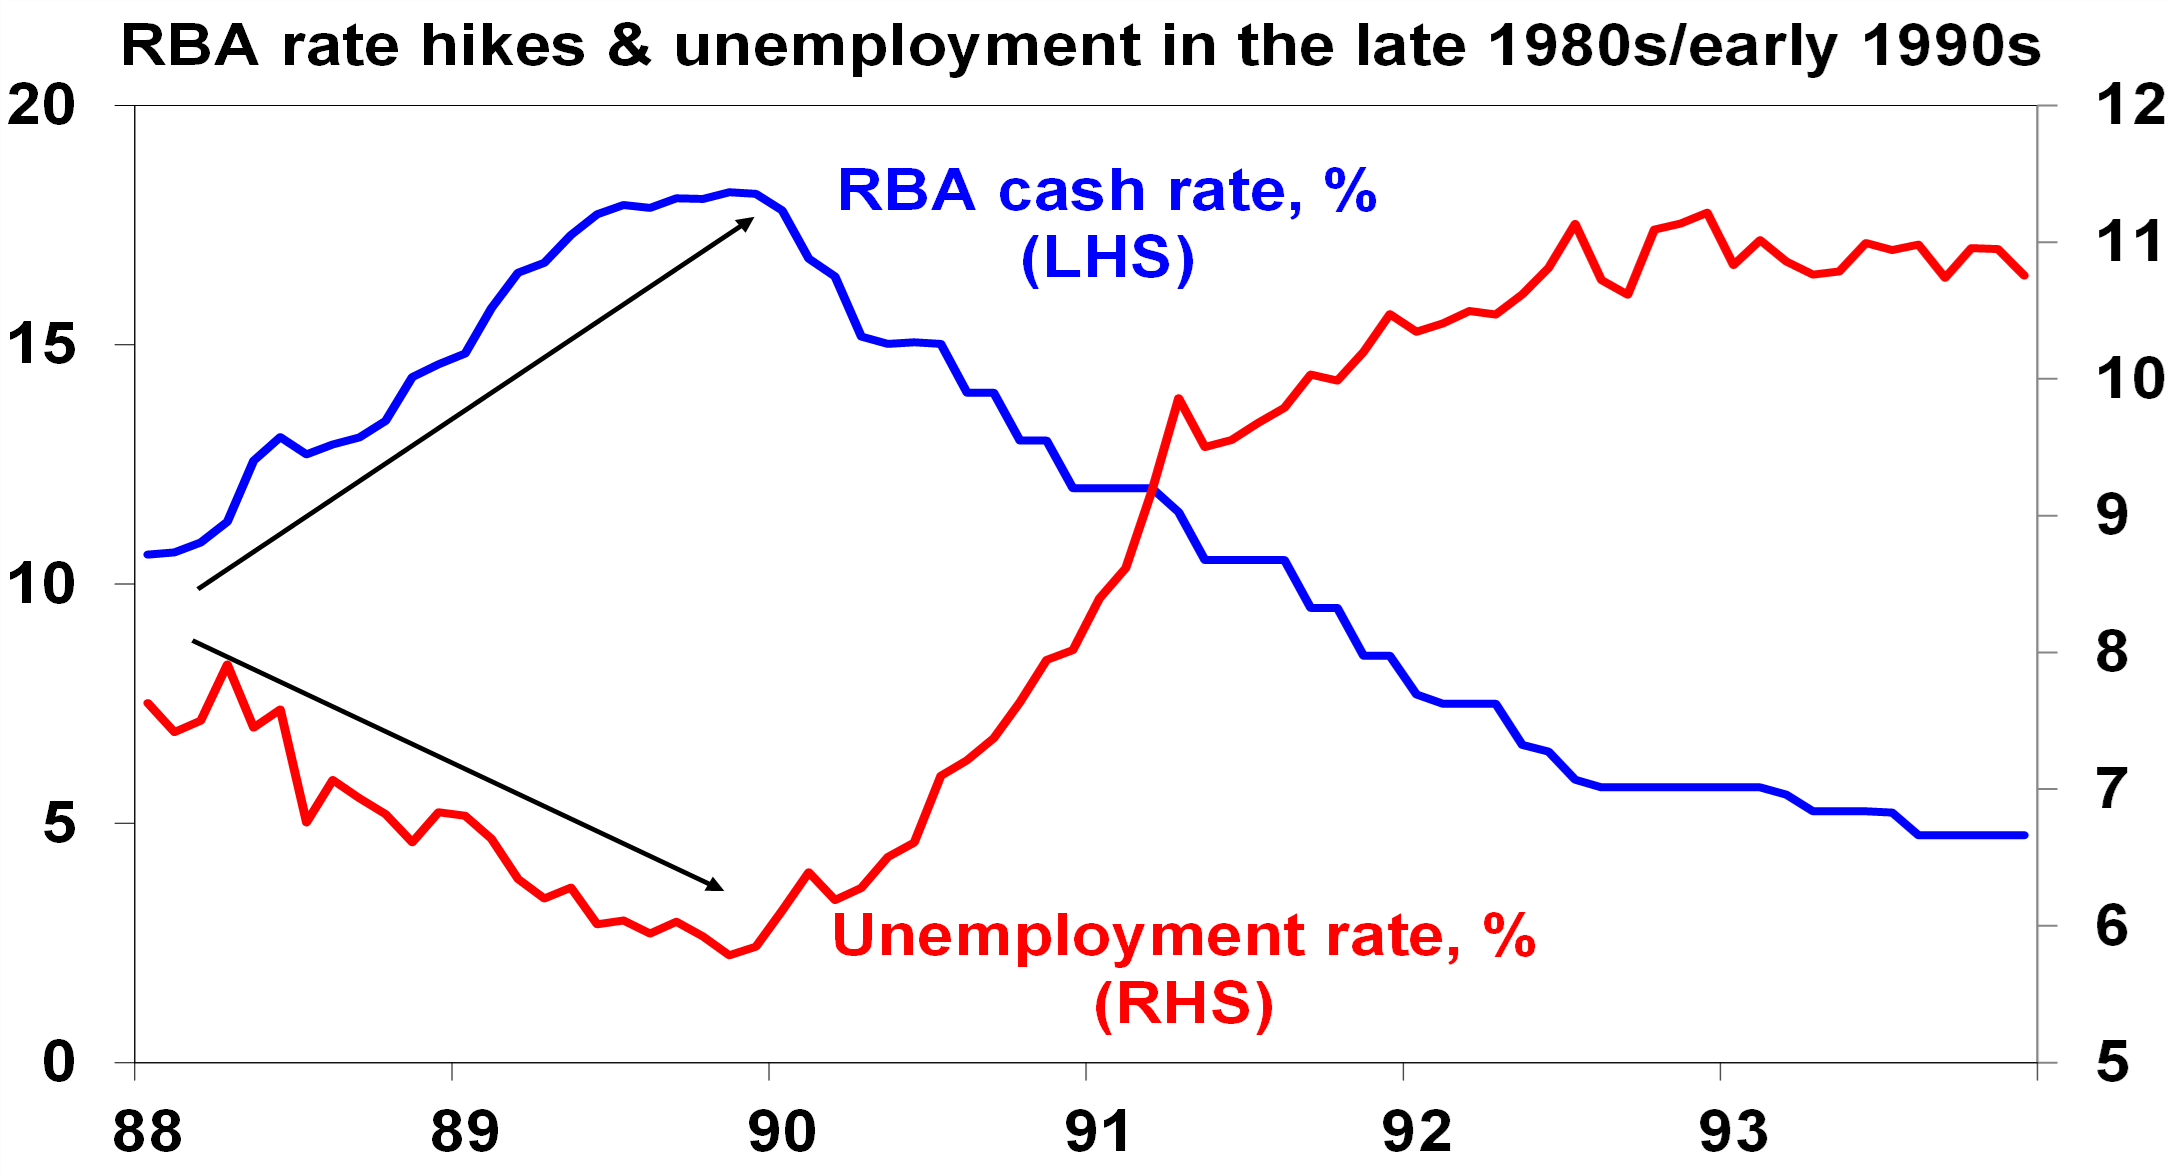
Source: AMP, ABS
Of course, things were different back then with household debt to income ratios being one third current levels and very high inflation expectations resulting in much higher interest rates – but the lags are still relevant.
The protection provided households by fixed rates is now ending with borrowers seeing rates reset to levels two or three times what they were and at some point the saving buffers and the reopening boost will have been exhausted. And we are now seeing increasing evidence rate hikes are biting with falling real retail sales, falling building approvals, slowing business investment, slowing GDP growth, more negative corporate commentary, rising insolvencies and indications of a slowing jobs market.
So what’s the risk of recession?
We have already revised our Australian GDP growth forecast down to just 0.7% for this financial year (compared to the RBA’s forecast for growth of 1.4%). But as a result of ongoing rate hikes, we see the risk of recession starting around late this year as now very high at about 50%. Consumer spending is almost certain to start going backwards later this year as the 4% plus cash rate will push debt servicing costs into record territory as a share of household income and on the RBA’s analysis 15% of households with a variable rate mortgage (about 1 million people) will be cash flow negative by year end at a 3.75% cash rate & we are now well beyond this.
The US Leading Index – which is comprised of economic indicators like building approvals that normally lead the economic cycle – has already fallen to levels normally associated with recession. In Australia though the Westpac/Melbourne Institute’s Leading Index has fallen but is not yet decisively at levels associated with recession. Which partly explains why we have put the risk of recession at 50% as opposed to more.
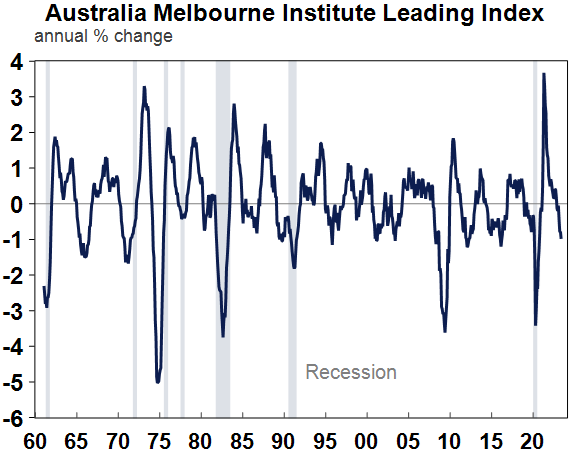 Source: Macrobond, AMP
What will recession mean for Australians?
Many Australians have had no experience of recession as the last real recession ended over 30 years ago. The pandemic slump in 2020 was due to a mandated shutdown and incomes were protected by programs like Job Keeper so it’s not much guide to any future recession. A recession normally sees higher unemployment – the early 1980s and 1990s recessions saw a roughly 5 percentage point increase, less job security, a contraction in living standards and low levels of confidence. Most will still keep their jobs but they would experience less job security and wages bargaining power and lower levels of confidence. However, recessions eventually also mean lower inflation which would help alleviate cost of living pressures. Recessions often also lead to lower levels of immigration and less household formation which could take pressure off rents and home prices although declining home building won’t help.
What would be the impact on shares?
Historically recessions in Australia and the US have tended to be associated with bear markets in shares, ie, 20% or more falls, as recessions drive a slump in company profits. The next chart shows the Australian share market and falls in it against US recessions. A modifying factor is that share markets are still 8% or so down from their 2021/early 2022 highs so the risk of recession is arguably partly still factored into markets which may limit the extent of falls if a recession does eventuate.
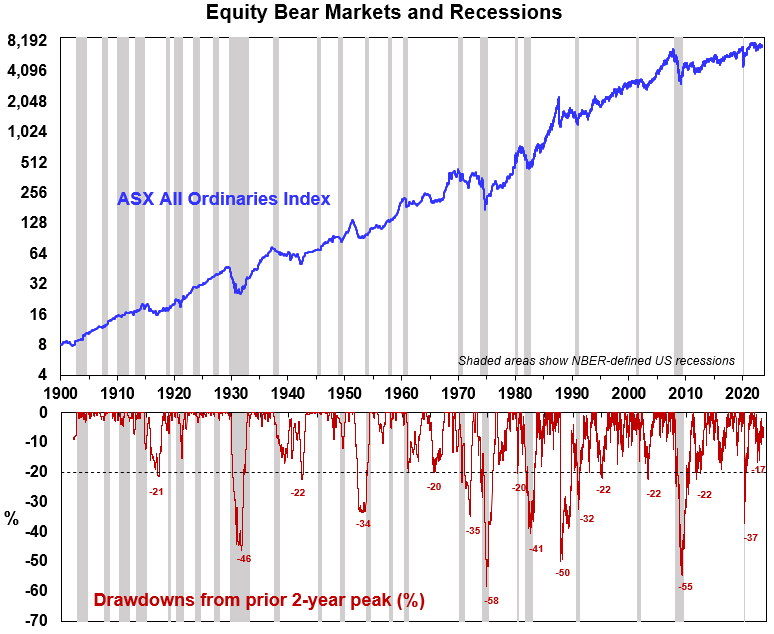
Source: ASX, Bloomberg, AMP
What would be the impact on residential property?
Australian home prices have rebounded from their lows as a severe supply shortfall has dominated rising rates. However, a recession could drive another leg down in home prices as buyers back of, higher rates and higher unemployment push up distressed selling and recession drives reduced household formation. CoreLogic data shows a 9% fall in capital city property prices in the early 1980s recession with a 25% fall in Sydney, and a 6% fall in the early 1990s recession with a 10% fall in Sydney.
What about interest rates?
Recessions invariably drive sharp falls in interest rates as the RBA will cut rates in response to falling inflation and rising unemployment. While we are allowing for two more 0.25% rate hikes from the RBA in the next few months, we expect it to cut rates four times next year.
Implications for investors
While times like these can be stressful, for superannuation members and most investors the best approach is to stick to an appropriate long term investment strategy to take advantage of the rising long-term trend in share markets given the difficulty in trying to time short term swings.
THE POTENT MIX THAT COULD SEND GOLD TO $4,500
Ainslie Bullion Posted | 27/06/2023
Could FOMO — the Fear of Missing Out — take hold of the gold market, and ignite a race to the safe haven commodity, propelling its price towards $4,500 an oz? A recent report from Bloomberg Intelligence hints at this possibility, backed by the impending slowdown in the global economy in the second half of the year.
As we look at the data, one thing becomes clear: the landscape for gold in the latter half of this year is shaping up to be vastly different from what we’ve witnessed so far. Central banks have been making significant gold purchases over the past several months, suggesting a foundational shift towards tangible assets amidst economic uncertainties.
With the first half of the year wrapping up this Friday, the stock market may well face its reckoning in the latter half. High-performing equities, fuelled by the Federal Reserve’s hawkish stance, may not sustain in the face of an economic slowdown. We’ve seen U.S. Treasuries yield around 5% and the S&P 500 climb about 15% in 2023, but, as Bloomberg Intelligence senior macro strategist Mike McGlone rightly questions, can this performance last?
Echoing the concerns of 1929-30, when the initial fall in the Dow Jones Industrial Average was followed by a sizeable bounce before the onset of the Great Depression, McGlone’s analysis points to the significant risk of a similar fate, due to the massive liquidity pump now receding.
Historically, the gold market has benefitted from economic slowdowns and stock market selloffs, making it a reliable refuge for investors. This year, the central banks’ accumulation of gold has provided considerable support to its prices, offsetting gold ETF outflows. Once the stock market hits the skids, there will be little standing in the way of a gold surge.
Divergence is another crucial factor here. McGlone indicates that the 10% year-over-year drop in Gold ETF holdings compared to a similar rise in gold price may be a sign of its unique strength. Central banks, some of the world’s deepest pockets, are buying gold, hinting at a potential Federal Reserve pivot.
Adding fuel to this golden fire is the prospect of a deflationary recession, a possibility that might take the wind out of the stock market’s sails. But for gold bulls, this could be the golden ticket to prices holding steady above $4,500 an oz.
Gold’s current price per ounce, roughly half of the S&P 500’s level in Q2 (when priced in USD), could transform into a significant advantage, especially if the U.S. economy contracts. History has taught us how booms often bust when excessive liquidity is withdrawn. These circumstances may set the stage for gold to rise above and stay past its US$3,000 ($4,500 Aussie) resistance point.
As we conclude the first half of the year and brace ourselves for the evolving global economic conditions, gold is showing all the signs of becoming the go-to haven for investors. A projected economic slowdown, high valuations in the stock market, an aggressive buying spree by central banks, and FOMO could all combine to create an unprecedented scramble for gold.
Only 24 hours to go! Attend our live, interactive presentation – on Wednesday, 28th June at 7:30pm AEST, by clicking here https://www.youtube.com/watch?v=jGWVjbLlb3c
Learn all about investing in Bullion, Crypto and Self-Managed Super Funds. Get your questions answered by our experts, in the Q&A session at the end. If you would like to set a reminder: Subscribe to the Ainslie channel, click “Notify Me” and turn on your notifications.
Share this exclusive event with friends and family – https://www.ainsliebullion.com.au/webinar.aspx
-
Media Release 20 June 2023 Women and younger Australians help lift numbers of adult investors – Media Release – Australian Stock Exchange

Media Release Australian Stock Exchange 20 June 2023
Women and younger Australians help lift numbers of adult investors across the nation to a record 10.2 million There are now more Australian female investors than ever before, according to the ASX Australian Investor Study 2023 released today.
The study also found that young Australians are continuing to play a key role in the investment landscape, with the next generation investor (aged 18-24) making up more than one fifth (22%) of those who began investing in the last two years. General Manager, Investment Products and Strategy, Andrew Campion, said: “The ASX Australian Investor Study is ASX’s flagship research that provides an authoritative guide on the evolution of investment markets and investor behaviour. “Our latest study has found that the number of investors that hold on-exchange investments has grown from 6.6 million to 7.7 million in 2023 – the highest proportion of on-exchange investors in over a decade. This equates to 38 per cent of Australian adults.
“While Australian shares are still the most popular of all on-exchange investments, exchange traded funds (ETFs) continue to grow in popularity with 20 per cent of investors holding such investments, up from 15 per cent three years ago.
This growth aligns with ASX’s latest statistics where total ETF funds under management has grown by an astonishing $80 billion from $63.5 billion in May 2020 to $143.5 billion as at the end of May 2023. “The report also compares holdings of different asset classes and found that there’s been a slight dip in residential property investment (down four per cent), but gains in shares and ETFs, suggesting Australians are looking at other ways to build wealth outside of property.”
While females made up half of the 1.2 million net new investors since 2020, women are still under-represented as a whole (42% vs 58%), with more women than men citing affordability as their primary barrier to investing.
This is expected given the significant wage gap, with Australian women on average earning 25 per cent less than their male counterparts ($85,655 vs $107,466).
In addition, of the Australian’s who have never invested, 64 per cent are female. The survey found that female investors find the selection of information sources the most challenging aspect of investing, with over a third turning to family and friends to guide their decisions.
They are less likely than males to turn to professional sources such as the ASX website, company annual reports and paid subscription investing websites.
Promisingly, the study found that 55 per cent of the next gen investors who began investing in the last two years were female.
Younger investors continue to make up a significant portion of new investors. The main investment goal for this group is to build a sustainable income stream, which is unexpected given younger investors will typically have a steady income stream from work.
Interestingly, the survey found that this cohort self-identify as being risk averse, preferring guaranteed and/or reliable returns. Yet almost one in three hold cryptocurrency and their portfolios are the least diversified of all age groups, suggesting there may be a gap in financial literacy.
“Covid created this wave of new retail investors and our own internal analysis saw record trading value from this cohort,” Mr Campion said.
“While retail trading value has returned to ‘pre-Covid’ levels, the number of investors holding on-exchange investments continues to steadily grow.
“We will continue to see younger investors enter the market for the first time.
This cohort will make up almost 30 per cent of the 1.33 million non-investors that intend to invest in the next 12 months.
“It is important that as a financial community, we arm these new investors with the information that they need to make informed investment decisions.”
The full ASX Australian Investor Study 2023 can be accessed from the ASX website: https://www2.asx.com.au/investors/investment-tools-and-resources/australian-investor-study Background Since 1986, the ASX Australian Investor Study and its predecessor, the ASX Share Ownership Study, have provided an authoritative guide on the evolution of investment markets and changing investor behaviour.
Our latest study surveyed over 5,500 Australian adults and provides valuable insights about everyday Australian investors – who they are, where they choose to invest, and what their investment goals are. It reveals that more than ever, Australians are investing beyond their home and superannuation, and it’s likely the pandemic has been at least partly responsible for this trend. We also explore the next wave of investors, many of them women, and the rise of the younger tech-savvy investor.
Reference www.asx.com.au
I hope you have enjoyed this weeks read, if you would like more information or you would like to open a trading account with JMP Securities, please reach out to Chris on the contact details below
Regards,
Head, Fixed Interest and Superannuation
JMP Securities
Level 1, Harbourside West, Stanley Esplanade
Port Moresby, Papua New Guinea
Mobile (PNG):+675 72319913
Mobile (Int): +61 414529814