25 July, 2023
Hello and welcome to this week’s JMP Report
Last week saw 5 stocks trade on the local market. BSP traded 476,886 shares, closing 5t higher at K12.85. KSL traded 283,876 shares, closing 20t lower at K2.20. NCM traded 1,068 shares, remaining steady at K75.00. CCP traded 3,052 shares closing steady at K2.00 and CPL traded 321 shares finishing the week of at K0.80.
WEEKLY MARKET REPORT | 17 July, 2023 – 21 July, 2023
| STOCK | QUANTITY | CLOSING PRICE | CHANGE | % CHANGE | 2021 FINAL DIV | 2021 INTERIM | YIELD % | EX-DATE | RECORD DATE | PAYMENT DATE | DRP | MARKET CAP |
| BSP | 467,886 | 12.85 | 0.05 | 0.39 | K1.4000 | – | 13.53 | THUR 9 MAR 2023 | FRI 10 MAR 2023 | FRI 21 APR 2023 | NO | 5,317,971,001 |
| KSL | 283,876 | 2.20 | –0.20 | -9.09 | K0.1610 | – | 9.93 | FRI 3 MAR 2023 | MON 6 MAR 2023 | TUE 11 APR 2023 | NO | 64,817,259 |
| STO | 0 | 19.11 | – | 0.00 | K0.5310 | – | 2.96 | MON 27 FEB 2023 | TUE 28 FEB 2023 | WED 29 MAR 2023 | YES | – |
| KAM | 0 | 0.85 | – | 0.00 | – | – | – | – | – | – | YES | 49,891,306 |
| NCM | 1,068 | 75.00 | – | 0.00 | USD$1.23 | – | – | FRI 24 FEB 2023 | MON 27 FEB 23 | THU 30 MAR 23 | YES | 33,774,150 |
| NGP | 0 | 0.69 | – | 0.00 | – | – | – | – | – | – | – | 32,123,490 |
| CCP | 3,052 | 2.00 | – | 0.00 | K0.225 | – | 6.19 | FRI 24 MAR 2023 | WED 29 MAR 2023 | FRI 5 MAY 2023 | YES | 569,672,964 |
| CPL | 321 | 0.80 | – | 0.00 | K0.05 | – |
4.20 |
WED 22 MAR 2023 | THUR 30 MAR 2023 | THU 30 JUL 2023 | – | 195,964,015 |
Dual Listed Stocks PNGX – ASX
BFL – 5.11 +12c
KSL – 82c +2c
NCM – 26.44 +25c
STO – 7.985 +25.5c
Interest Rates
We did see the invite from BPNG for the next GIS auction and the announcements will be made Wednesday 25th. The maturities on offer are from 3yr to 10 yrs. I do expect to seem more aggression in the 4 to 6yr area as not too many investors would be happy to hold longer dated stock at these levels with more pressure on the upside.
What we’ve been reading this week
ADB Maintains Growth Forecast for Asia and the Pacific
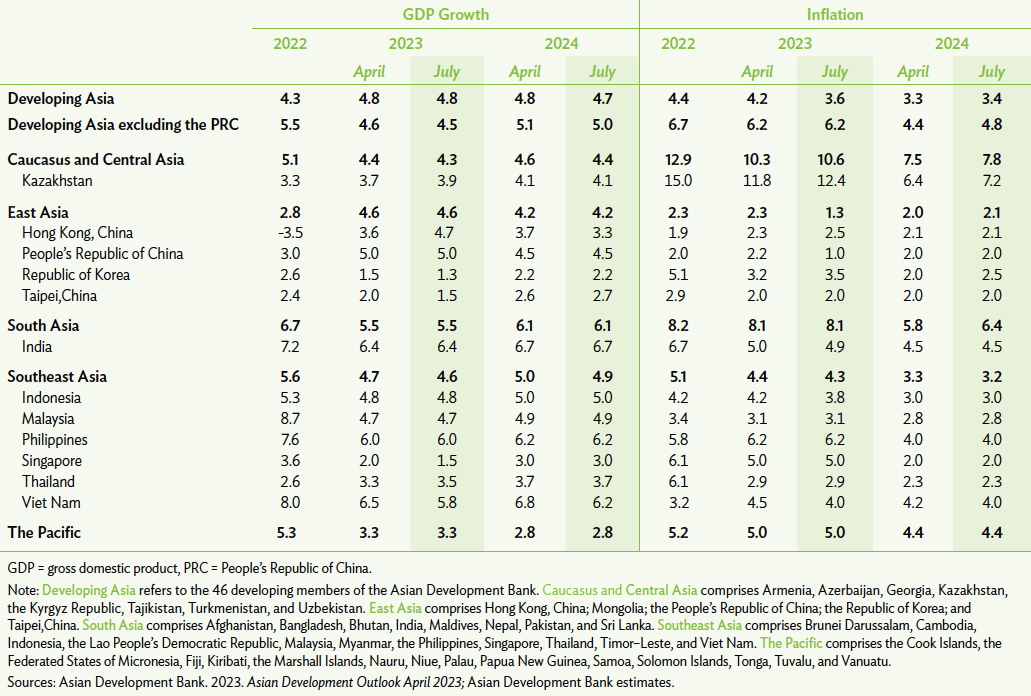
MANILA, PHILIPPINES (19 July 2023) — The Asian Development Bank (ADB) is maintaining its growth outlook for developing economies in Asia and the Pacific at 4.8% this year, as robust domestic demand continues to support the region’s recovery.
Inflation is expected to continue falling, approaching pre-pandemic levels as fuel and food prices decline, according to the Asian Development Outlook (ADO) July 2023, released today. Inflation in developing Asia is forecast at 3.6% this year, compared with an April forecast of 4.2%. The inflation outlook for 2024, meanwhile, is raised to 3.4% from an earlier estimate of 3.3%.
The reopening of the People’s Republic of China (PRC) is bolstering the region’s growth. The PRC’s economy is projected to expand 5.0% this year, unchanged from the April forecast, amid strong domestic demand in the services sector. However, demand for developing Asia’s exports of electronics and other manufactured goods is slowing, as monetary tightening drags on economic activity in major advanced economies. The region’s growth forecast for next year is marginally revised down to 4.7% from a 4.8% estimate in April.
“Asia and the Pacific continues to recover from the pandemic at a steady pace,” said ADB Chief Economist Albert Park. “Domestic demand and services activity are driving growth, while many economies are also benefiting from a strong recovery in tourism. However, industrial activity and exports remain weak, and the outlook for global growth and demand next year has worsened.”
ADB is maintaining its growth forecasts for most subregions in Asia and the Pacific. Exceptions include Southeast Asia, where the outlook is lowered to 4.6% this year and 4.9% next year, compared with April estimates of 4.7% and 5.0%, respectively. The forecast for Caucasus and Central Asia is revised down marginally to 4.3% from 4.4% for 2023, and to 4.4% from 4.6% in 2024.
ADB is committed to achieving a prosperous, inclusive, resilient, and sustainable Asia and the Pacific, while sustaining its efforts to eradicate extreme poverty. Established in 1966, it is owned by 68 members—49 from the region.
Oliver’s insights – seven key charts for investors to keep an eye on
Dr Shane Oliver – Head of Investment Strategy and Economics and Chief Economist, AMP Investments
Key points
– Shares are at risk of a short term pull back and volatility will likely remain high on central bank and recession risks.
– However, we remain reasonably upbeat on a 12-month view as falling inflation takes pressure off interest rates.
– Seven key charts worth keeping an eye on remain: global business conditions PMIs; inflation and our Inflation Indicators; unemployment and underemployment; inflation expectations; earnings revisions; the gap between earnings yields and bond yields; and the US dollar. So far so good.
Introduction
At the start of this year, we thought shares would have reasonable returns albeit it wouldn’t be smooth sailing given ongoing issues around inflation, interest rates, the risk of recession and geopolitics. So far so good. This note updates seven key charts we see as critical for the investment outlook.
Chart 1 – global business conditions PMIs
A big determinant of whether share markets can continue to move higher or resume the bear market in US and global shares that started last year, will be whether major economies slide into recession and, if so, how deep that is. Our assessment is that the risk of a mild recession is high (particularly in Australia), but that at least a deep recession should be avoided. Global business conditions indexes (PMIs) – which are surveys of purchasing managers at businesses – will be a key warning indicator.
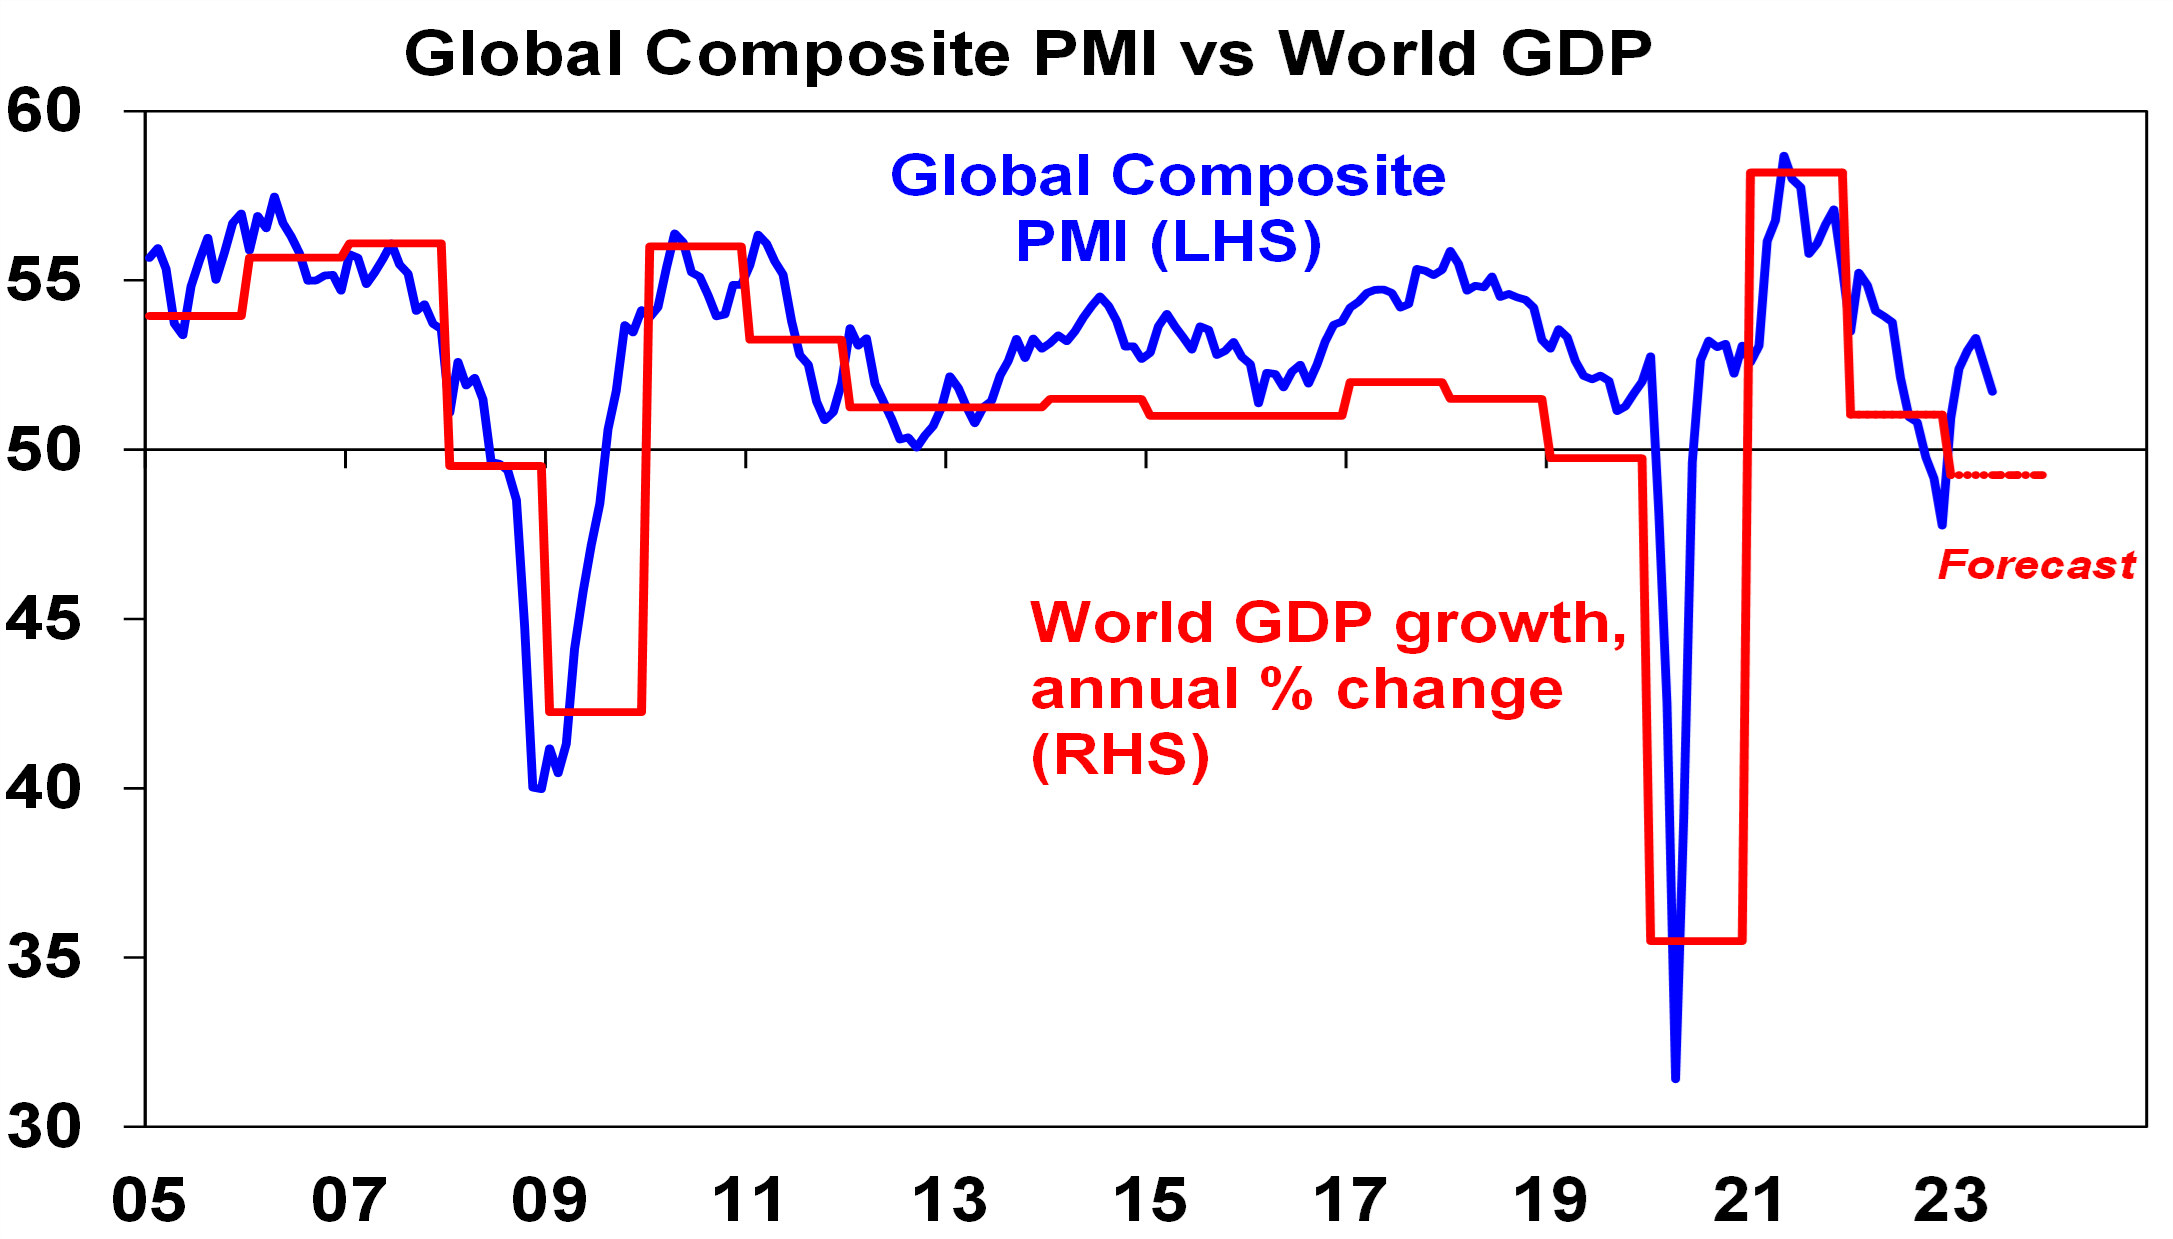
Source: Bloomberg, AMP
So far, they have proven resilient. While slowing again after a bounce – partly due to China – they are at levels consistent with okay global growth.
Chart 2 (and 2b) – inflation
Of course, a lot continues to ride on how far key central banks raise interest rates. And as has been the case for the last 18 months or so the path of inflation will play a key role in this. Over the last six months the news on this front has continued to improve with inflation rates in key countries rolling over. US inflation has now fallen from 9.1%yoy a year ago to 3% in June and our US Pipeline Inflation Indicator – reflecting a mix of supply and demand indicators – continues to point to a further decline. This reflects a combination of lower commodity prices, improved supply, lower transport costs and easing demand. Just as goods price inflation led on the way up, it’s now leading on the way down with services inflation rolling over as well. The Fed is likely to hike once more this month but the fall in inflation suggests that may be the peak with rate cuts next year.
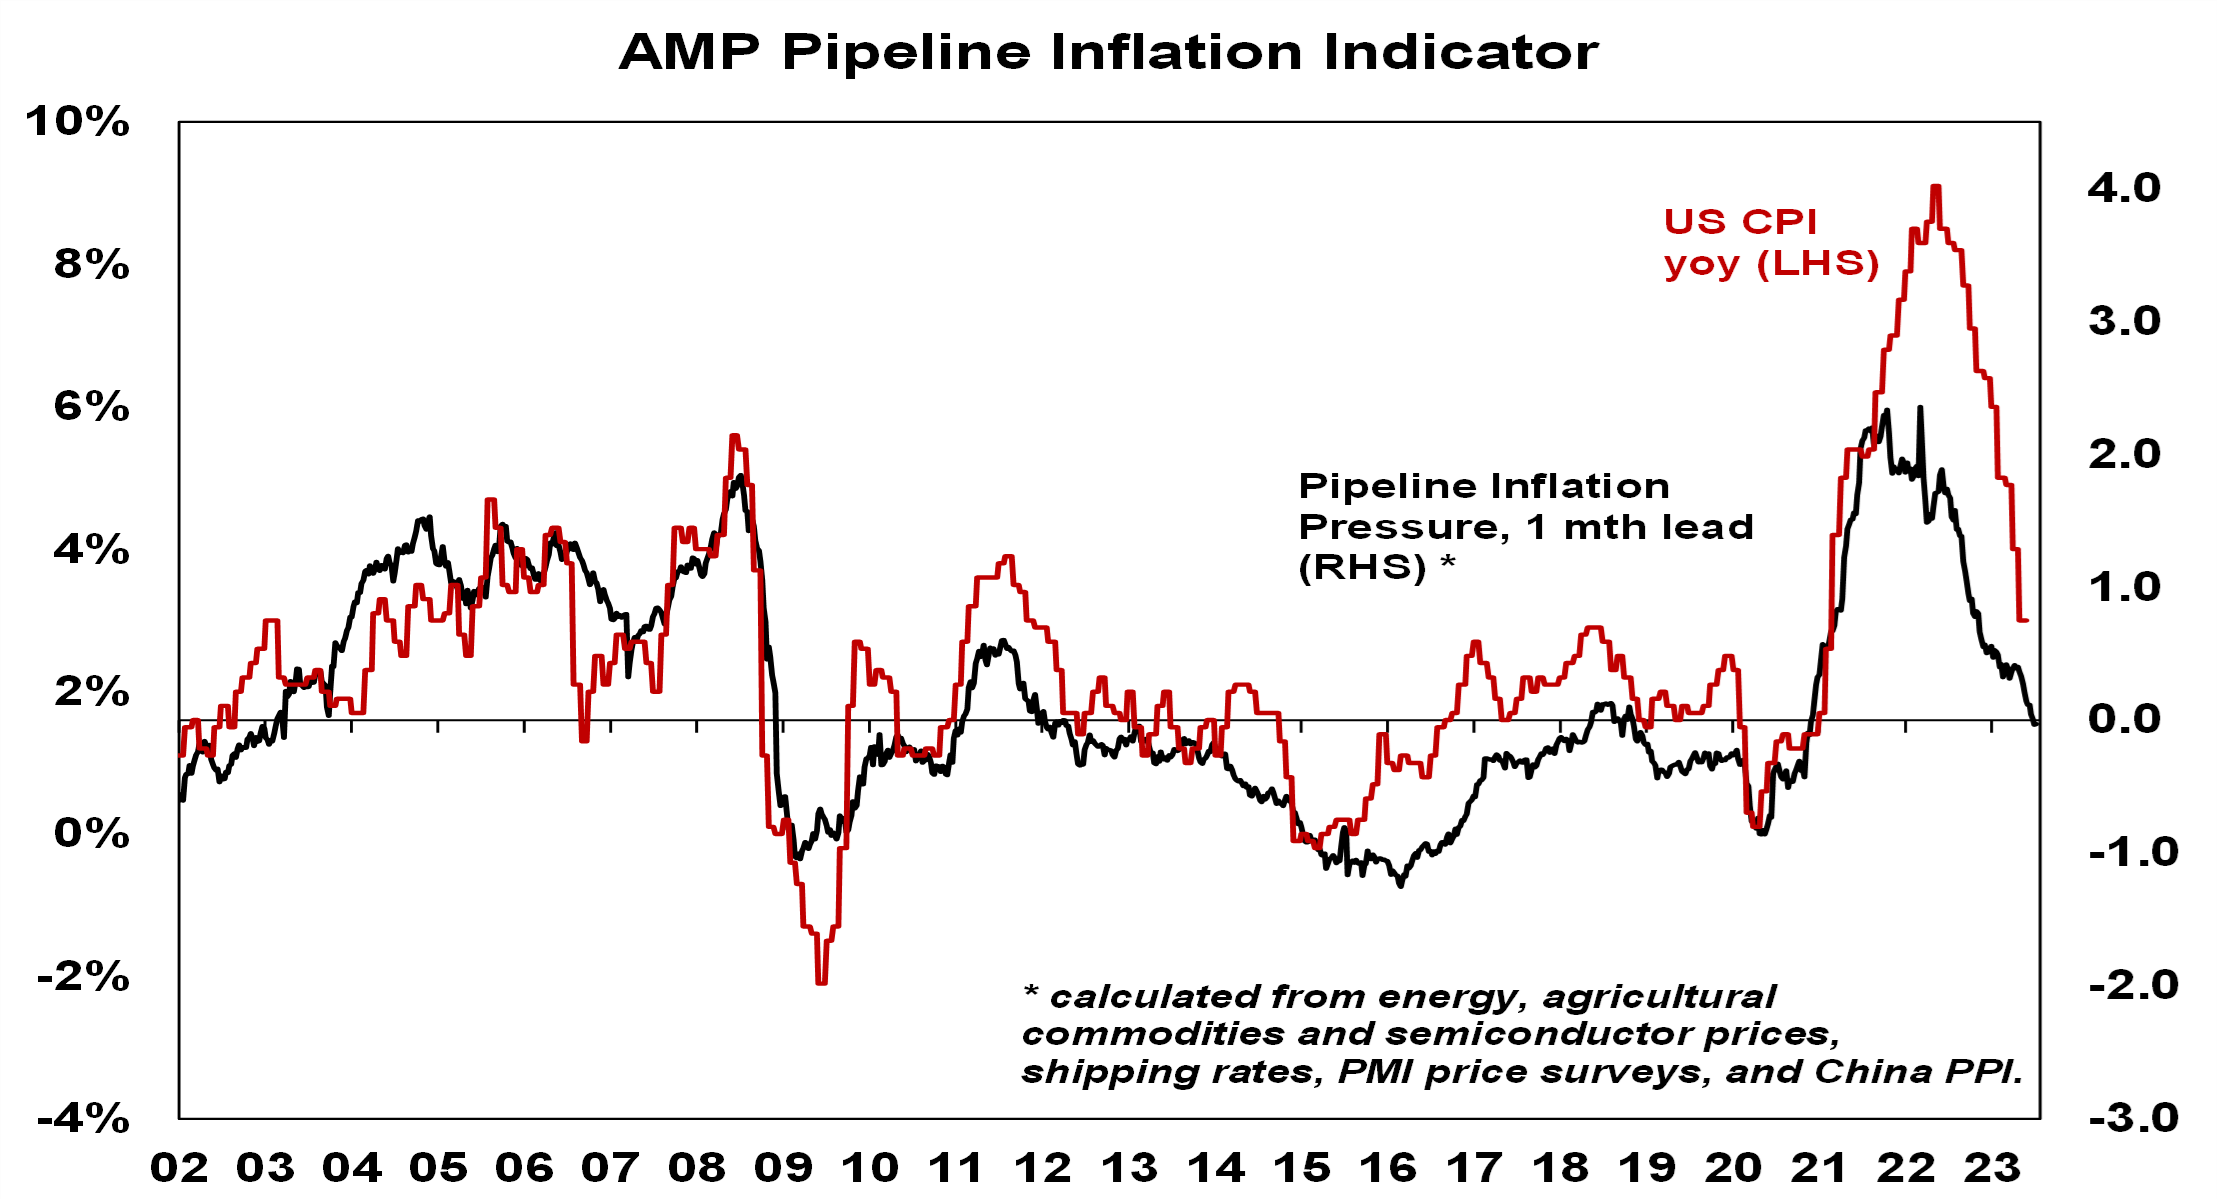
Source: Bloomberg, AMP
Australian inflation is lagging the US by 6 months, but our Australian Pipeline Inflation Indicator suggests inflation here will continue to fall. The RBA has started to soften its tightening bias & while we are allowing for a bit more on rates (given RBA worries about still high services inflation & the high risk of stronger wages growth), our assessment is that the RBA is either at or close to the top with rate cuts starting in February next year.
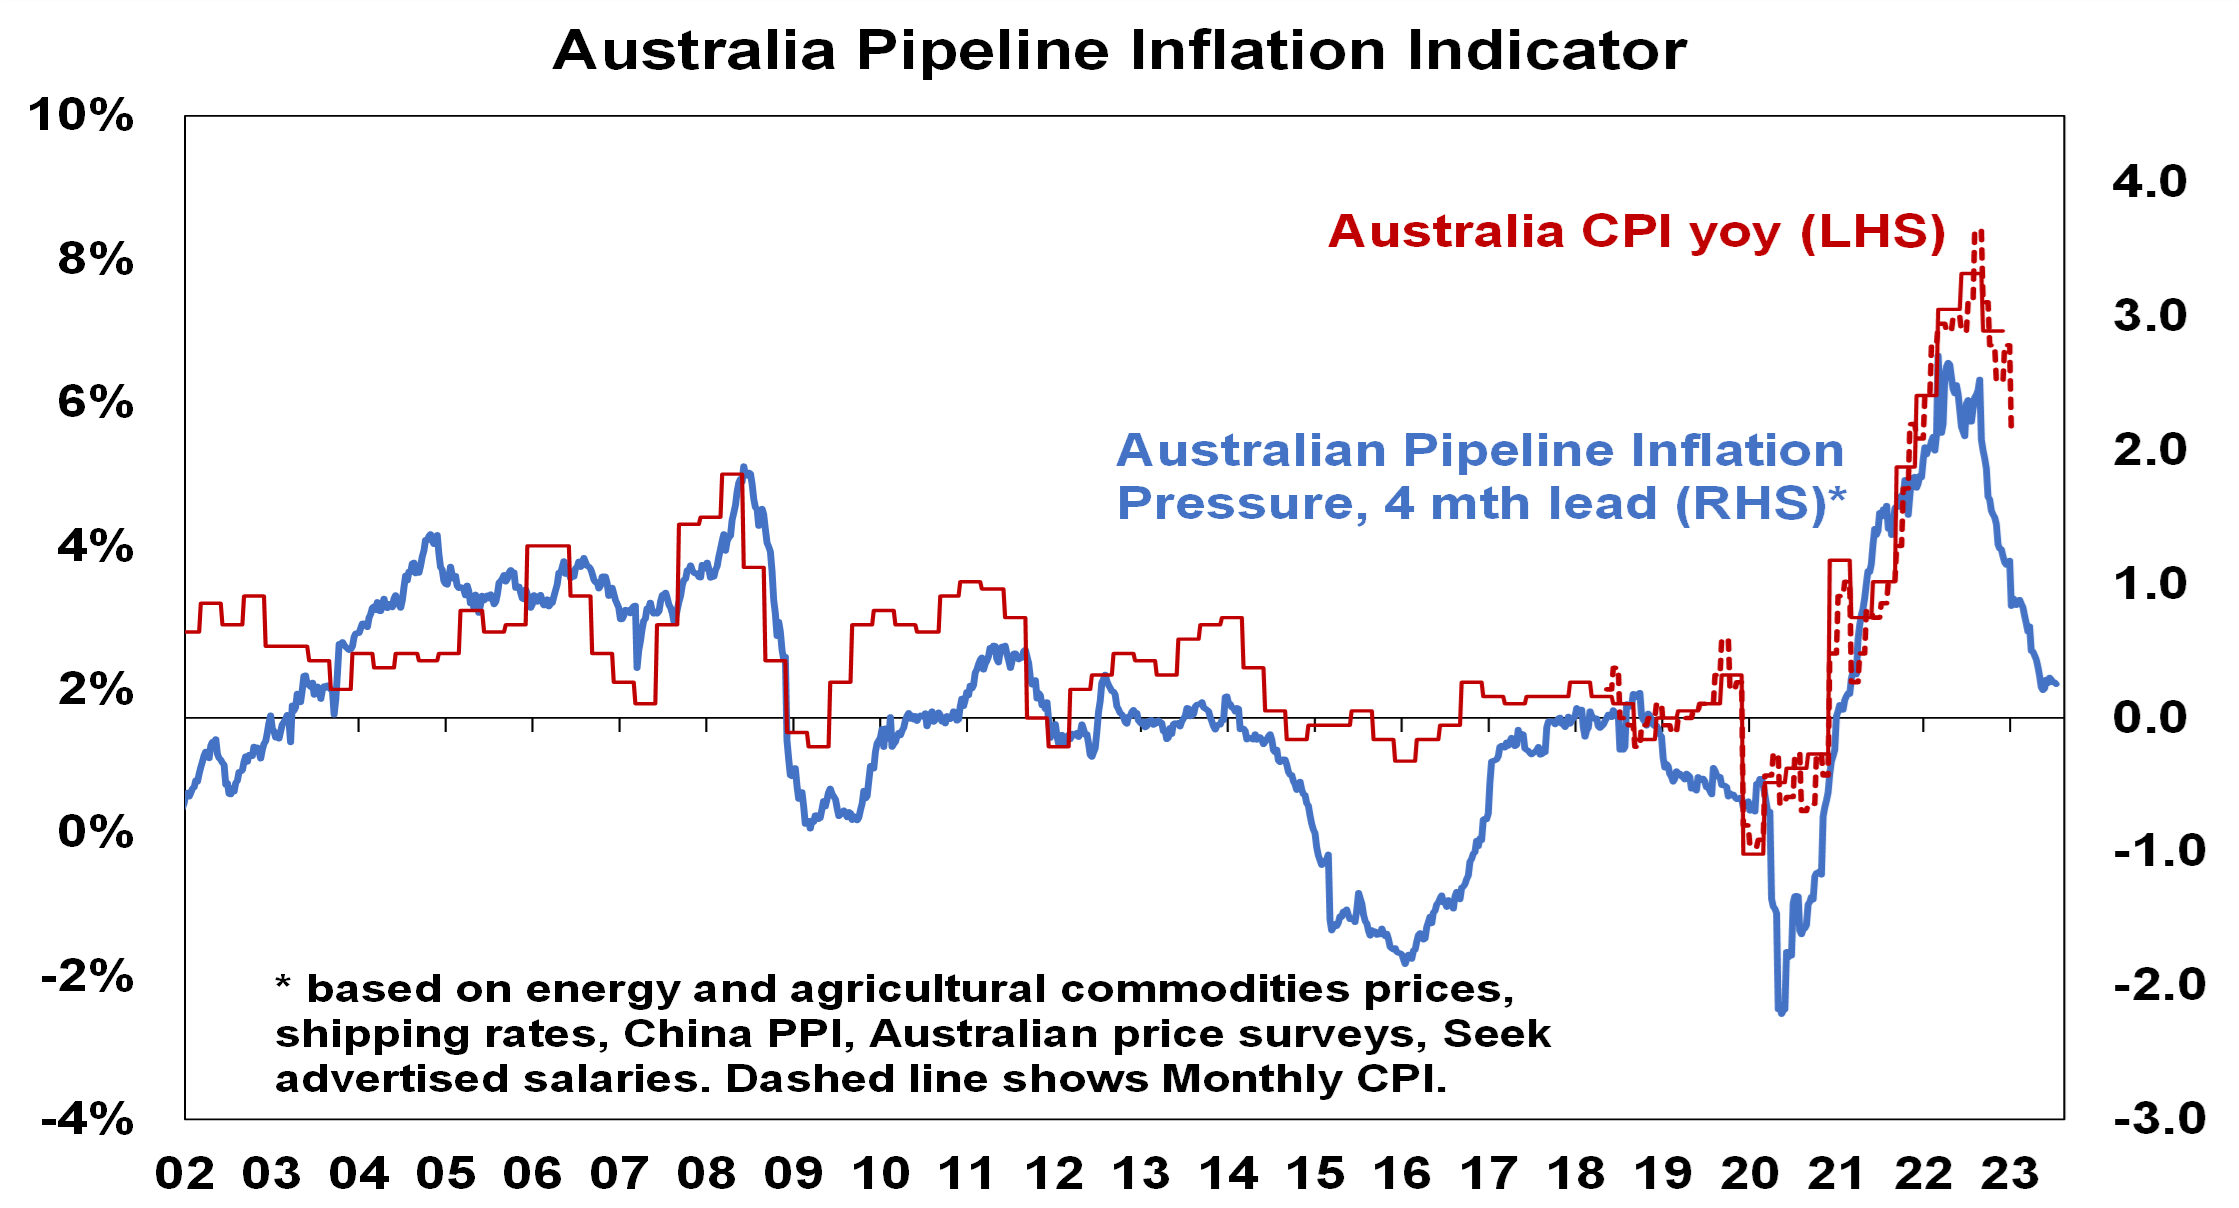
Source: Bloomberg, AMP
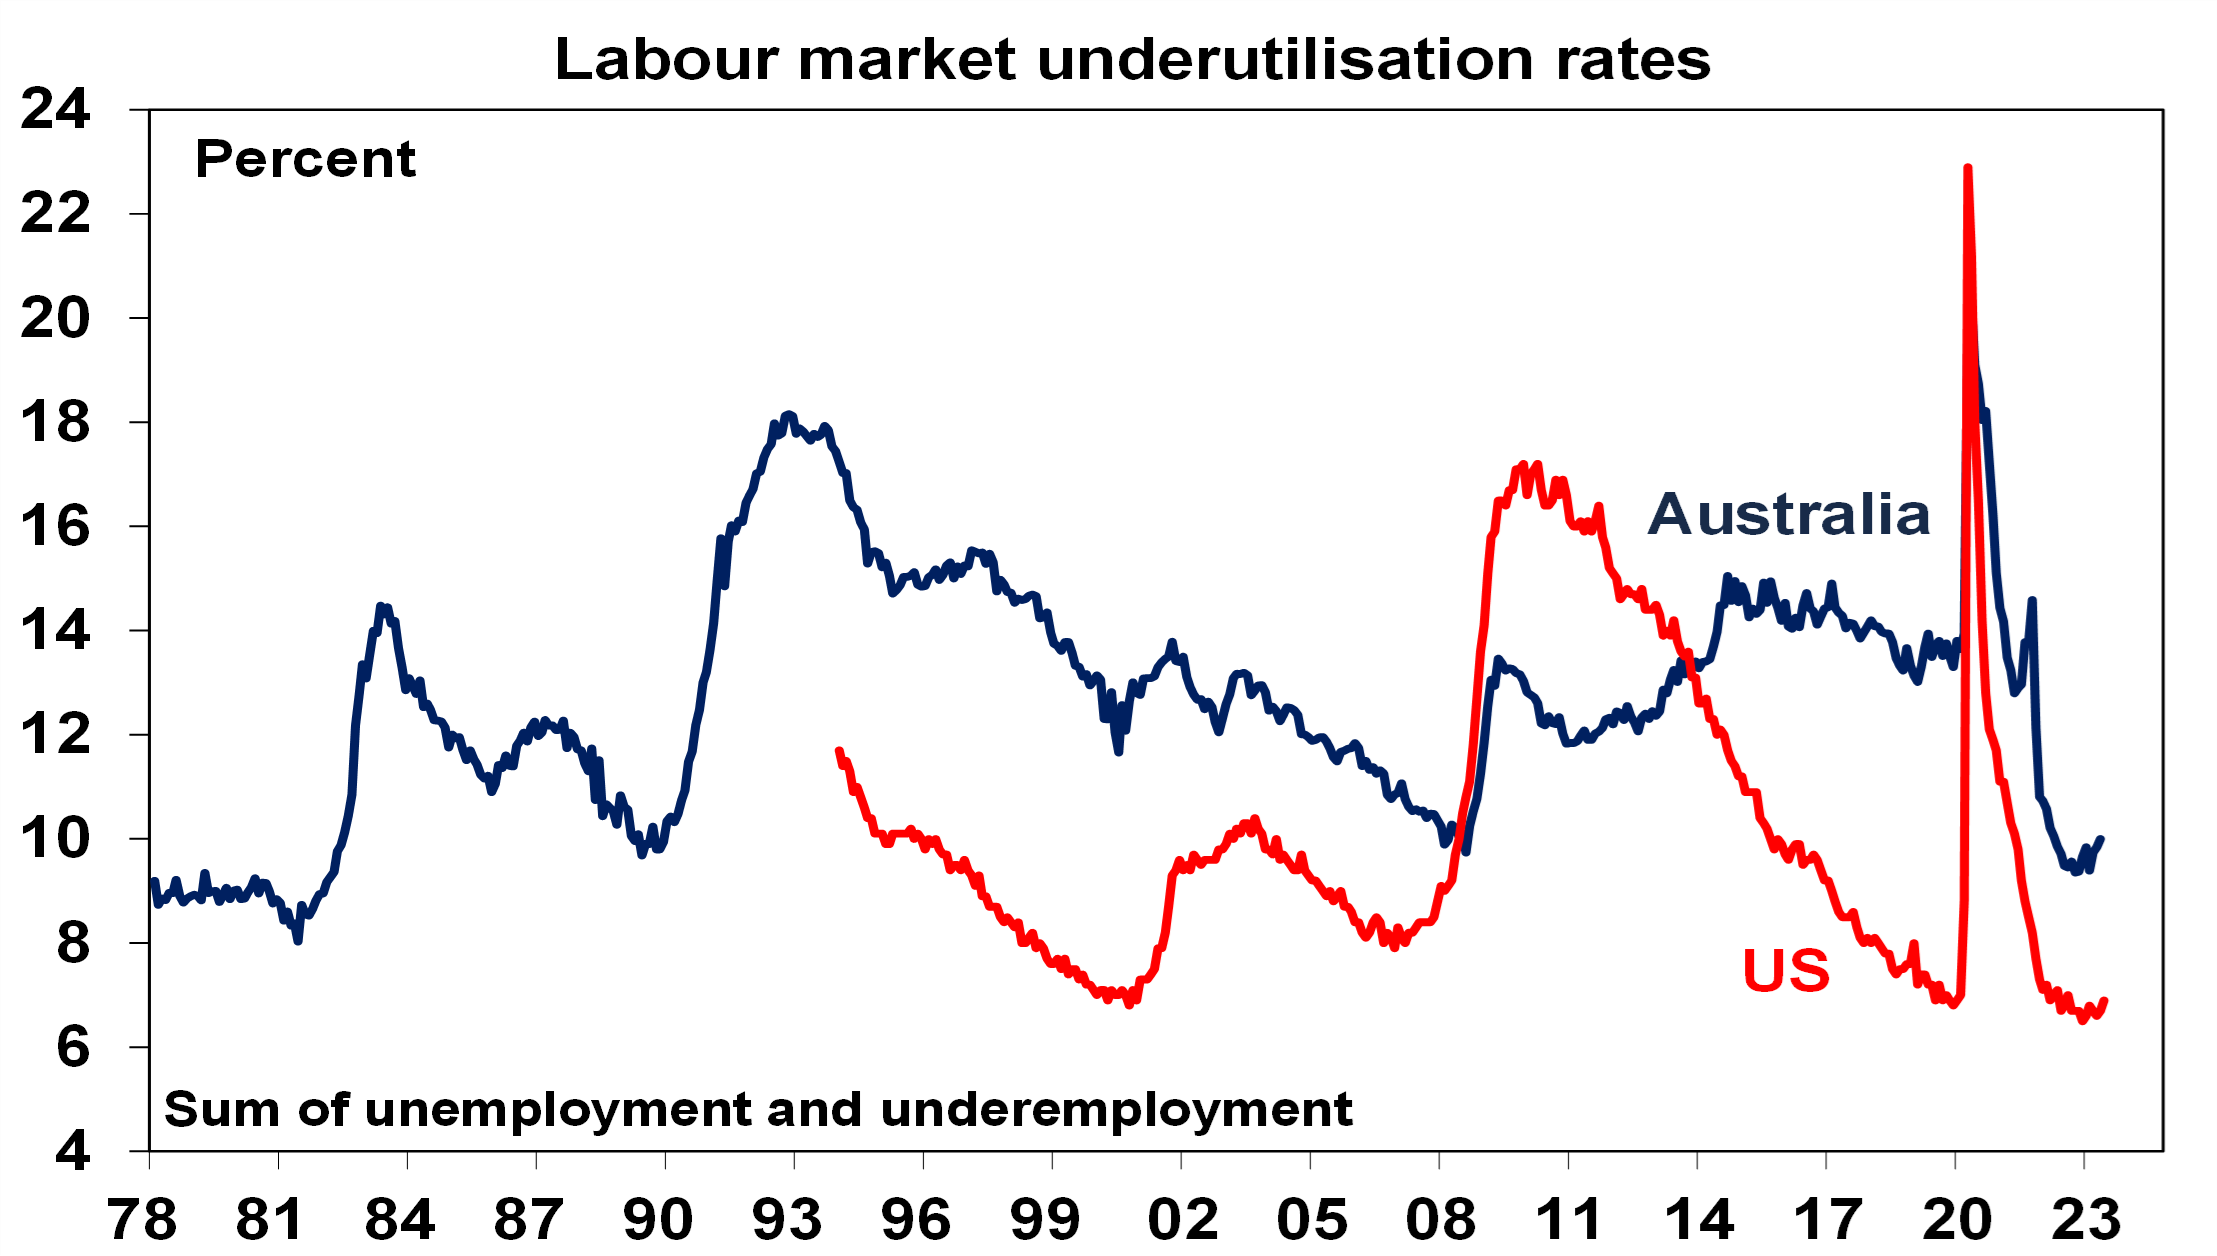
Chart 3 – unemployment and underemployment
Also critical is the tightness of labour markets as this will determine wages growth which has a big impact on services inflation. If wages growth accelerates too much in response to high inflation, it risks locking in high inflation with a wage-price spiral which would make it harder to get inflation down. Unemployment and underemployment are key indicators of whether this will occur or not. Both remain low in the US & Australia (putting upwards pressure on wages), but there is increasing evidence that labour markets are cooling. Wages growth is still rising in Australia (with the announcement effect of faster increases in minimum and award wages adding to this) but wages growth in the US looks to have peaked.
Source: Bloomberg, AMP
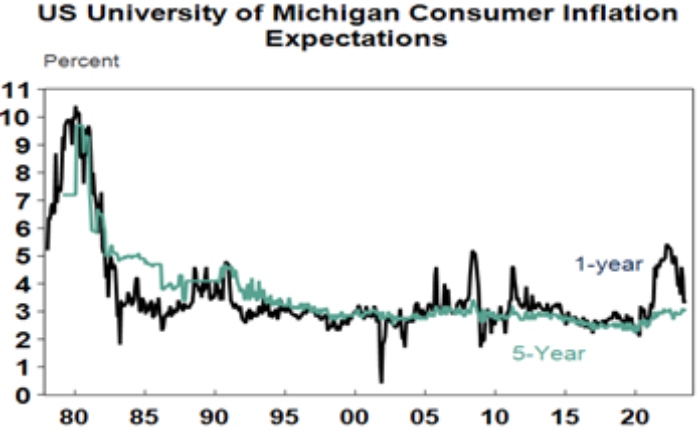
Chart 4 – longer term inflation expectations
The 1970s experience tells us the longer inflation stays high, the more businesses, workers and consumers expect it to stay high and then they behave in ways which perpetuate it – in terms of wage claims, price setting and tolerance for price rises. The good news is that short term (1-3 years ahead) inflation expectations have fallen sharply & longer-term inflation expectations remain in the low range they have been in for the last three decades. This is very different from 1980 when inflation expectations were around 10% and deep recession was required to get inflation back down.
Source: Macrobond, AMP
Chart 5 – earnings revisions
Consensus US and global earnings growth expectations for this year have been downgraded to around zero with a 10% rise next year and for Australia the consensus expects a 3% fall this financial year.
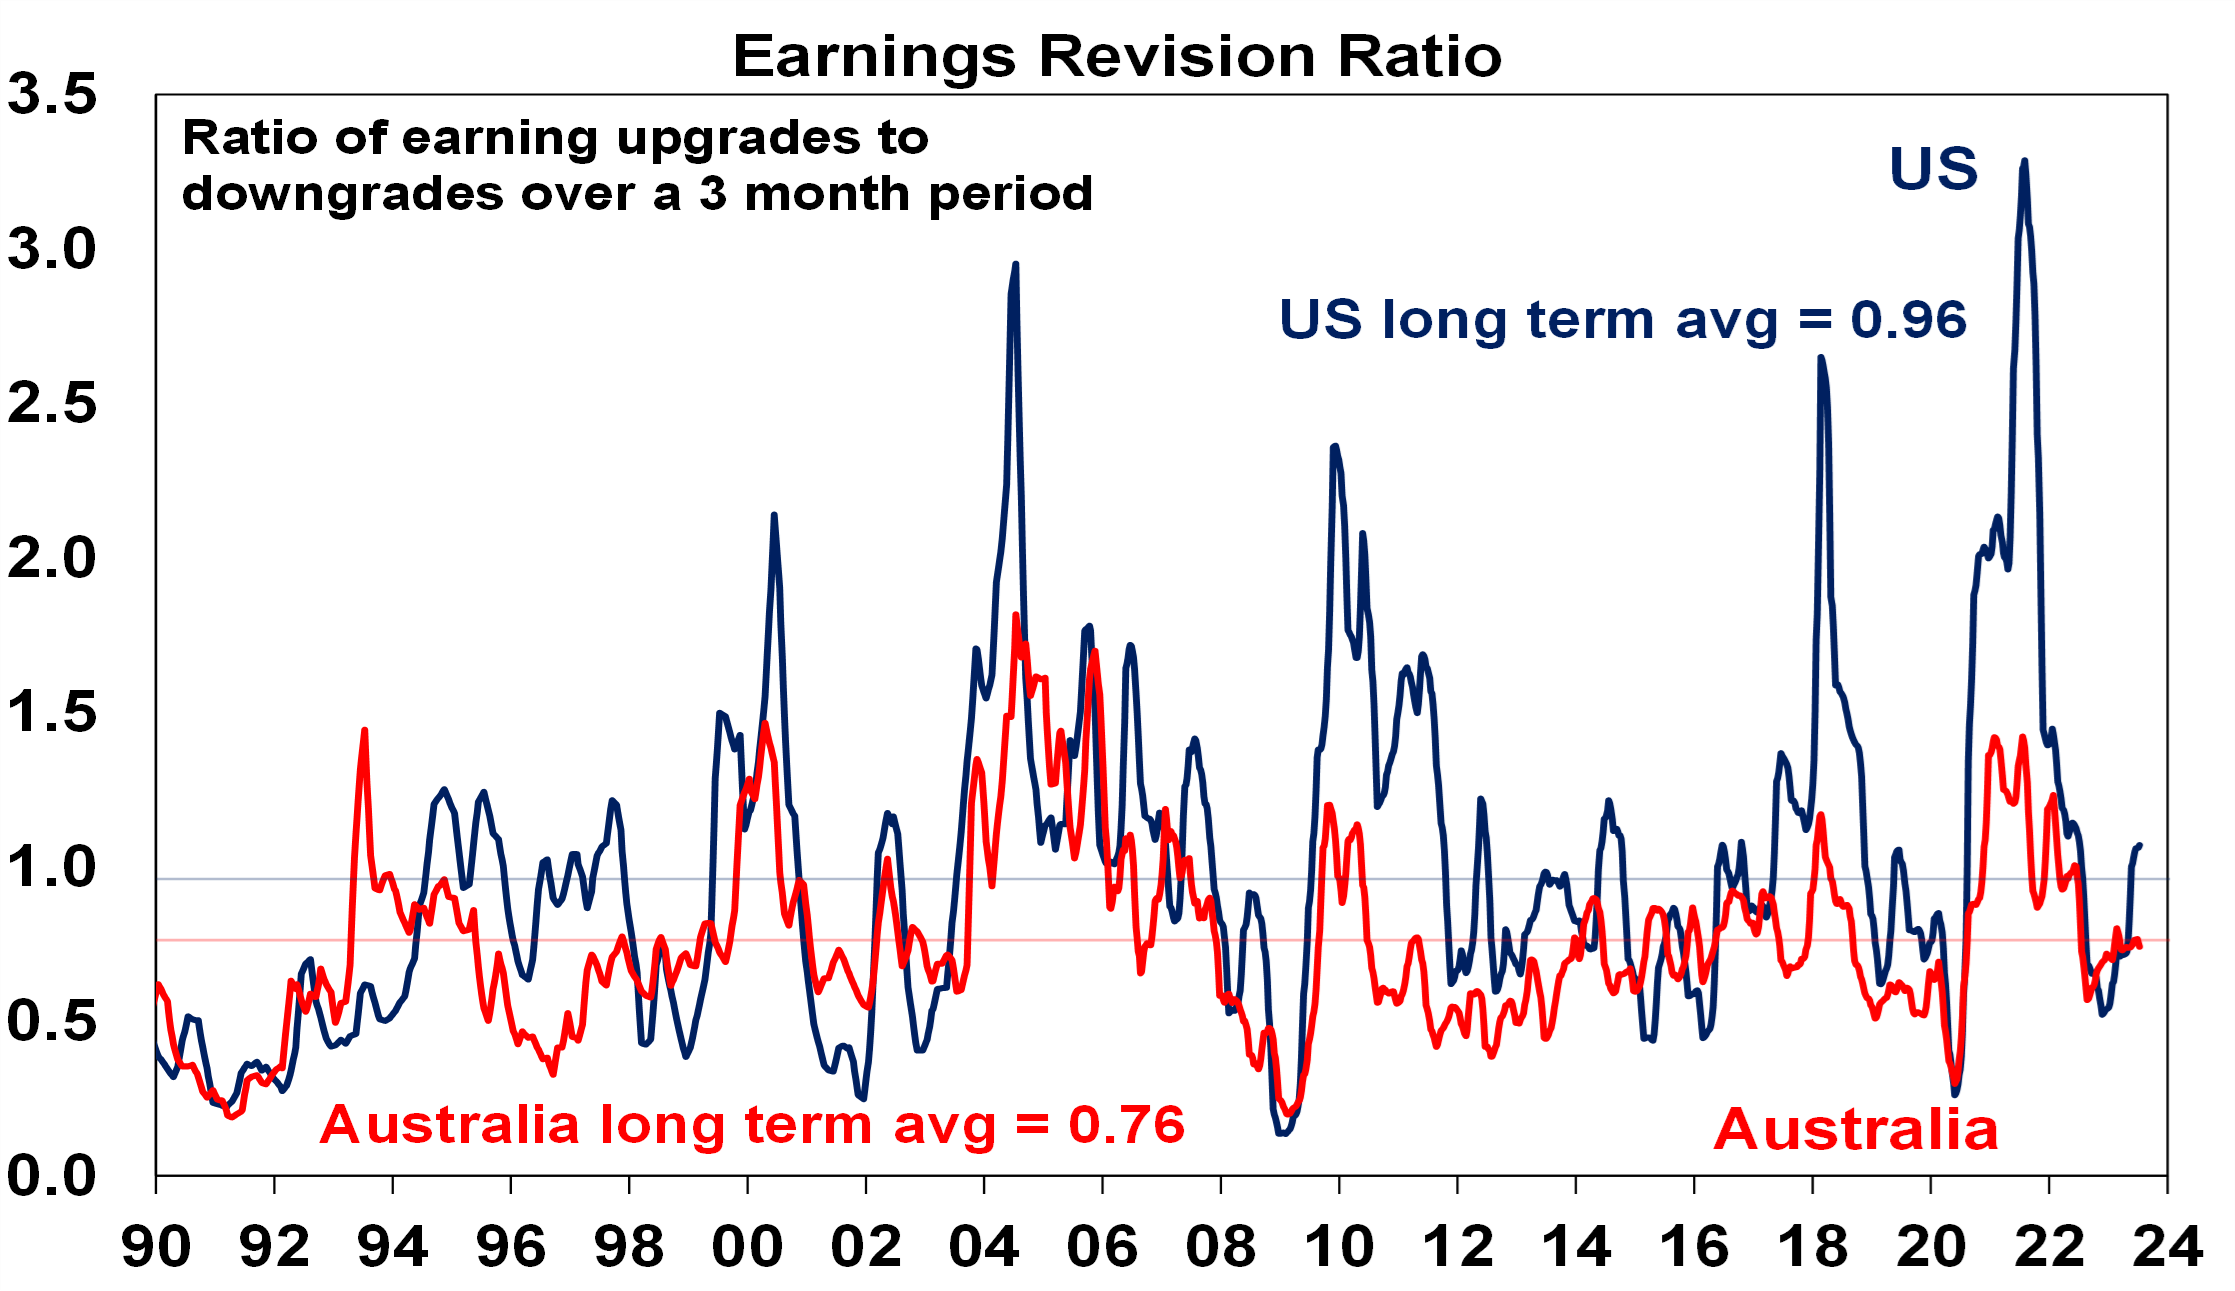
Source: Reuters, AMP
A recession resulting in an earnings slump like those seen in the early 1990s, 2001-03 in the US and 2008 would be the biggest risk but recently revisions to earnings expectations have been moving up.
Chart 6 – the gap between earnings and bond yields
Since 2020, rising bond yields have weighed on share market valuations. As a result, the gap between earnings yields and bond yields (which is a proxy for shares’ risk premium) has narrowed to its lowest since the GFC in the US and Australia. Compared to the pre-GFC period shares still look cheap relative to bonds, but this is not the case compared to the post GFC period suggesting valuations may be a bit of a constraint to share market gains as current uncertainties suggests investors may demand a risk premium over bonds similar to that seen post GFC as opposed to what was seen pre GFC. Australian share valuations look a bit more attractive than those in the US though helped by a higher earnings yield (or lower PEs). Ideally bond yields need to decline and earnings downgrades need to be limited.
Source: Reuters, AMP
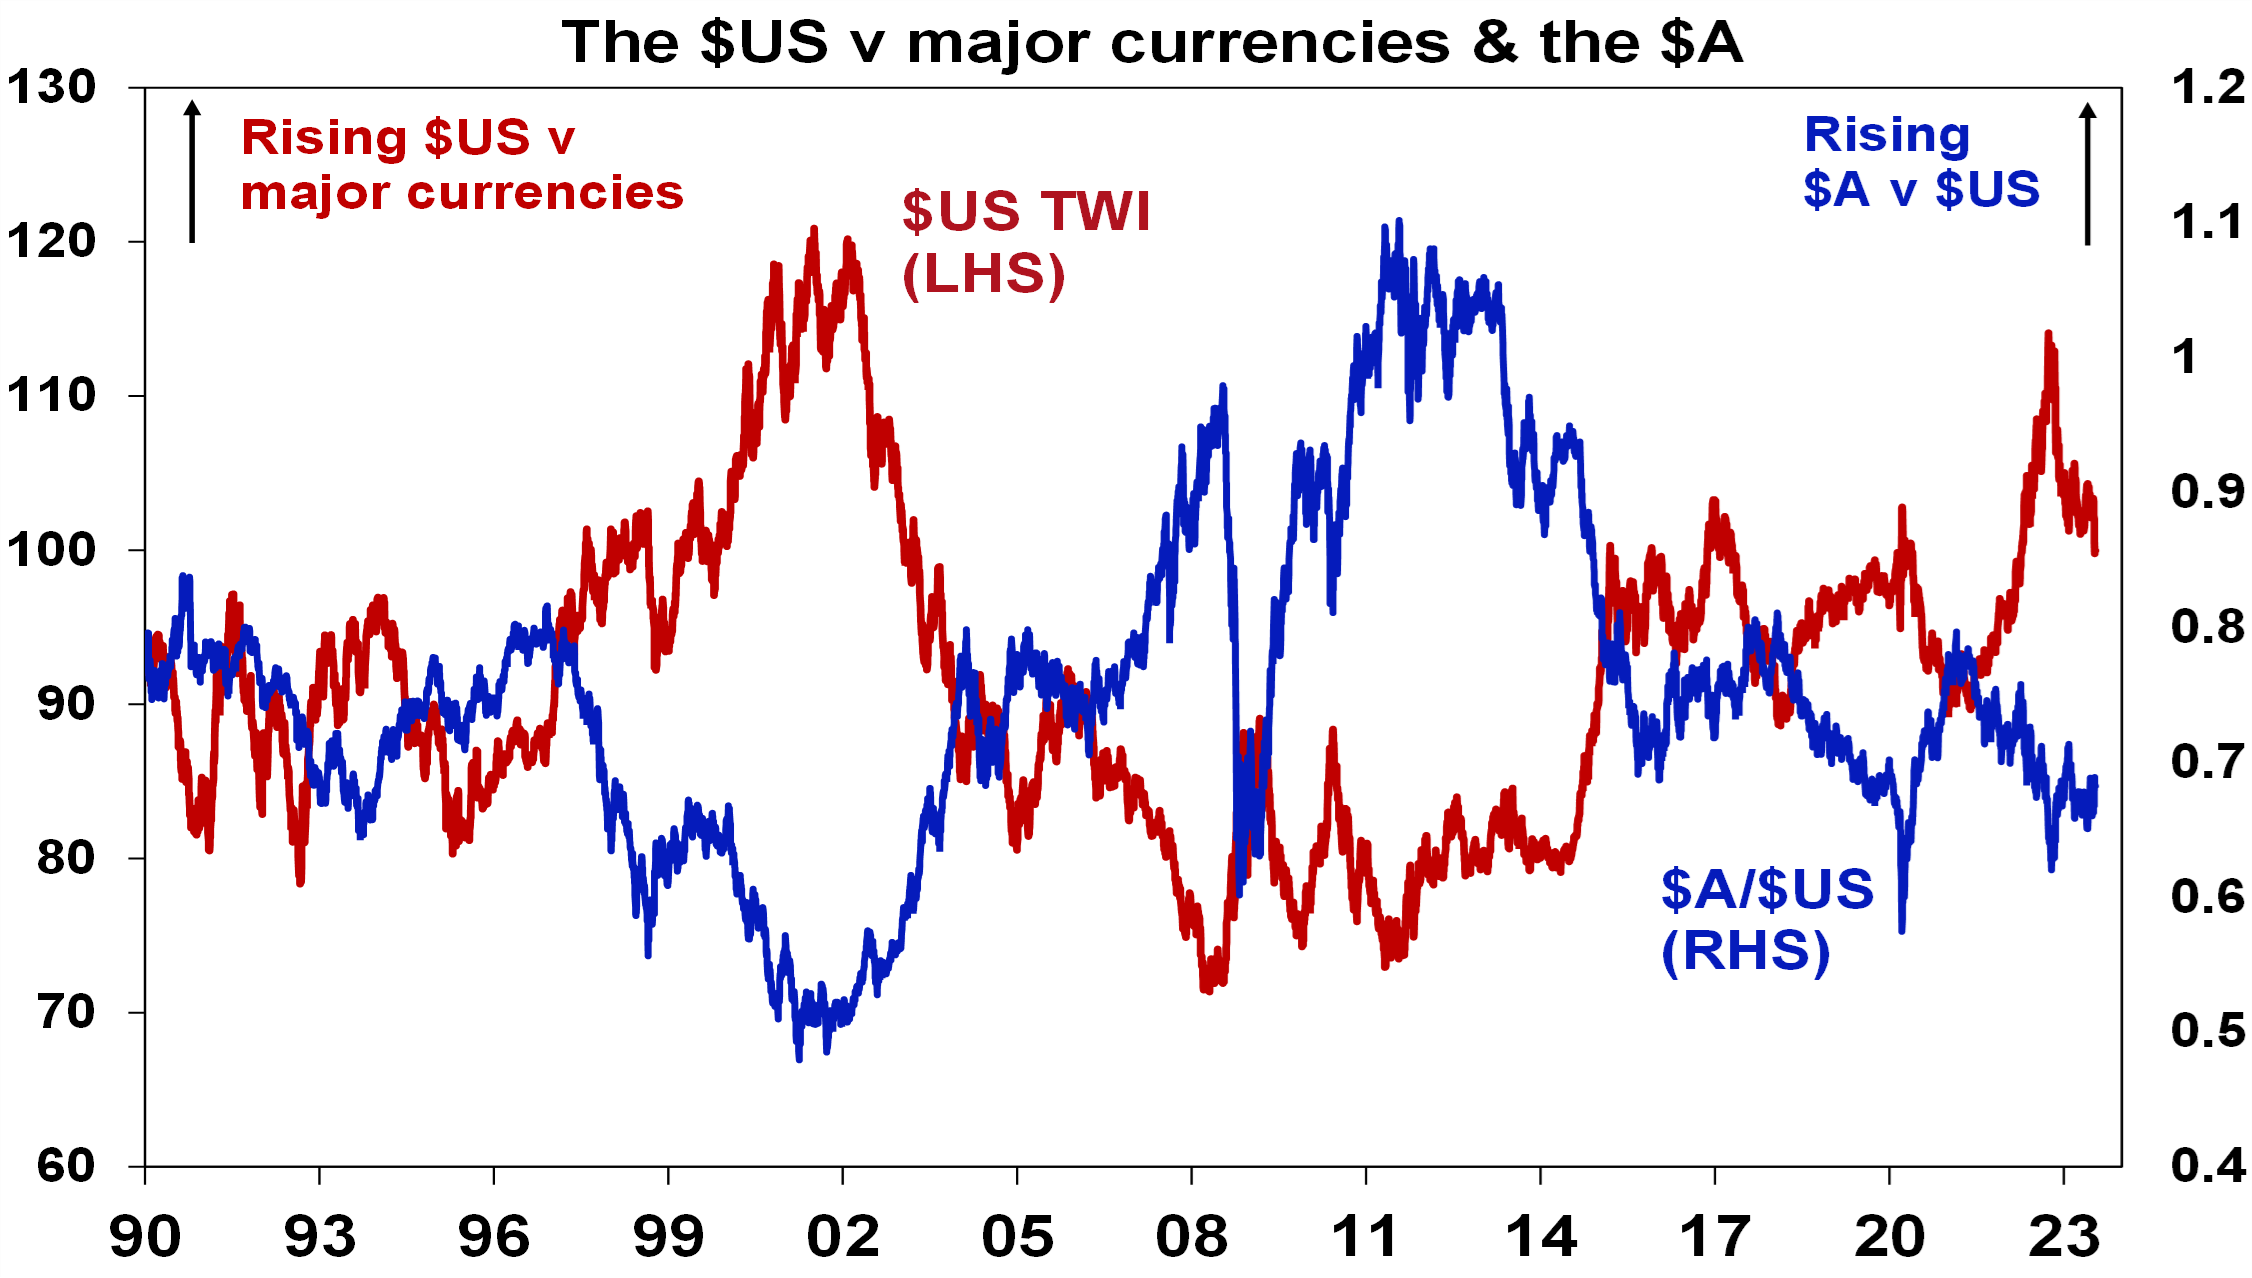
Chart 7 – the US dollar
Due to the relatively low exposure of the US economy to cyclical sectors (like manufacturing), the $US tends to be a “risk-off” currency. In other words, it goes up when there are worries about global growth and down when the outlook brightens. An increasing $US is also bad news for those with $US denominated debt in the emerging world. So, moves in it bear close watching as a key bellwether of the investment cycle. Last year the $US surged with safe haven demand in the face of worries about recession, war and aggressive Fed tightening. Since September though it has fallen back as inflation and Fed rate hike fears eased and geopolitical risks receded. And after stalling over the last six months, it’s since broken down again. A further downtrend in the $US would be a positive sign for investment markets this year, whereas a sustained new upswing would suggest they may be vulnerable. So far it’s going in the right direction.
Source: Bloomberg, AMP
What you need to know
While every care has been taken in the preparation of this article, neither National Mutual Funds Management Ltd (ABN 32 006 787 720, AFSL 234652) (NMFM), AMP Limited ABN 49 079 354 519 nor any other member of the AMP Group (AMP) makes any representations or warranties as to the accuracy or completeness of any statement in it including, without limitation, any forecasts. Past performance is not a reliable indicator of future performance. This document has been prepared for the purpose of providing general information, without taking account of any particular investor’s objectives, financial situation or needs. An investor should, before making any investment decisions, consider the appropriateness of the information in this document, and seek professional advice, having regard to the investor’s objectives, financial situation and needs. This article is solely for the use of the party to whom it is provided and must not be provided to any other person or entity without the express written consent AMP. This article is not intended for distribution or use in any jurisdiction where it would be contrary to applicable laws, regulations or directives and does not constitute a recommendation, offer, solicitation or invitation to invest.
The information on this page was current on the date the page was published. For up-to-date information, we refer you to the relevant product disclosure statement, target market determination and product updates available at amp.com.au.
Beyond Disclosures: What is the Direction of Travel for ESG Regulation

COMPANIES/ ESG REPORTING/ GUEST POSTS/ REGULATORS
Guest Post – Beyond Disclosures: What is the Direction of Travel for ESG Regulation – and How Could Evolving Regulatory Developments Impact your Business?
Mark Segal July 19, 2023
By Michelle T Davies, EY Global Sustainability Legal Services Leader, and Ben Taylor, EY Global Strategy and Markets Leader, Climate Change and Sustainability Services.
When the Task Force on Climate-Related Financial Disclosures (TCFD) launched in 2015, its primary aim was to prevent a potential meltdown in the financial markets. Policymakers were concerned that businesses might not be effectively managing their climate-related risks, which could potentially lead to economic losses and threaten global financial stability. Accordingly, the TCFD’s recommendations promoted better reporting of climate-related financial information. The logic was that disclosure would encourage businesses to identify the climate risks they faced, plan for them, and develop initiatives to mitigate those risks. Disclosure would also help investors to make more informed capital allocation decisions and channel investment toward sustainable assets.
The TCFD recommendations began as voluntary disclosure guidelines and are starting to be adopted more widely. In this respect, they echoed other sustainability reporting frameworks, such as those provided by the Global Reporting Initiative (GRI), the Carbon Disclosure Project (CDP), and the Sustainability Accounting Standards Board. The TCFD recommendations have rapidly either become part of the mandatory regulatory frameworks in many jurisdictions or are set to do so.
The global baseline of sustainability disclosures being developed by the International Sustainability Standards Board (ISSB), such as the recently released disclosures IFRS S1 and IFRS S2, builds on the whole set of voluntary standards, as does the EU Corporate Sustainability Reporting Directive (CSRD). Climate change is a core focus, but sustainability standards are going much further into wider nature issues, social considerations relating to workforce and communities, and internal governance and business conduct. Having clear global standards for disclosures also benefits investors, providing a framework to assess enterprise value and make commercial decisions, including allocating capital.
From compliance to action
Initially, some financial institutions and corporations tended to treat the TCFD recommendations in the same way they had treated pre-existing sustainability frameworks – essentially as a tick-box exercise. Although organizations recognized the need to source and collate accurate sustainability data, they viewed disclosure as being fundamentally about compliance and investor relations rather than transformation.
Over time, however, that compliance mindset has been challenged by unfolding regulatory developments and increasing stakeholder pressure, especially from investors, but also from customers and employees. As a result of some notable initiatives, including the CSRD and the UK’s Transition Plan Taskforce (TPT), company leadership teams are increasingly being held to account, not just on climate but also on other sustainability issues. It is not enough to simply make disclosures. Companies are expected to properly implement their climate commitments into action – for example, through transition plans.
This shift from compliance to action presents a whole new area of legal risk for companies – a risk that currently attracts little attention beyond the general counsel’s office. As companies’ key stakeholders gain better visibility of their transition plans, they should be able to track the company’s progress against the plan. What’s more, if stakeholders – such as banks or investors – can prove that they have suffered a financial loss from relying on this information, a potential legal liability can arise.
The EU has already proposed a draft law to combat greenwashing, requiring companies that make environmental claims about their products or services to abide by minimum norms when substantiating these claims. The law aims to provide legal certainty around environmental claims and will facilitate enforcement activities around claims made.
At present, the real economy is still catching up with the shift that is taking place, however. EY research has found that just 5% of FTSE 100 businesses surveyed disclosed transition plans that would be sufficiently detailed to meet the UK government’s TPT Framework guidance and have started to put these plans into action.
Key considerations for companies
Going forward, companies will likely experience far greater scrutiny over their environmental, social and governance (ESG) performance from a wide range of stakeholders, including their auditors, banks, customers, investors, and insurers. This will put them under pressure to be genuinely transparent and to manage their data in more sophisticated ways. In due course, they also will likely need third parties to provide them with accurate data so that they can calculate their scope three emissions (emissions that arise from their value chain).
There are several ways in which your company can respond to the demands of the evolving ESG regulatory landscape. If it has not already done so, your company should consider undertaking a baseline assessment of its current carbon footprint and the climate risks facing the business. Then it will be able to set targets and metrics, and decide how it will measure and communicate progress.
First, ensure you provide genuine visibility to your key stakeholders as you develop your plans, regularly engaging with them around transition. For example, a bank or an insurer may use your transition plan when pricing risk. But if you fail to update – or deliver on – your plan, you are likely to find that your banks and insurers will want to change the terms of their engagement with your organization, to better align their pricing and their risk. The interplay between contractual obligations and the representations made by a transition plan will be critical.
Second, communication and transparency are essential, given that transitioning to net zero is not a linear process. To green its business, a company may need to invest in carbon-intensive projects in the short term, which reduces its carbon emissions over the longer term. It may buy and sell businesses, decommission assets, and launch new sustainability initiatives. What’s more, it will likely need to report on this process in a reliable and consistent way – which is not easy, despite the move toward more standardized frameworks.
Inevitably market dynamics will change over time, necessitating changes to the plan. To maintain positive stakeholder engagement, it is essential to create visibility and engagement around any changes – this is about risk management and how to generate value from those changes. A prerequisite to maximizing value from the plan will likely be to ensure that it is understood by those with the ability to impact value in an organization.
Governance is also key. There are various models for providing governance around ESG, from overall board-level accountability through to sustainability committees and working groups. A vital element of governance is the overall accountability framework in the sense of who within the business has responsibility for delivering on a particular target and considering whether you have their buy-in. If you make someone accountable for delivering on a target, they should believe that target is realistic and attainable.
But accountability for delivering ESG goes well beyond individual targets. Organizations may potentially limit themselves if they “box off” sustainability to certain people or departments. For a transition plan to work, it needs to be embedded across the entire organization. Sustainability should be part of the company’s DNA – something every individual understands so that they are clear on how their behavior can have a positive or negative impact.
The finance function is critical to the governance process. Not only can it verify that the reported numbers are right; it can also ensure that sustainability targets are feasible from a financial perspective. Certain targets can be economically unviable because the technology needed to achieve them is not yet available at scale. For that reason, companies should prioritize value-led sustainability – sustainability initiatives that don’t just sound impressive but deliver real financial returns. Returns linked to cost are probably the lowest-hanging fruit – particularly costs that are priced on risk, such as insurance or bank debt.
Finally, it is crucial to operationalize sustainability throughout your business. This is much easier to achieve if you do not “box off” sustainability. The objective is for every contracting framework and process to be fit for purpose and future-proofed from a sustainability perspective. To achieve this objective, you should consider due diligence, employee engagement, mergers and acquisitions strategy and terms, supply chain management, tax structuring, and technology deployment, plus many more frameworks and processes besides – the list can go on and on. Real sustainability is about creating long-term value, which requires an element of horizon-scanning to assess what will be perceived as valuable within the relevant investment timeframe. It also requires a different mindset – recognizing that what may have been a “nice to have” approach or arrangement now needs to be legally enforceable.
Regulation is becoming a driver of real transition, both at a financial institution level and a real-economy level. By bringing visibility to companies’ transition plans, regulation helps stakeholders to properly assess the risks of engagement with a particular organization so that they can adapt the terms of their engagement or exit the relationship if required. Already, financial institutions are making it clear that they will not invest in companies that treat sustainability reporting and transition plans merely as a tick-box exercise. The shift away from ESG compliance to real transformation is happening – and it’s happening now.
Disclaimer:
The views reflected in this article are the views of the authors and do not necessarily reflect the views of the global EY organization or its member firms. This material has been prepared for general informational purposes only and is not intended to be relied upon as accounting, tax or other professional advice. Please refer to your advisors for specific advice.
I hope you have enjoyed the report this week. Please feel free to reach out if you would like more information.
Regards,
Head, Fixed Interest and Superannuation
JMP Securities
Level 1, Harbourside West, Stanley Esplanade
Port Moresby, Papua New Guinea
Mobile (PNG):+675 72319913
Mobile (Int): +61 414529814