2 October, 2023
Hello and welcome to this week’s JMP Report
Last week was a quiet week on the equity front with only 3 stocks trading on the local market. BSP traded 5,738 shares, closing 13t at K13.41, KSL traded 26,150 shares closing steady at K2.41 and KAM traded 22,065 shares closing steady at K0.90.
WEEKLY MARKET REPORT | 24 September, 2023 – 29 September, 2023
| STOCK | QUANTITY | CLOSING PRICE | CHANGE | % CHANGE | 2022 FINAL DIV | 2023 INTERIM | YIELD % | EX-DATE | RECORD DATE | PAYMENT DATE | DRP | MARKET CAP |
| BSP | 5,738 | 13.41 | 0.13 | 0.97 | K1.4000 | K0.370 | 13.33 | FRI 22 SEPT 2023 | MON 25 SEPT 2023 | FRI 13 OCT 2023 | NO | 5,317,971,001 |
| KSL | 26,150 | 2.41 | – | 0.00 | K0.1610 | K0.097 | 10.75 | WED 6 SEPT 2023 | THU 7 SEPT 2023 | THU 5 OCT 2023 | NO | 64,817,259 |
| STO | 0 | 19.21 | – | 0.00 | K0.5310 | K0.314 | 4.42 | MON 28 AUG 2023 | TUE 29 AUG 2023 | THU 28 SEPT 2023 | – | – |
| KAM | 22,065 | 0.90 | – | 0.00 | – | K0.12 | 13.33 | TUE 19 SEP 2023 | WED 20 SEP 2023 | THU 19 SEP 2023 | YES | 49,891,306 |
| NCM | 0 | 75.00 | – | 0.00 | USD$1.23 | K0.719 | 2.60 | FRI 18 AUG 2023 | MON 21 AUG 2023 | MON 18 SEPT 2023 | – | 33,774,150 |
| NGP | 0 | 0.69 | – | 0.00 | – | – | – | – | – | – | – | 32,123,490 |
| CCP | 0 | 2.05 | – | 0.00 | K0.123 | K0.110 | 11.51 | FRI 24 MAR 2023 | WED 29 MAR 2023 | FRI 5 MAY 2023 | YES | 569,672,964 |
| CPL | 0 | 0.79 | – | 0.00 | K0.02 | – |
2.50 |
WED 22 MAR 2023 | THU 30 MAR 2023 | THU 30 JUL 2023 | – | 195,964,015 |
Dual listed Stock PNGX/ASX
BFL – 5.15 -7c
KSL – 0.785 -0.05c
NCM = 24.52 +2.31
STO – 7.90 +26c
The Order Book is a nett buyer of BSP, STO and KSL
Interest Rates
In the interest rate market, the Central Bank continues to manage the current Monetary Policy statement, soaking up liquidity and taking 1.529b out of the market by offering 7day money at 2%.
In the longer end we saw the 364 day TBill auction raise 290mill at 3.09% leaving the market oversubscribed by 64mill
Other Assets of Interest
Silver 22.45 – 1.35
Gas 2.93 +5c
Platinum – 915 -18.20
Bitcoin 22,178 +2.54%
Ethereum 1,677 +5.62%
PAX Gold 1,868 -2.368%
What we’ve been reading this week
For what it’s worth: why and what you pay for an investment is a key driver of its return…and how do valuations look now?
Dr Shane Oliver – Head of Investment Strategy and Economics and Chief Economist, AMP Investments
Key points
– Starting point valuations – like yields and price to earnings ratios – are key drivers of medium-term investment returns.
– For growth assets it’s often more complicated, with the level of interest rates playing a big role.
– At present, valuation starting points for term deposits and bonds have improved. For shares they suggest constrained return potential from US shares but are better for Australia.
Introduction
It’s logical that the cheaper you buy an asset the higher its prospective return might be. However, this is frequently forgotten with investors often tempted to project recent returns into the future regardless of valuations. A valuation measure for an asset is basically a guide to whether it’s expensive or cheap. This note looks at the main issues.
It’s relatively simple for cash and bonds
An obvious example of where the starting point valuation matters critically is cash. If the interest rate on offer from a term deposit rate is low as was the case into early last year when rates were 0.5% or less then it means pretty poor returns. Recently term deposit rates have increased with the RBA cash rate and so are offering a more attractive return potential, albeit they are still down from levels around 6-7% in 2010.
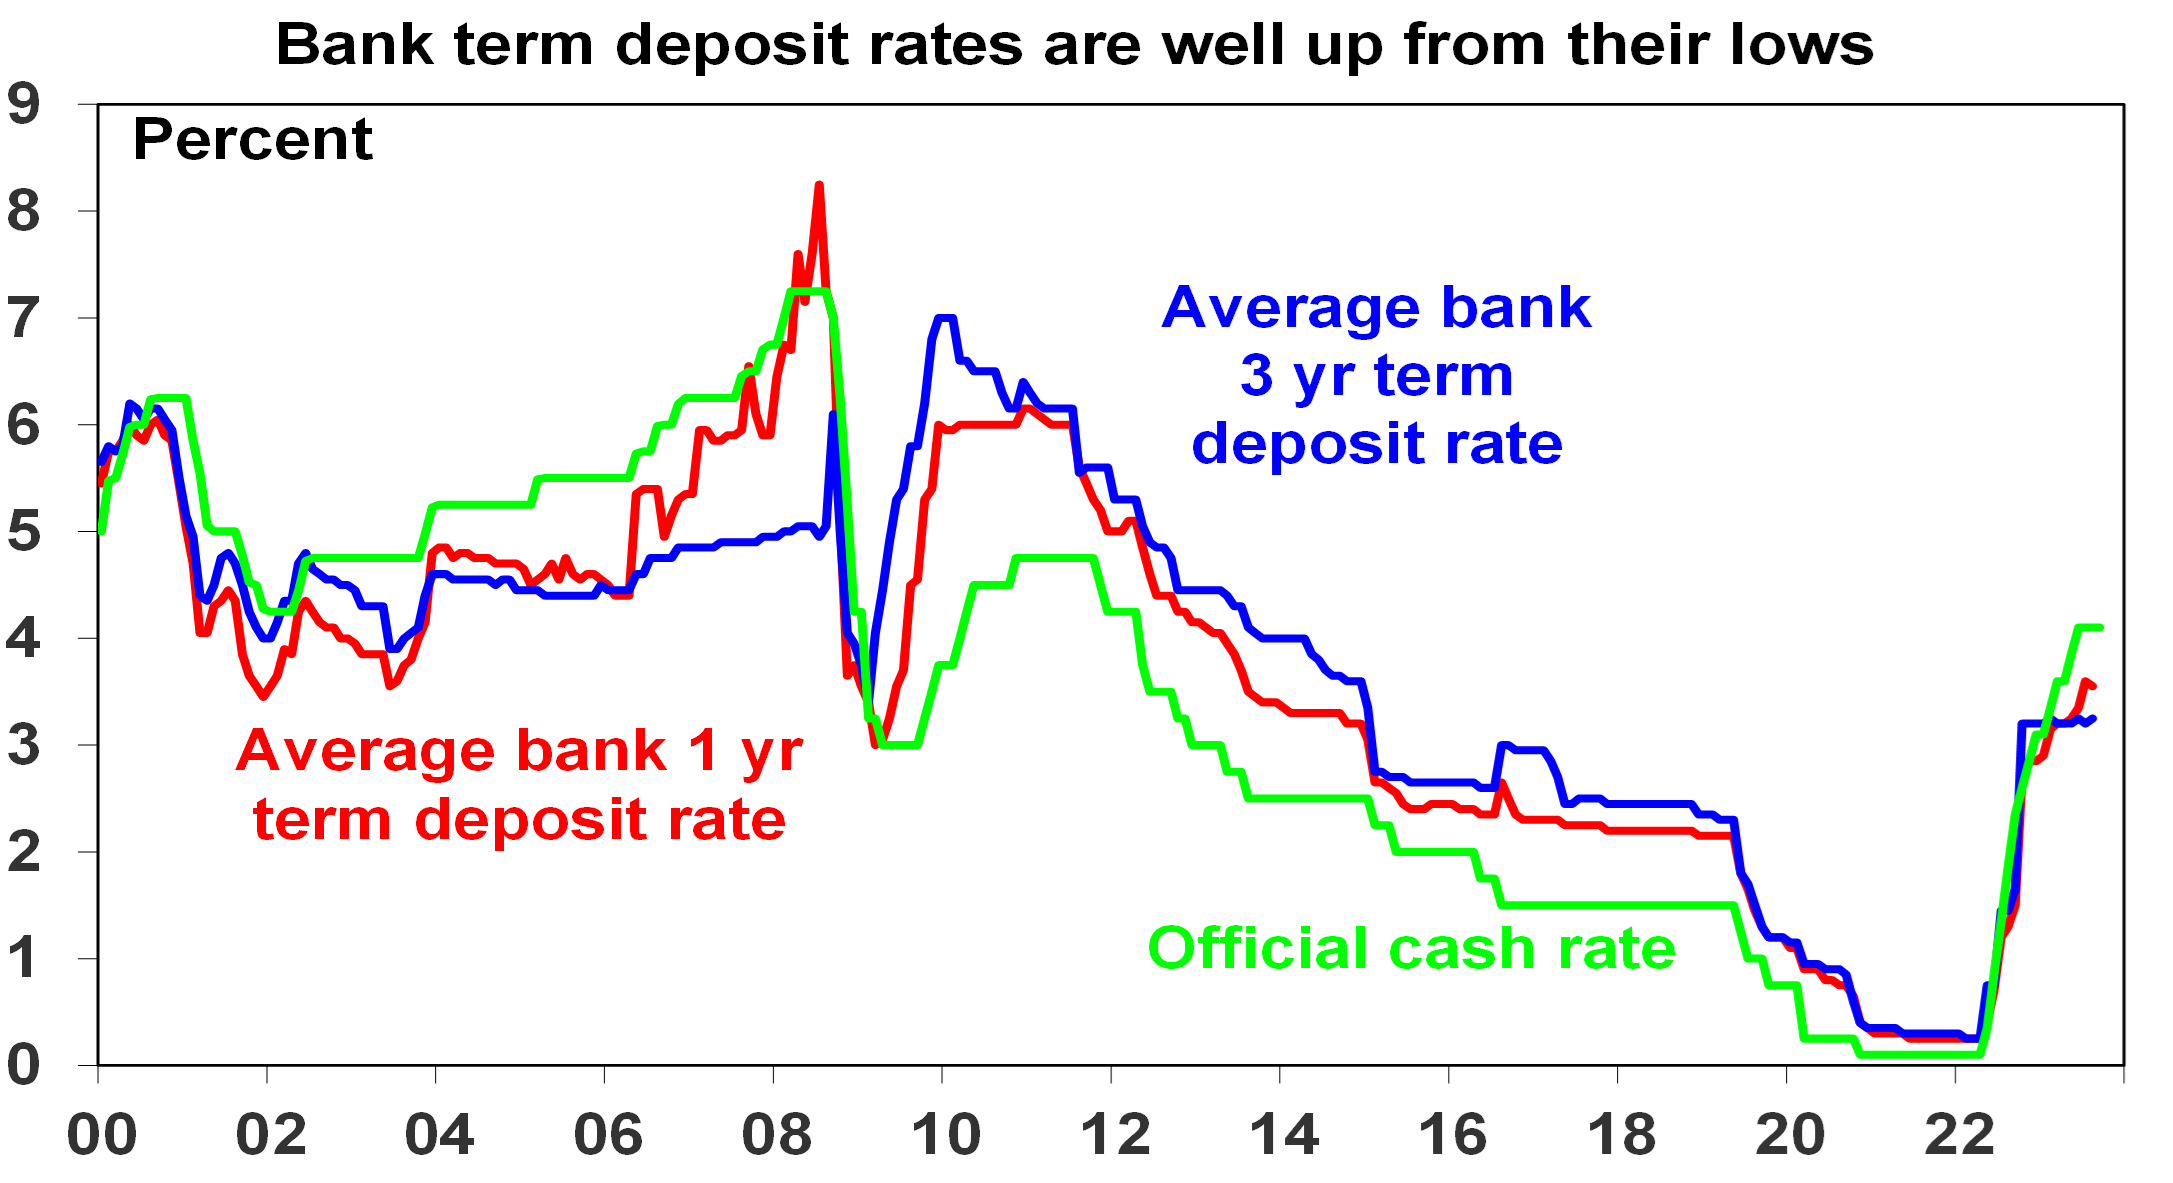
Source: RBA, AMP
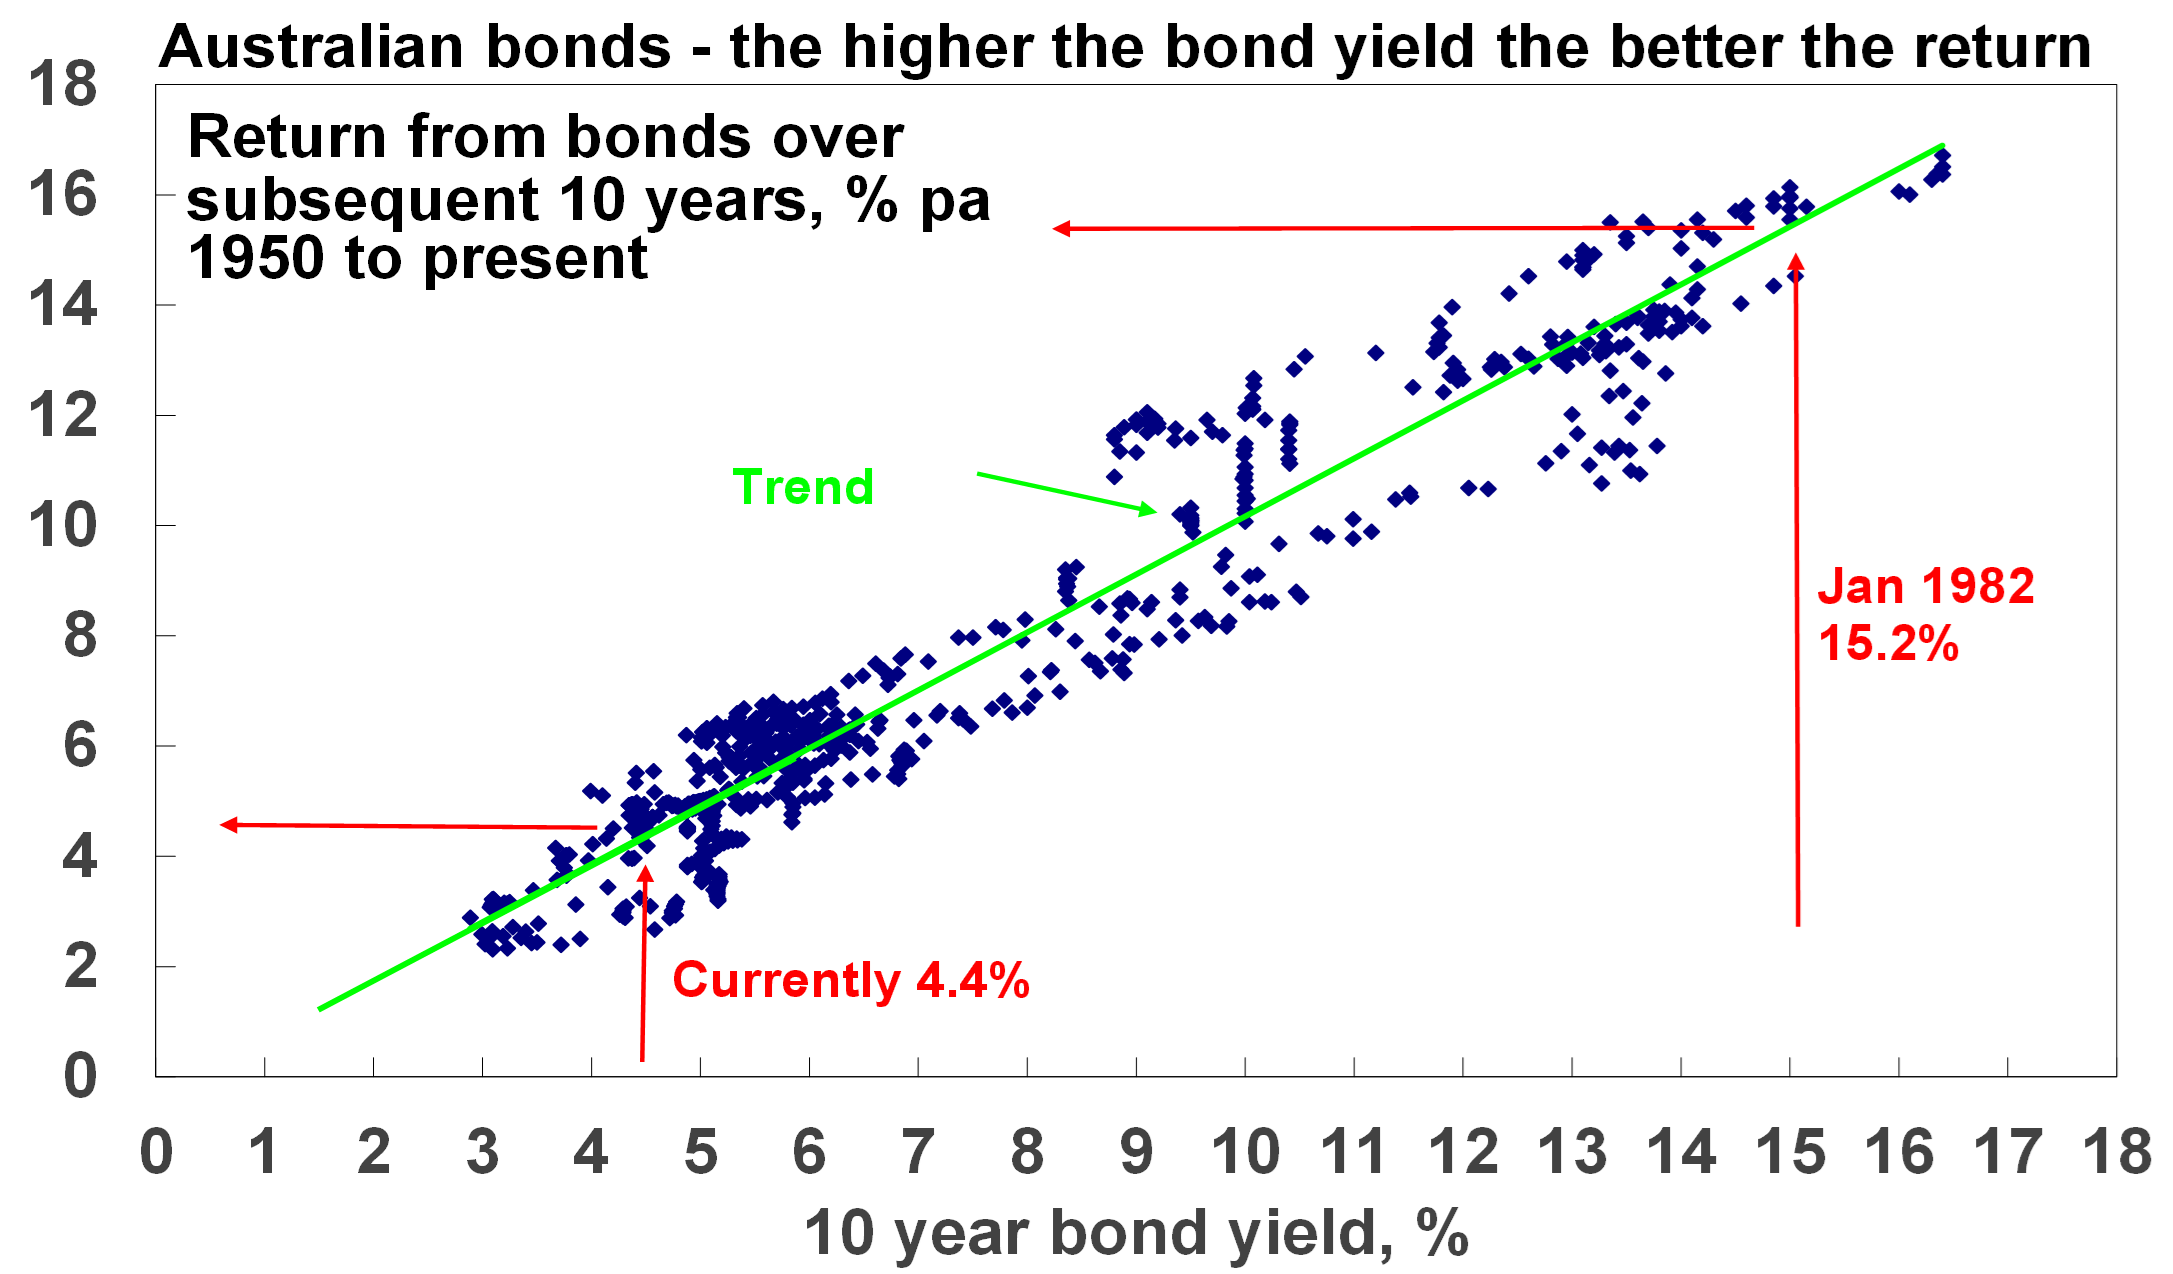
For government bonds in advanced countries the yield is similarly a good guide to starting point value and hence medium-term return potential. Over short-term periods bond prices can move up and down and this influences short term returns, but over the medium term the return a bond investor will get is what bond yields were when they invested. If the yield on a 10-year bond is 5%, and you hold the bond to maturity, your return will be 5%. Of course, the relationship is not perfect but it’s a good guide. This can be seen in the next chart which shows a scatter plot of Australian 10-year bond yields since 1950 (horizontal axis) against subsequent 10 year returns from Australian bonds based on the Composite All Maturities Bond index (vertical axis).
 Source: Bloomberg, AMP
When bond yields are high, they set up high bond returns over the medium term and vice versa. For example, Australian 10-year bond yields in January 1982 were 15.2% and it’s not surprising that bond returns over the next 10 years were 15.4%. At their low point of 0.6% in 2020 they were pointing to very low returns but they have now increased to around 4.4% pointing to better medium term returns, albeit still historically low.
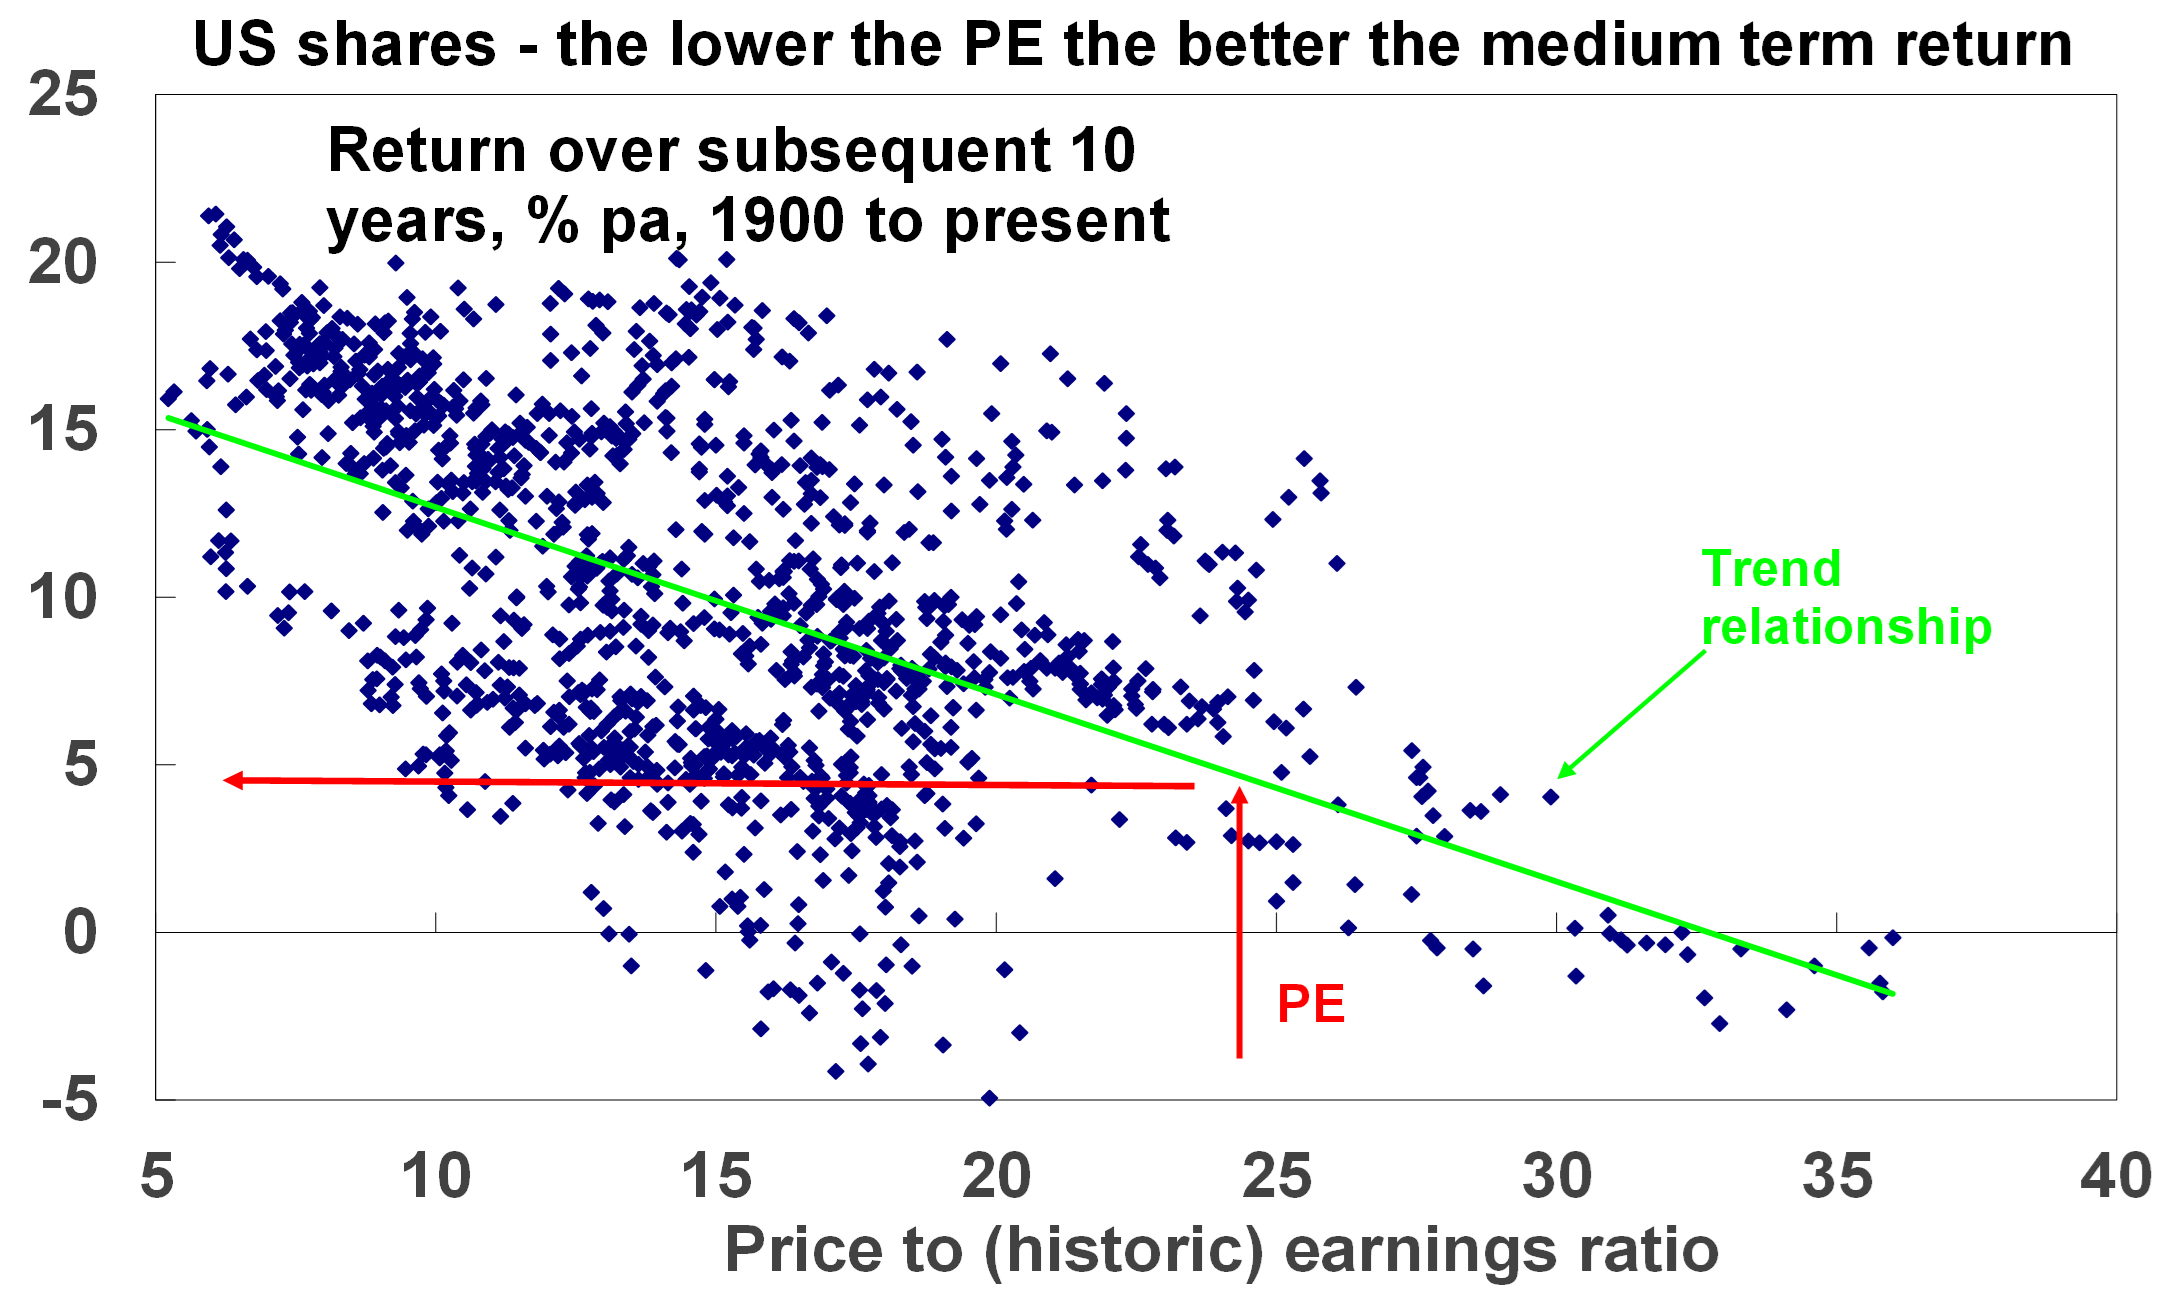
For shares a similar relationship holds. The following chart shows a scatter plot of the price to trailing 12 months earnings ratio for US shares since 1900 (along the horizontal axis) against subsequent 10-year total returns (ie, dividends plus capital growth) from US shares. While the relationship is not as smooth as that for bonds as there is much more involved in share returns, it is a negative relationship. That means when share prices are high compared to earnings, subsequent returns tend to be low and vice versa. The best time for shares is after PEs have fallen to single digits.
 Source: Bloomberg, AMP
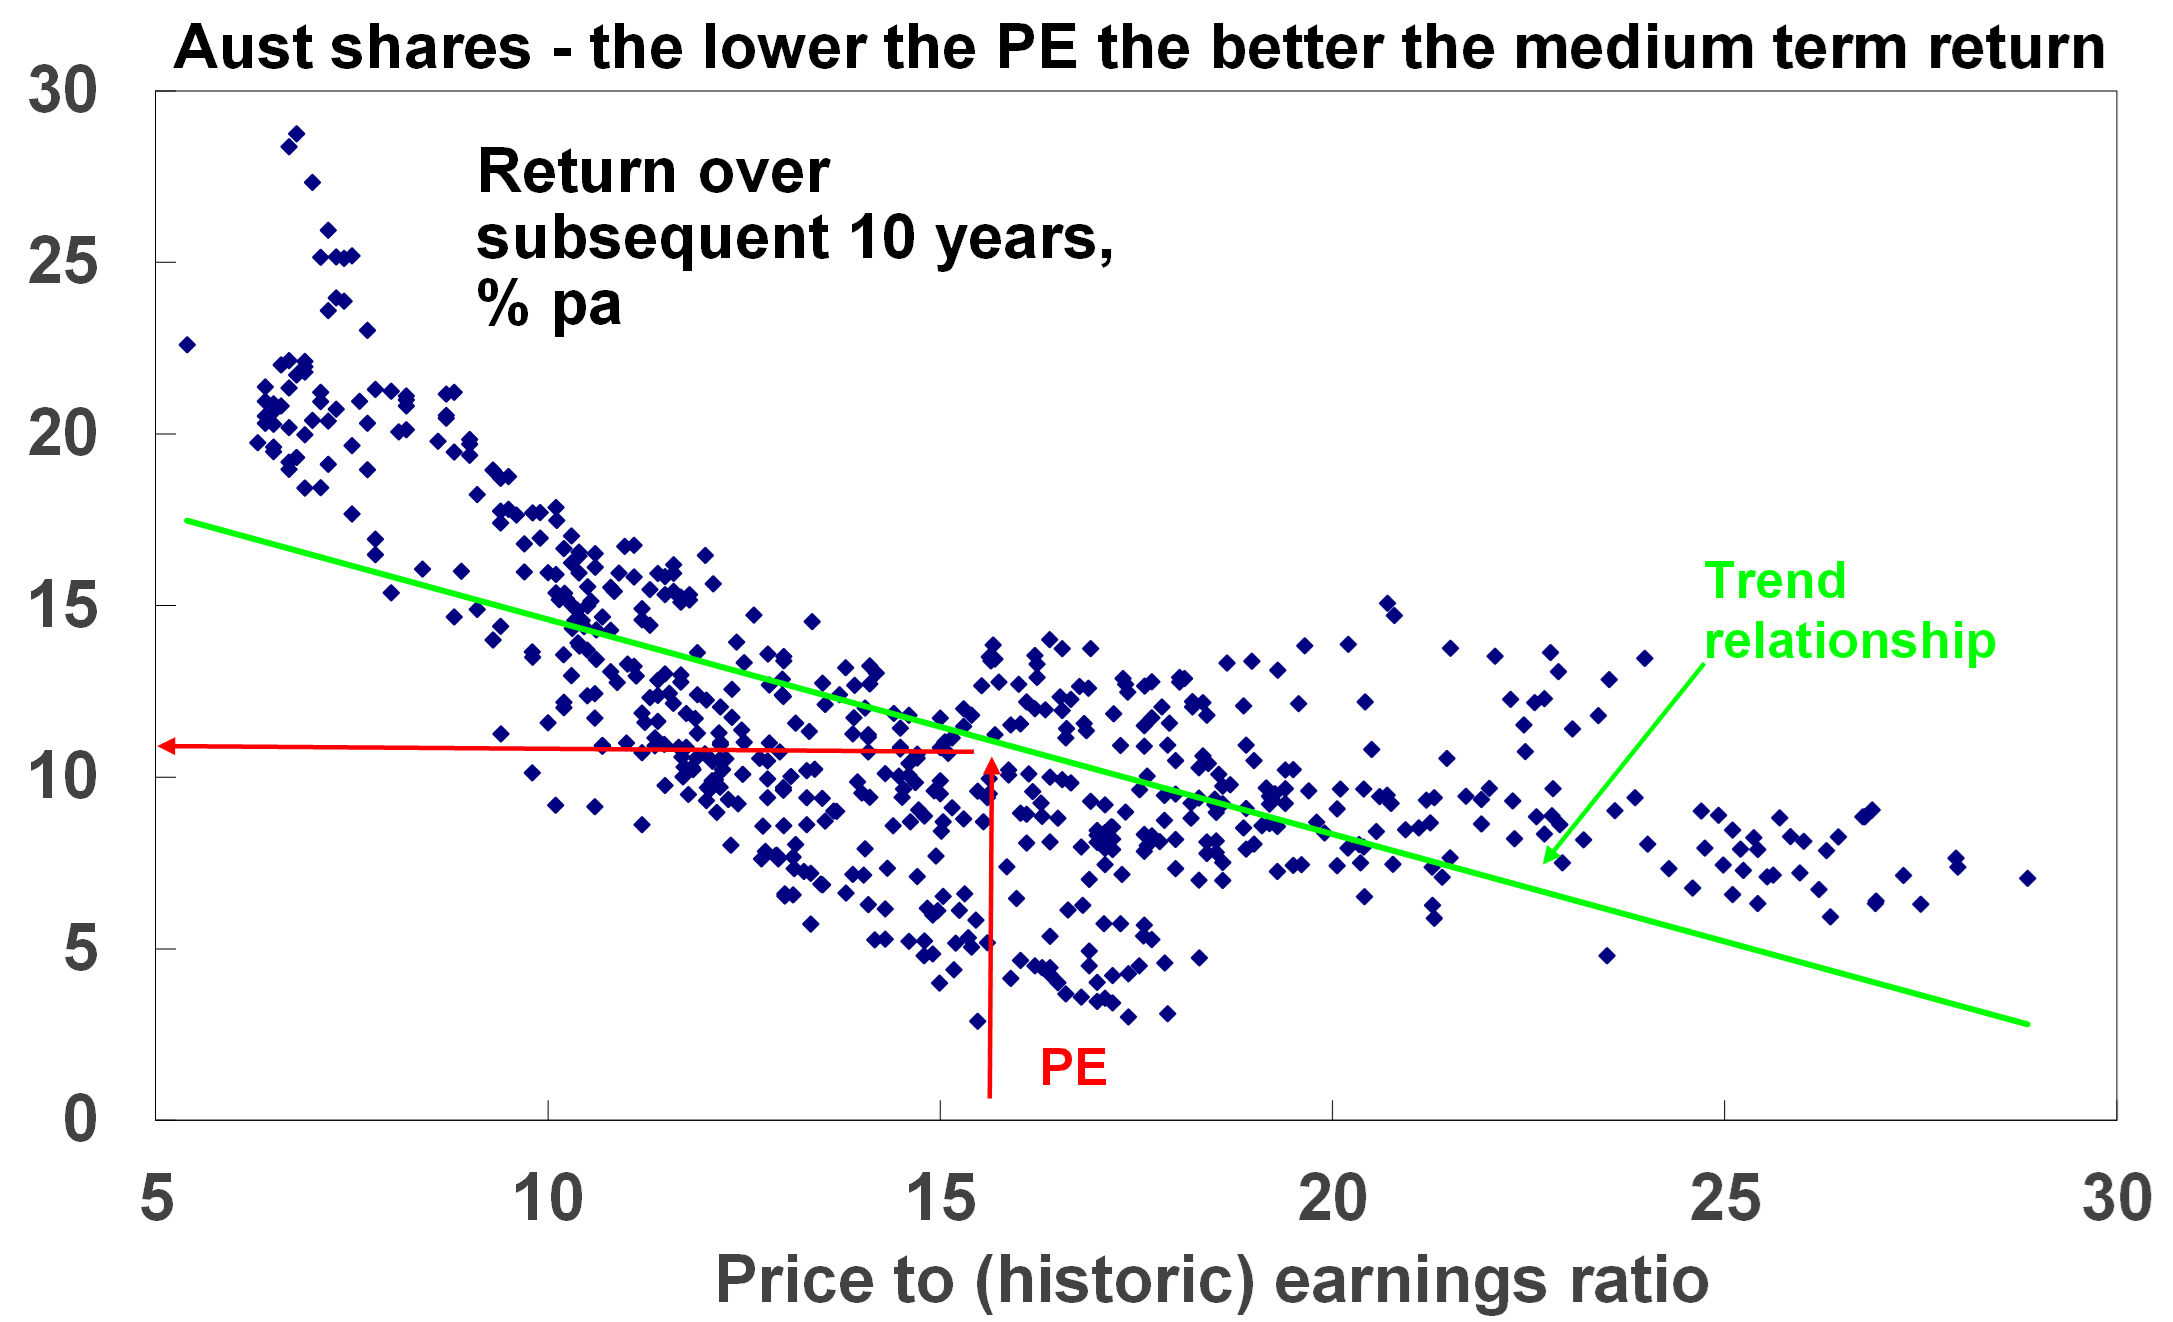
The next chart shows the same for Australian shares from 1962, as a PE series is not available before then. Again, there is the expected negative relationship between the level of the PE and subsequent total returns (based on the All Ords Accumulation Index) with the best returns coming after periods of low PEs. For example, at the end of the mid-1970s bear market in September 1974 the PE was just 5.4 times which was a great time to buy as Australian shares returned 21.8% pa over the next decade.
Source: RBA, ASX, AMP Capital
There is dividend yield data for Australian shares from 1900 and as expected the higher it is the better the subsequent return.
The key is that the starting point matters – put simply the higher the yield and the lower the price to earnings ratio (for shares) relative to their history the better for an asset’s medium term return potential.
Of course, valuation is not a perfect guide to returns
But the importance of starting point valuations is often forgotten. Behavioural finance tells us that it’s natural for investors to pay too much attention to recent performance, so after a run of strong years investors expect it will continue. This leads many to buy only after good times, only to find they have bought when shares are overvalued and therefore find themselves locked into poor returns. And vice versa after a run of poor returns. So, when valuations matter the most, they often get ignored. But of course, valuations can have their own pitfalls.
- First, you need to allow for risk as sometimes assets are cheap for a reason. This can be an issue with individual shares, eg, a tobacco company subject to lawsuits even though current earnings are fine.
- Second, valuation is a poor guide to market timing, often being out by years. To paraphrase John Maynard Keynes, the market can remain expensive (or cheap) for longer than you can remain solvent. For example, economist Robert Shiller’s call that US shares were exhibiting “irrational exuberance” in 1996 was four years before the tech wreck & shorting them in 1996 would have sent an investor bust.
- Third, there is a huge array of valuation measures when it comes to shares. For example, the “earnings” in the PE can be actual historic earnings as reported for the last 12 months, consensus earnings for the year ahead or earnings that have been smoothed to remove cyclical distortions. All have pros and cons. For example, the historic PE is based on actual data, but it can give the wrong signal during or after of a recession as earnings may be depressed making shares look far more expensive than they actually are.
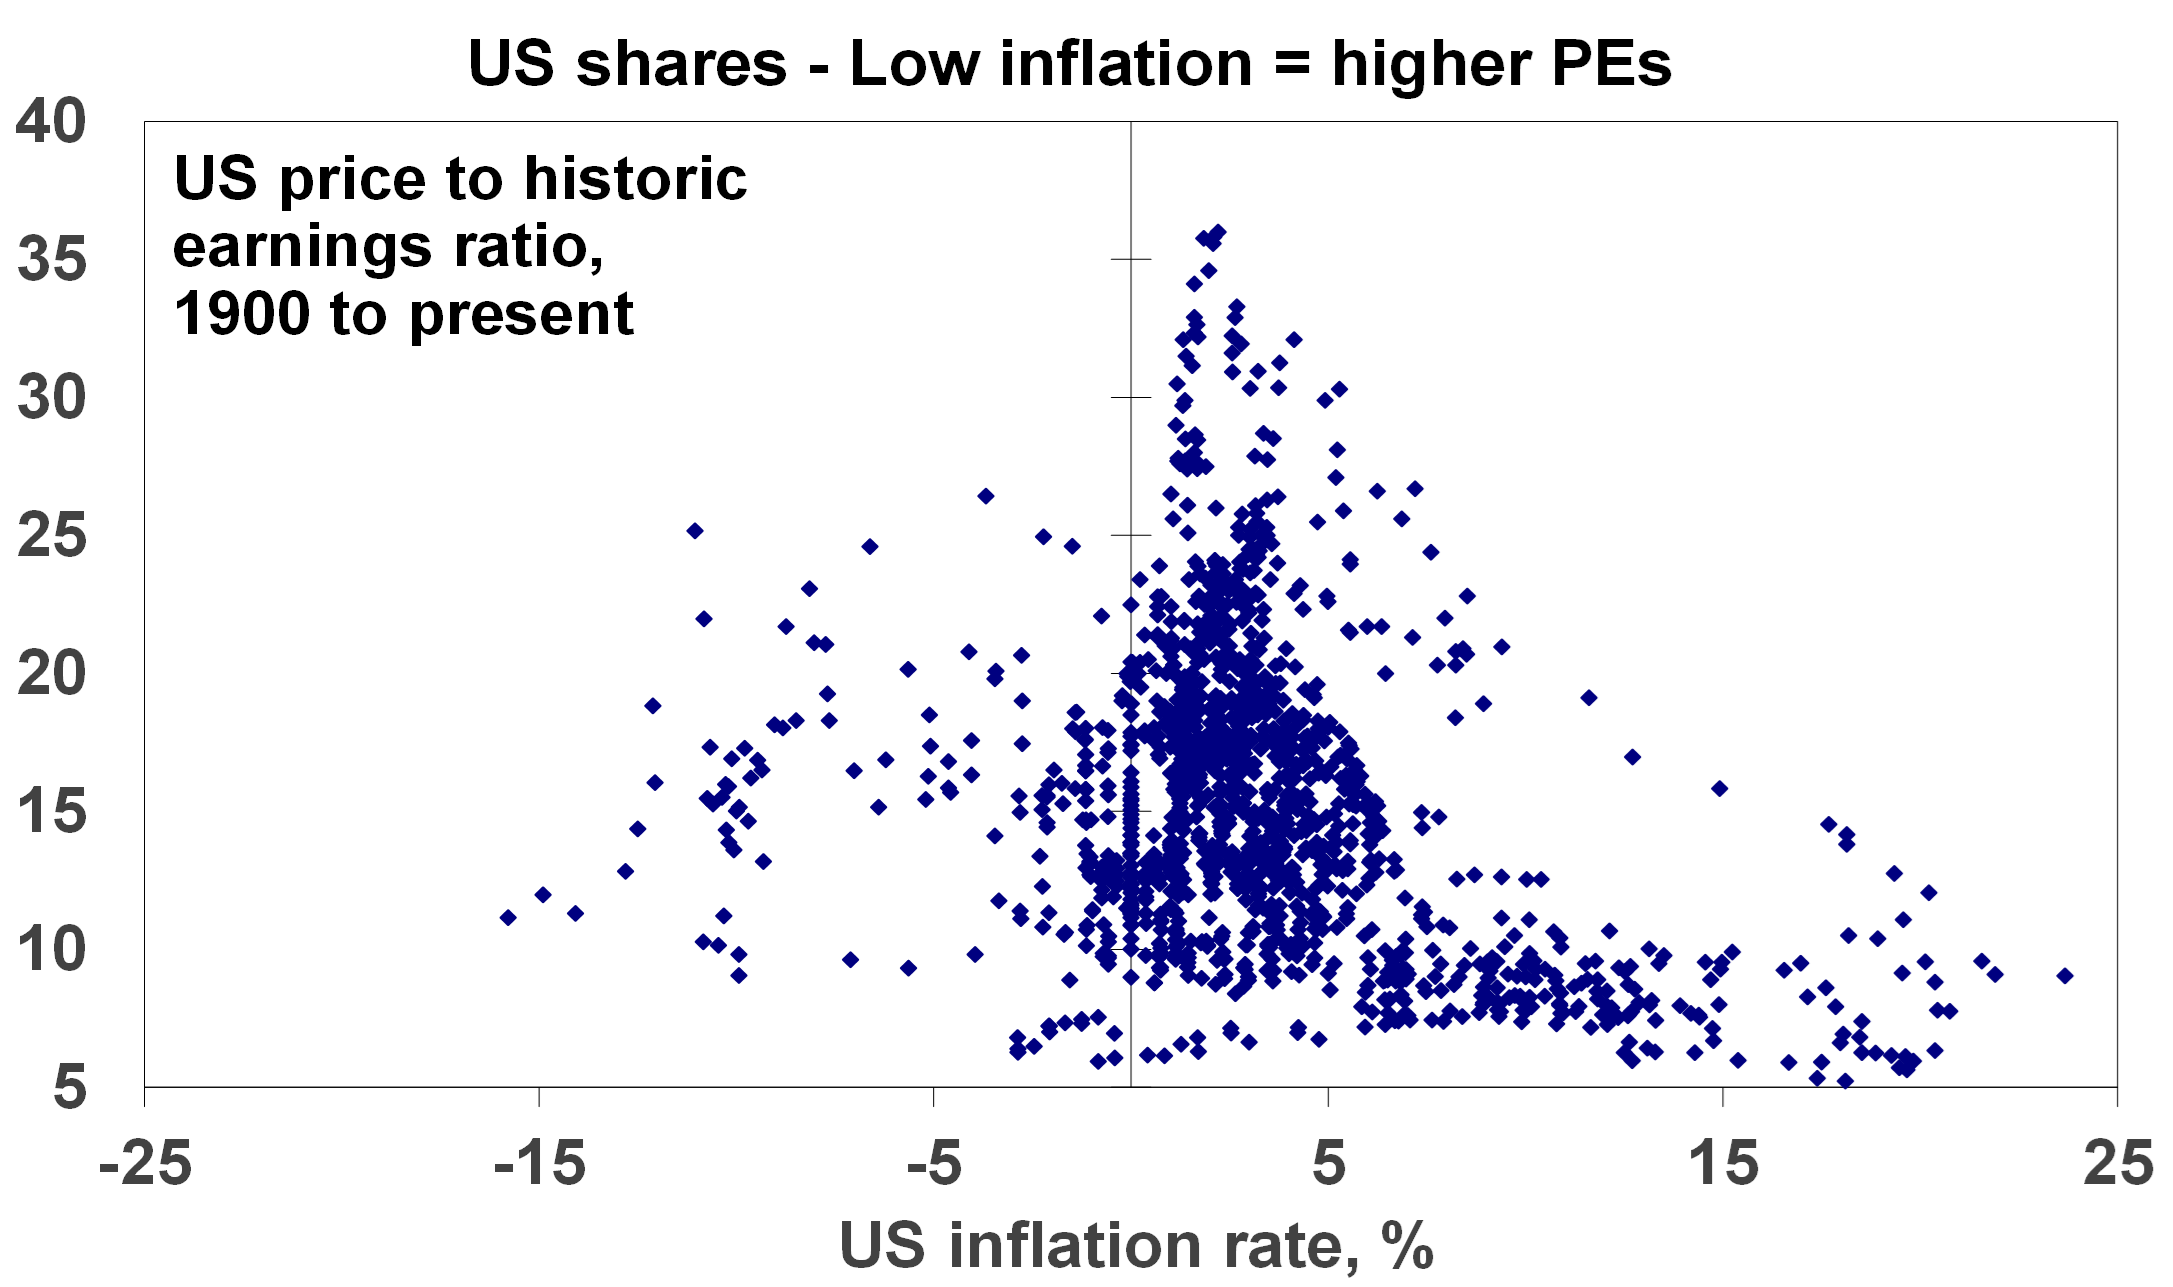
- Finally, the appropriate level of valuation will vary with inflation and interest rates. In times of low inflation, assets can trade on lower yields as the yield structure in the economy falls, uncertainty falls and (for shares) the quality of reported earnings improves. This means higher PEs. So low inflation, say down to 2%, can be good for shares via higher PEs as seen in the next chart. The shift from the high inflation of the 1970s and 1980s to the low inflation last decade was very positive for shares. But if inflation rises resulting in higher interest rates, then shares should trade on lower PEs as investors find shares less attractive, uncertainty rises and earnings quality falls. This of course was a major factor weighing on share markets last year.
Source: Bloomberg, AMP Capital
To get technical: share prices in theory should equal the present value of future dividends discounted by the required rate of return which equals the risk-free interest rate (usually seen as government bond yields) plus a return premium to cover the higher volatility of shares. It follows from this that shares should trade on higher price to earnings ratios when interest rates fall and vice versa when they rise, all other things being equal. This is why interest rates can’t be ignored when valuing shares.
Current valuation signals
Right now, starting valuation signals are as follows:
Cash – Cash and term deposit rates at 4% or so are far more attractive than was the case two years ago but are still below the rate of inflation.
Bonds – Bond yields at 4% or more are far more attractive than was the case two years ago, pointing to much improved medium term return potential albeit it’s still constrained.
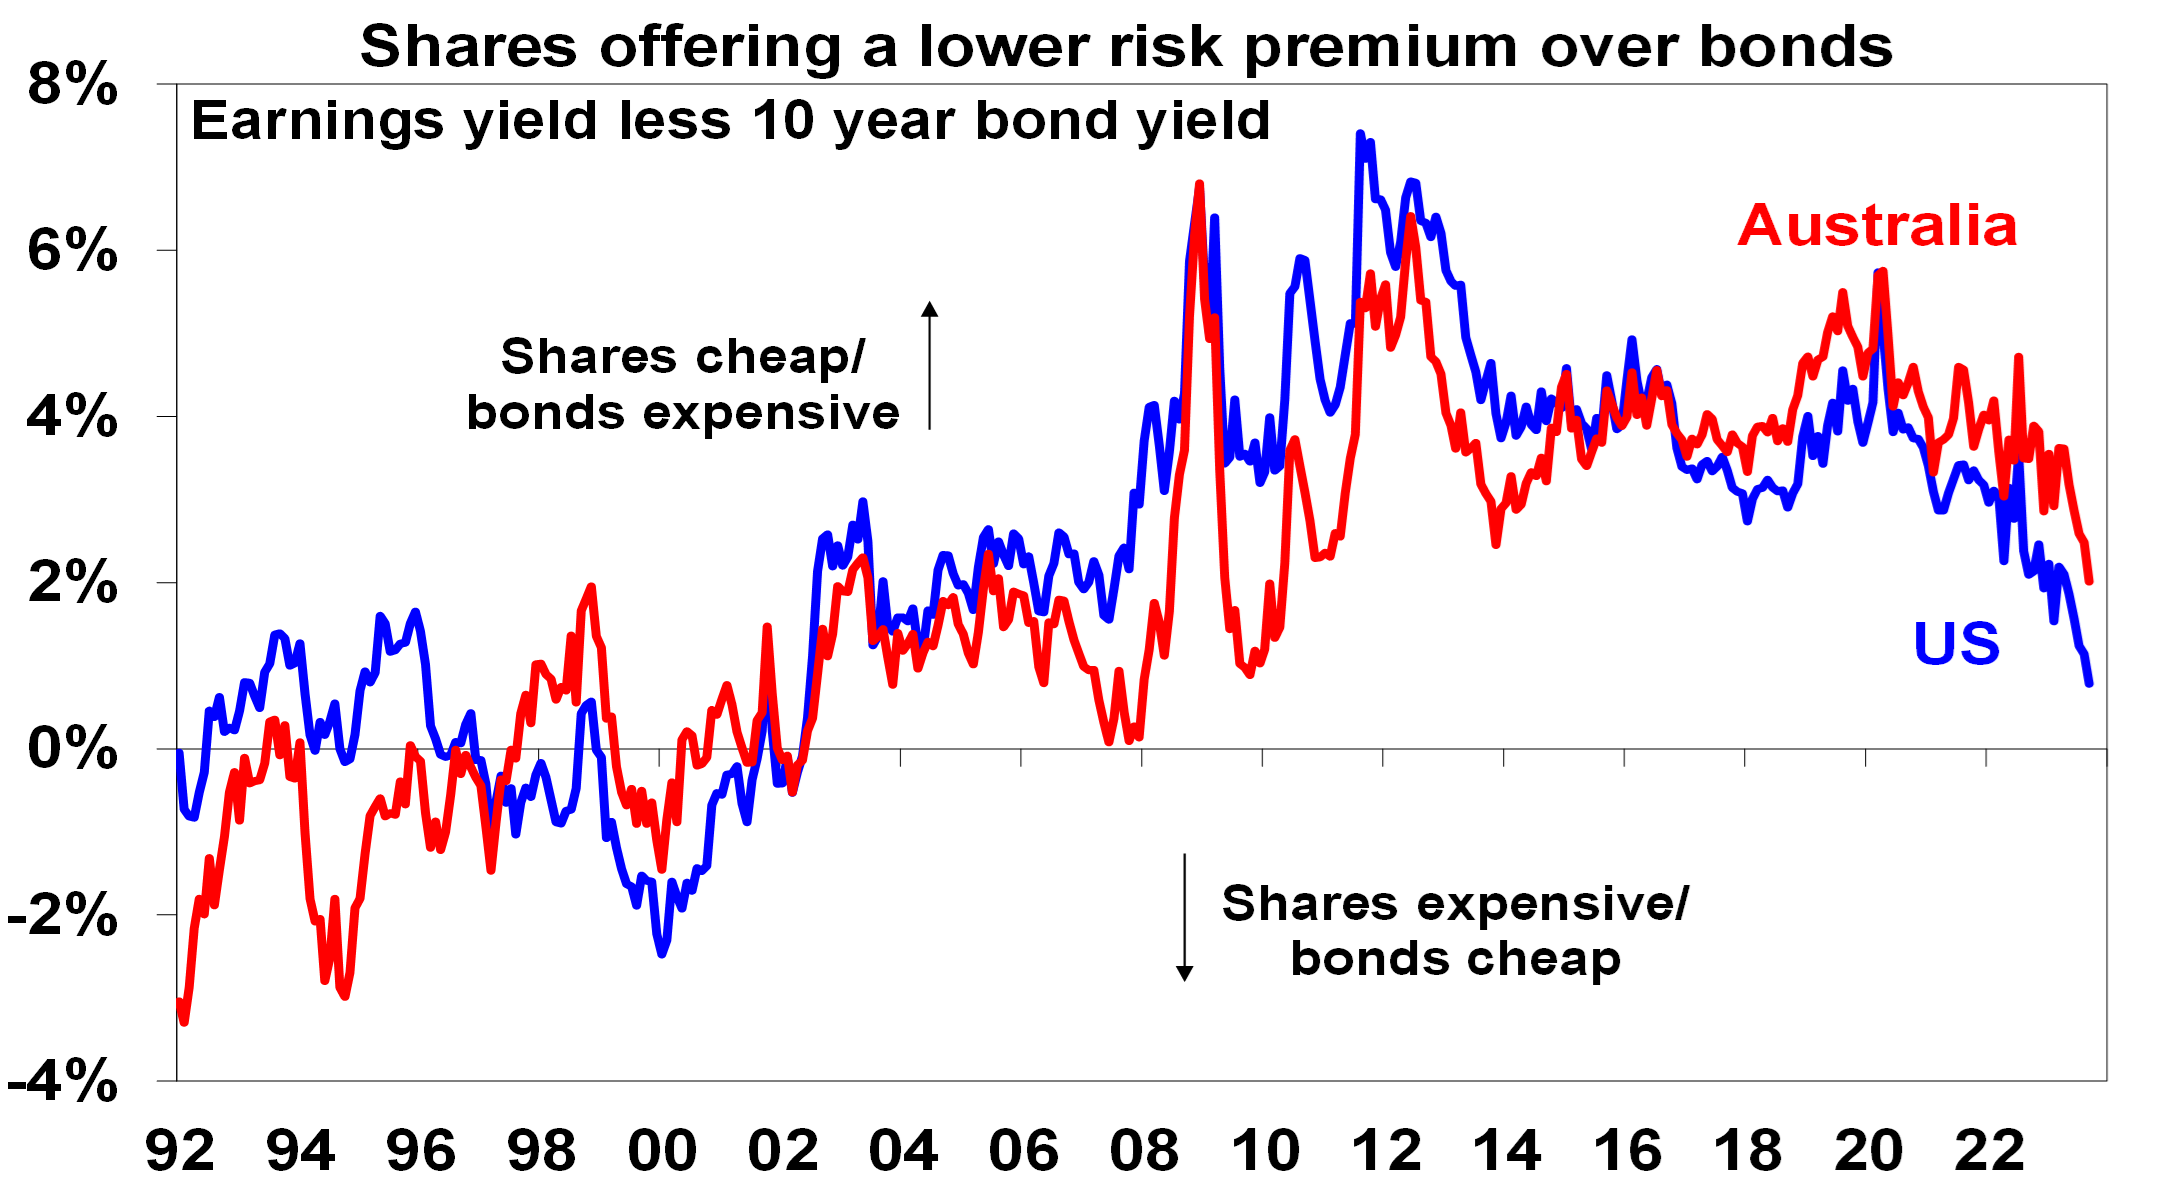
Shares – PE ratios for shares point to a medium-term return potential of around 10% for Australian shares but just 5% for US shares (see the red lines on the PE charts earlier). Allowing for the rise in bond yields – by subtracting 10-year bond yields from the earnings yields (using forward earnings) – shows US and Australian shares now offer a reduced return premium over bonds of around 0.8% in the US and 2% in Australia. See the next chart. For the US this is the lowest risk premium over bonds since after the tech wreck whereas current uncertainties (around interest rates, recession risk & geopolitics) suggest the risk premium should ideally be higher. Fortunately, that for Australian shares is more attractive. But ideally bond yields need to fall to improve the prospects for shares. If we are right and inflation continues to fall over the year ahead, then this should allow lower bond yields and provide some support to shares. But in the near term the risk of a further correction in share markets led out of the US remains high reflecting the deterioration in US share valuations particularly for tech stocks which are very sensitive to bond yields.
 Source: Bloomberg, AMP Capital
The Nuclear Renaissance is Underway

Nations are funnelling massive capital into this green energy alternative as the shift from fossil fuels becomes imperative.
At the core of this nuclear resurgence is uranium – the primary catalyst in most nuclear reactions. Uranium is to nuclear power what oil, coal, and gas are to traditional fossil fuel-based energy sources.
In other words, it’s the fuel of the future.
Power Packed in Atoms
One pellet of refined uranium – the size of your fingernail – packs as much power as 149 gallons of oil.
To put that into perspective…
About 300 pellets are packed into a single fuel rod.
And 250 rods are fastened together to create a fuel assembly.
And between 400 fuel assemblies make up the core of a small reactor.
Let’s do that math together…
A small reactor with a core of 400 fuel assemblies – containing about 30 million uranium pellets – packs the energy punch equivalent to 4.47 billion gallons of oil
The Public Wants Nuclear
Nuclear power has had a troubled past, but continues to grow in support.
Bisconti Research recently released the 2023 Nationwide Nuclear Perception Poll and reported 75% public support of nuclear energy for the third consecutive year.
And about 70% are in agreement on the construction of new nuclear facilities
This year’s poll aligns with a global shift among decision-makers.
Public policies like the Inflation Reduction Act make it clear that nuclear energy will be a priority in the near future.
That means a lot of uranium will be needed FAST…
The Hard Truth About Heavy Metal
Uranium is positioned as a spectacularly exciting commodity for the near future… But it’s not all rainbows and sunshine.
Several factors raise the barrier of entry into this powerful energy source, making it harder for everyday investors to take advantage.
Geopolitical Issues
Uranium deposits are not uniformly distributed around the world.
Some countries with significant uranium reserves face political instability – like Kazakhstan and Namibia.Others – like Russia – grapple with geopolitical tensions, trade restrictions, and sanctions.
All of which can impede exploration and mining operations and hinder the global supply chain.
High Initial Investment
Startup costs for uranium mines can be astronomical.
The high costs can deter potential investors and prospectors.
Due to political red tape and other factors mentioned above, it can take decades for a mine to transition from discovery to production.
Complex Extraction Process
Not all uranium is easily extractable. And not all mines are created equal.
The mineral’s location and depth can make mining operations technically challenging and expensive.
Some deposits may have low ore grades, necessitating the processing of large amounts of rock to extract small quantities of uranium.
That’s all to say that success in the uranium business is highly determined by location, timeline, and mine quality.
The Royal Rise Of Uranium
It’s no secret that uranium prices are cyclical. Like many metals and ores, they can rise and fall with the changing of the tide.
Uranium specifically has faced some challenges due to previous attitudes towards nuclear power.
But those attitudes are changing.
Which makes the meteoric rise of nuclear energy investment all the sweeter for those taking advantage…
One company in particular is making its name in the uranium industry in an innovative and unique way…
To read the full report follow: Uranium Royalty Corp 1 • Carbon Credits
World Gold Holdings Reach Record High: International Shift to Reliability
Ainslie Bullion
In the turbulent first half of 2023, a significant shift underscored global economic sentiment as world gold reserves peaked at an unprecedented 38,764 tonnes, shattering the 1965 record. This surge signals an intentional move by nations to shield their economies amid global financial uncertainties, contributing to an ongoing march away from the once domineering US dollar.
This economic transition has been closely tracked by some experts, with a keen focus on understanding the unreported excess, particularly emanating from Chinese reserves. The officially reported 2,113 tonnes held by China’s central bank (PBoC) contrasts sharply with the industry whispers, suggesting holdings near a staggering 5,000 tonnes. This shadow inventory unveils a deliberate strategic move towards gold accumulation, further reinforcing the significance of this precious metal in the prevailing economic climate.
Examining International Monetary Fund (IMF) calculations delivers some intriguing insights around 4 key areas that are regularly overlooked.
- Base Evaluation: Incorporates the latest registered volumes from global central banks, including those whose reporting ceased years ago.
- Unreported Acquisitions: Unveiling the unreported purchases, contributing to the expanded gold reserves.
- Sovereign Wealth Funds: Incorporation of known reserves held by sovereign wealth funds.
- International Financial Institutions: Accounting for gold owned by international bodies such as the European Central Bank.
The comprehensive evaluation, incorporating these overlooked dimensions, confirms the unprecedented spike to 38,764 tonnes in world gold holdings in June 2023.
The seismic shift towards gold post the 2008 Great Financial Crisis has seen central banks worldwide augment their reserves by over 7,000 tonnes. This movement not only underscores a diversification strategy but also highlights the escalating concerns regarding the US dollar’s continuing reliability as the global reserve currency.
The accelerated value growth of global gold reserves, up by 66% compared to the more modest 30% increment in foreign exchange reserves, clearly shows the mounting confidence in gold. The flow on impact could see the price of gold soar, potentially touching the $8,000 mark in the coming decade, as projected by several analysts.
Amidst escalating geopolitical tensions, the weaponised dollar, and surging global debt levels, gold’s lustre shines brighter as a stabilising force. The perpetual gold accumulation trend by central banks is poised to continue, underscoring the growing emphasis on economic safeguarding against uncertainties and potential future fiscal upheavals.
Beyond the symbolic milestone, the record gold reserves signify an emerging economic recalibration. The stagnant nominal holdings of US government bonds (Treasuries) by foreign central banks against the backdrop of the relentless surge in US public debt underscores a declining global confidence in the US fiscal framework. This evolving dynamic highlights the potential for a looming funding crisis in the US, further eroding the dollar’s global standing as a reserve currency.
Given the ongoing increasing nature of economic uncertainties that we have been reporting and discussing on Insight lately, gold continues to have a place in the conversation as a beacon of stability and assurance. The unfolding trends, combined with the symbolic milestone of these new all time highs in global holdings, show that the growing global commitment to enhancing gold reserves can’t be ignored or dismissed. Gold will continue to play an important role in the international monetary ecosystem, and individuals have an opportunity to participate in that by simply holding some physical metal, or some digital AUS tokens backed by the physical metal, as a part of their personal portfolio.
I hope you have enjoyed this weeks read, if you would like to discuss buying and selling investments, please do not hesitate to reach out.
Regards,
Head, Fixed Interest and Superannuation
JMP Securities
Level 1, Harbourside West, Stanley Esplanade
Port Moresby, Papua New Guinea
Mobile (PNG):+675 72319913
Mobile (Int): +61 414529814