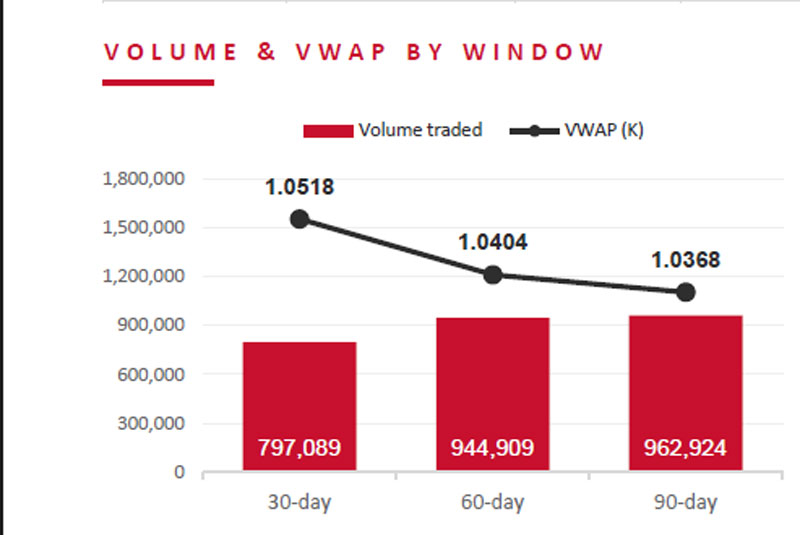
The shorter the window, the higher the price — CPL’s 30-day VWAP of K1.0518 sits above the 60-day (K1.0404) and 90-day (K1.0368) readings. Most of the volume is recent: 797,089 of the 962,924 shares traded over 90 days changed hands in the last 30.
Window
VWAP
Volume
Trades
Value
30-day
10 Aug – 8 Sep
K1.0518
797,089
14
K838,374
60-day
10 Jul – 8 Sep
K1.0404
944,909
29
K983,064
90-day
11 Jun – 8 Sep
K1.0368
962,924
34
K998,377
Source: PNGX matched on-market trades; windows measured back from the last matched trade (8 September 2026). JMP Securities analysis.
30 / 60 / 90-Day VWAP
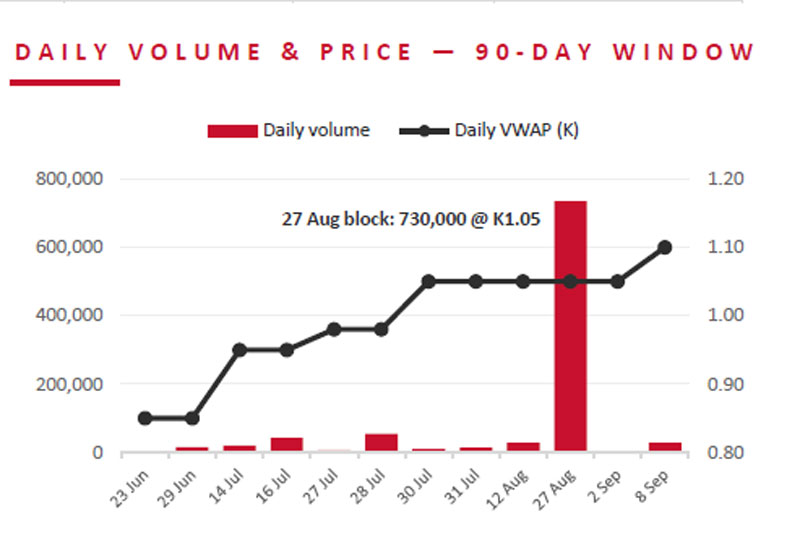
Price is firming at the short end. Volume, however, is concentrated: one 730,000-share trade on 27 August makes up 76% of everything traded over 90 days.
Window
From
Trades
Volume
Value (K)
VWAP (K)
Range (K)
30-day
10 Aug 2026
14
797,089
838,374
1.0518
1.05–1.10
60-day
10 Jul 2026
29
944,909
983,064
1.0404
0.95–1.10
90-day
11 Jun 2026
34
962,924
998,377
1.0368
0.85–1.10
Daily Volume & Price — 90-Day Window
The 27 August block trade comprised 730,000 shares at K1.05 and accounts for 76% of total 90-day volume.
WHAT THE DATA SHOWS
+1.4% — 30-day VWAP over the 90-day VWAP; shorter windows price higher.
76% — of 90-day volume came from a single 730,000-share on-market trade on 27 Aug at K1.05.
K1.0713 — 30-day VWAP excluding that block, versus K0.9955 for the 90-day; the uptrend holds without it.
Current Price vs VWAP
CPL’s current market price of K1.10 is trading at a premium to every VWAP window — 4.6% above the 30-day VWAP, widening to 17.0% above the year-to-date VWAP, as the stock has re-rated steadily through 2026.
Month
Trades
Volume
Value (K)
Close (K)
VWAP (K)
Jan-26
6
16,887
10,311
0.60
0.6105
Feb-26
3
16,106
10,358
0.64
0.6431
Mar-26
10
174,664
131,398
0.79
0.7522
Apr-26
—
—
—
0.79
0.7522
May-26
6
80,467
62,747
0.79
0.7798
Jun-26
8
267,751
212,604
0.85
0.7940
Jul-26
15
147,820
144,690
1.05
0.9788
Aug-26
12
763,484
801,658
1.05
1.0500
Sep-26*
2
33,605
36,716
1.10
1.0926
TOTAL
62
1,500,784
1,410,482
0.9398
Source: PNGX matched on-market trades (Tab 1); VWAP = value ÷ volume, by trailing window and by calendar month. April had zero matched trades — volume shows as 0, VWAP and month-end price carried flat from March. Current price = last matched trade, 8 Sep 2026. JMP Securities analysis. General information only.
Key Takeaways
The Picture So Far
Between 2 January and 8 September 2026, City Pharmacy Limited traded 1,500,784 shares on the PNGX across 62 matched on-market trades, for K1,410,482 in value.
The price trend has been consistently upward — each month that traded printed a higher VWAP than the one before — and the trailing windows confirm it, with the 30-day VWAP above both the 60- and 90-day readings.
Liquidity, however, is concentrated. A single 730,000-share trade in August drove the busiest month on record, and April passed without a matched trade. Volume-based conclusions should be read with that in mind.
01Steady VWAP uptrend
VWAP rose from K0.6105 in January to K1.0926 as of early September, across the review period.
02Short-term above long-term
The 30-day trailing VWAP (K1.0518) sits above the 60-day (K1.0404) and 90-day (K1.0368), consistent with the recent uptrend.
03August volume spike
August was the highest-volume month on record at 763,484 shares, driven largely by a single 730,000-share on-market trade.
04April gap
No matched trades were recorded in April 2026.
JMP Securities Limited
Level 3, ADF Haus, Musgrave Street
PO Box 2064, Port Moresby NCD, Papua New Guinea
What This Summary Covered
30 / 60 / 90-day trailing VWAP and volume to 8 Sep 2026
Monthly VWAP & volume trend, Jan – Sep 2026
Month-by-month trades, volume, value and VWAP
Key takeaways — VWAP uptrend, August block trade, April gap
DISCLAIMER
This document has been prepared by JMP Securities Limited for internal and client discussion purposes only and does not constitute investment advice, a recommendation, or an offer or solicitation to buy or sell any security. All trade data is sourced from matched, on-market PNGX transactions and is believed to be accurate at the time of preparation, but JMP Securities Limited makes no representation or warranty as to its completeness or accuracy. VWAP and volume figures are historical and are not indicative of future price or trading performance. Past performance is not a reliable indicator of future results. This document may not be reproduced or distributed, in whole or in part, without the prior written consent of JMP Securities Limited. JMP Securities Limited is a licensed securities dealer on the Papua New Guinea Exchange (PNGX).