Last price K4.39 vs K3.15 at start (+39.4%). 24-month VWAP K3.750; last price 17.1% above VWAP. Trading range K3.10–K4.95 (low 26 Sep 2024; high 10 Jun 2026). Total turnover K93.74m; 25.00m shares; 1,462 trades across 335 trading days. Average daily volume 74,631; average daily value K280k. Average trade size K64.1k; median K22.1k. Largest single trade K2.28m — 599,510 shares at K3.80 on 18 Sep 2025.
Price & Volume Performance
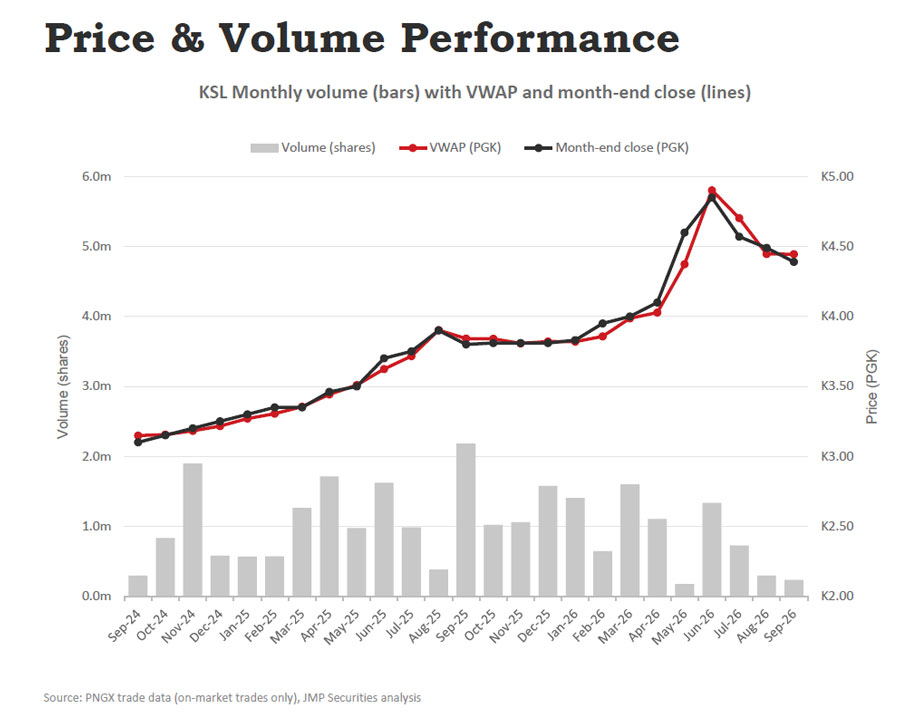
Steady climb, then a re-rating. Rose from K3.15 to K4.00 by Mar-26, then jumped to a K4.95 high on 10 Jun 2026 (June VWAP K4.90).
Price moved on thin volume. May-26 was the quietest full month at 172,794 shares, yet the close rose 12.2% to K4.60.
Liquidity peaked in Sep-25. 2.18m shares (K8.38m), led by a 599,510-share trade, against a 1.04m-share monthly average.
Easing since the peak. K4.39 by 22 Sep 2026, 11.3% off the high on lighter volume, but still up 39.4% over 24 months.
Market Price Table
Month
Open
High
Low
Close
Change
VWAP
Volume
Turnover
Sep-24*
3.15
3.15
3.10
3.10
–
3.148
295,451
0.93m
Oct-24
3.10
3.20
3.10
3.15
+1.6%
3.155
833,331
2.63m
Nov-24
3.15
3.25
3.14
3.20
+1.6%
3.182
1,896,906
6.04m
Dec-24
3.20
3.25
3.20
3.25
+1.6%
3.216
576,698
1.85m
Jan-25
3.25
3.30
3.25
3.30
+1.5%
3.269
563,682
1.84m
Feb-25
3.25
3.35
3.25
3.35
+1.5%
3.305
568,928
1.88m
Mar-25
3.35
3.40
3.35
3.35
0.0%
3.355
1,260,506
4.23m
Apr-25
3.35
3.50
3.35
3.46
+3.3%
3.442
1,711,737
5.89m
May-25
3.45
3.55
3.45
3.50
+1.2%
3.509
974,178
3.42m
Jun-25
3.55
3.70
3.50
3.70
+5.7%
3.624
1,622,303
5.88m
Jul-25
3.70
3.80
3.70
3.75
+1.4%
3.716
983,904
3.66m
Aug-25
3.80
3.93
3.80
3.90
+4.0%
3.904
381,164
1.49m
Sep-25
4.00
4.00
3.70
3.80
−2.6%
3.842
2,180,801
8.38m
Oct-25
3.80
3.85
3.80
3.81
+0.3%
3.840
1,019,470
3.91m
Nov-25
3.80
3.81
3.80
3.81
0.0%
3.808
1,057,171
4.03m
Dec-25
3.81
3.85
3.81
3.81
0.0%
3.821
1,575,537
6.02m
Jan-26
3.81
3.85
3.81
3.83
+0.5%
3.820
1,404,214
5.36m
Feb-26
3.83
3.95
3.81
3.95
+3.1%
3.857
643,464
2.48m
Mar-26
4.00
4.00
3.95
4.00
+1.3%
3.986
1,598,231
6.37m
Apr-26
4.00
4.10
4.00
4.10
+2.5%
4.028
1,102,499
4.44m
May-26
4.11
4.80
4.11
4.60
+12.2%
4.373
172,794
0.76m
Jun-26
4.80
4.95
4.60
4.85
+5.4%
4.902
1,332,542
6.53m
Jul-26
4.84
4.84
4.56
4.57
−5.8%
4.703
722,501
3.40m
Aug-26
4.49
4.49
4.42
4.49
−1.8%
4.446
293,166
1.30m
Sep-26*
4.49
4.49
4.38
4.39
−2.2%
4.445
230,141
1.02m
24 months
3.15
4.95
3.10
4.39
+39.4%
3.750
25,001,319
93.74m
* Part-months: Sep-24 from 24 Sep 2024; Sep-26 to 22 Sep 2026 (last trade). Source: PNGX trade data (on-market trades only), JMP Securities analysis.
Year-on-Year Comparison
Metric
Prior 12 months
Latest 12 months
Change
Period
24 Sep 2024 – 23 Sep 2025
23 Sep 2025 – 22 Sep 2026
Trades
758
704
−7.1%
Trading days
175
160
−8.6%
Volume
12,944,223
12,057,096
−6.9%
Turnover
K44.67m
K49.07m
+9.8%
VWAP
K3.451
K4.070
+17.9%
Opening price
K3.15
K3.80
+20.6%
Closing price
K3.87
K4.39
+13.4%
Avg trade size
K58.9k
K69.7k
+18.3%
High / Low
K4.00 / K3.10
K4.95 / K3.80
Higher value, fewer shares: turnover rose 9.8% to K49.07m even as volume dipped 6.9%. VWAP re-based upward: 12-month VWAP moved from K3.451 to K4.070 (+17.9%). Larger tickets: average trade size grew 18.3% to K69.7k. Price floor lifted: latest-year low K3.80 is K0.70 above the prior-year low K3.10.
Last Price vs VWAP
Window
VWAP
Last vs VWAP
%
Volume
30-day
K4.448
−K0.058
−1.32%
292,497
90-day
K4.625
−K0.235
−5.09%
1,388,593
6-month
K4.453
−K0.063
−1.41%
4,500,133
YTD 2026
K4.223
+K0.167
+3.96%
7,499,552
12-month
K4.070
+K0.320
+7.87%
12,057,096
24-month
K3.750
+K0.640
+17.08%
25,001,319
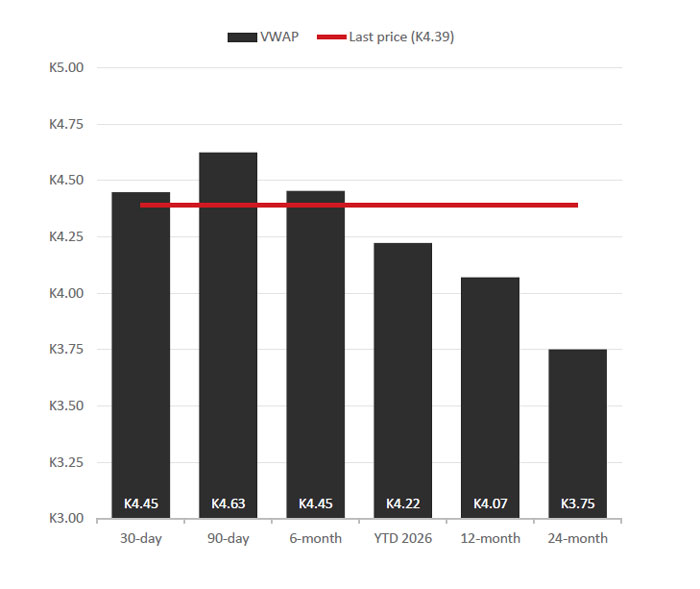
The last price trades below short-term VWAPs (30-day, 90-day, 6-month), reflecting the pull-back from the June high, but remains above the YTD, 12-month and 24-month averages.
Trade Size Profile
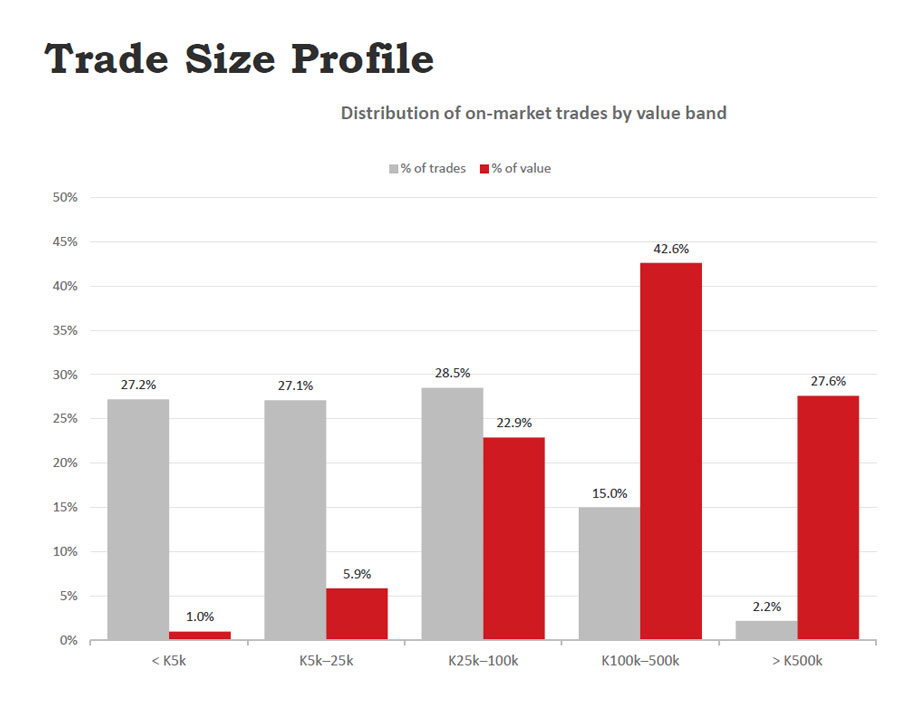
Block trades drive value: trades of K100k+ are 17% of tickets but 70% of turnover. Retail-sized flow is frequent: trades under K25k make up 54% of tickets yet only 7% of value. 32 trades over K500k: worth K25.87m (28% of value) from just 2% of trades. Typical ticket: median trade K22.1k vs mean K64.1k.
Notes & Disclosure
Definitions: VWAP = total value ÷ total volume. Close = last trade price in the period. The 12-month split is at 22 Sep 2025. All figures use on-market trades only; off-market crosses are excluded.
Benny Takin
Equities Trader, JMP Securities Limited benny.takin@jmpmarkets.com
M +675 7001 9121
T +675 320 0240 (Trading Desk)
Level 3, ADF Haus, Musgrave Street
PO Box 2064, Port Moresby NCD, Papua New Guinea
Disclosure
This report has been prepared by JMP Securities Limited (“JMP”), a Participating Organisation of PNGX Markets Limited licensed by the Securities Commission of Papua New Guinea. It is general information only, compiled from PNGX trade data, and does not take into account the investment objectives, financial situation or needs of any particular person. It is not an offer, solicitation or recommendation to buy or sell any security.
While JMP believes the information in this report to be accurate at the time of preparation, no representation or warranty is made as to its accuracy, completeness or reliability. To the extent permitted by law, JMP, its directors, officers and employees accept no liability for any loss arising from use of this report. Past performance is not a reliable indicator of future performance. Investors should obtain independent professional advice before making any investment decision.
JMP acts as broker for buyers and sellers of KSL shares on PNGX and earns brokerage on those transactions. JMP, its related entities, directors and employees may hold interests in securities referred to in this report and may trade in them from time to time.
This report may not be reproduced or distributed, in whole or in part, without the prior written consent of JMP Securities Limited.