July 26, 2021
Welcome to this week’s JMP Report.
Due to the Remembrance Day Public Holiday on Friday, the local bourse did not trade on Friday. BSP traded 134,479 share closing unchanged at K12.30 while KSL traded 40,000 shares closing unchanged at K3.25 per share. KAM traded 20,000 shares and also closing unchanged at K1.00 per shares whilst CCP traded 11,649 shares closing unchanged at K1.70 per share.
Refer details below;
|
WEEKLY MARKET REPORT 19.07.21 – 22.07.21 |
||||
|
STOCK |
QUANTITY |
CLOSING |
CHANGE |
% CHANGE |
|
BSP |
134,479 |
12.30 |
– |
0.00 |
|
KSL |
40,000 |
3.25 |
– | 0.00 |
|
OSH |
– |
10.60 |
– | 0.00 |
|
KAM |
20,000 |
1.00 |
– | 0.00 |
|
NCM |
– |
75.00 |
– |
0.00 |
|
CCP |
11,649 |
1.70 |
– | 0.00 |
|
CPL |
– |
0.80 |
– |
0.00 |
On the interest rate front, 364 day TBills remain firm at 7.20%. Finance Company money remains around the 5.5% mark for 12 mth paper.
We did see Bank of Papua New Guinea announce a Treasury Bond Tender, bids close Tuesday, July 27.
BPNG will be raising K463,490mill with 6 maturities ranging from 2yr to 10yr. We still see good value in the short end of the curve. Results will be announce on Thursday, July 29. If you would like to participate in the tender or would like more information on how to buy bonds, contact Chris for more detail.
What we have been reading this week
Oil Search MD in shock resignation
Papua New Guinea’s leading domestic oil and gas company Oil Search said managing director Keiran Wulff has resigned following concerns about his state of health and recent complaints about his behaviour.
Oil Search said Wulff has been managing a long-term medical condition which had recently deteriorated.
The company’s chairman Rick Lee said the board entered into discussions with Wulff after receiving some complaints relating to his behaviour.
Lee said the board considered that Wulff had behaved in a manner inconsistent with the standards expected in relation to his management style.
Since his appointment as managing director in February 2020, there had been significant challenges for the company.
“This period has been marked by extreme challenges including global lockdowns associated with the Covid-19 pandemic, a plunge in oil prices, crisis measures to protect the company’s financial position and developing a clear strategy to steer a path to a sustainable future through the energy transition,” said Lee.
Wulff thanked all of Oil Search’s staff for their efforts, particularly since the pandemic began, as the company put in place strategies to safeguard its operations in PNG and Alaska.
“It has been a great privilege to work at Oil Search and I believe the company is very well-positioned for the future. It has however, become apparent to me that due to my health challenges, it is becoming increasingly difficult for me to perform at the level required of the position. After considerable reflection and consultation with my family and others including my medical advisers, it is an appropriate time to leave to focus on my health,” said Wulff.
Peter Fredricson, who joined the company earlier this year as chief financial officer, has agreed to become acting chief executive with immediate effect.
A search for a permanent managing director/chief executive including interviews will begin shortly.
“I look forward to working with the highly experienced Oil Search leadership team, each of whom understands the role they have in executing the company’s strategic priorities which will ensure we keep delivering results for our shareholders and the broader communities in which we work,” said Fredricson.
Tokyo Olympic flame is the first powered by hydrogen

Naomi Osaka stands beside the Olympic flame after lighting it during the opening ceremony in the Olympic Stadium at the 2020 Summer Olympics, Friday, July 23, 2021, in Tokyo, Japan. (AP Photo/David J. Phillip)
TOKYO (AP) — Inspired by the sun, the Tokyo Olympic cauldron is designed to be better for the planet.
The flame at Tokyo’s National Stadium and another cauldron burning along the waterfront near Tokyo Bay throughout the games will be sustained in part by hydrogen, the first time the fuel source will be used to power an Olympic fire.
Previous flames have usually run on propane, although magnesium, gunpowder, resin and olive oil have also been used since the first modern cauldron was lit for the Amsterdam Games in 1928. The torch relay was introduced eight years later for Berlin.
Unlike propane, hydrogen does not produce carbon dioxide when combusted. The Tokyo cauldron is fuelled by hydrogen produced by a factory in the Fukushima prefecture that runs on renewable energy. Propane and hydrogen were both used during the torch relay.
Organizers for the London Games in 2012 touted plans for a low-carbon torch but couldn’t get the design right in time. They instead used a mix of propane and butane. Brazilian officials commissioned a smaller cauldron for Rio in 2016 to reduce the amount of fuel needed.
The Tokyo cauldron was designed by Canadian architect Oki Sato. His sun-inspired orb unfolds like petals from a flower, which organizers say “embody vitality and hope.”
Tennis player Naomi Osaka lit the torch at 11:48 p.m., with performers from throughout the night’s ceremony holding sunflowers — famous for blooming toward the sun.
The first torch for these games was lit in Olympia, Greece, 16 months ago, but the relay was suspended for much of 2020 due to the pandemic. Officials put the torch on display at prefectures affected by the earthquake and tsunami that ravaged the region in 2011 until the relay was officially restarted in Fukushima on March 25, 2021.
Some stages of the relay were pulled off roads this month due to fears about spreading the coronavirus before the flame made its way to the National Stadium in Tokyo’s Shinjuku City.
Seven Key Charts for Investors to watch, where are they now
By Dr Shane Oliver, Head of Investment Strategy and Economics and Chief Economist, AMP Capital
Key points
While shares are at risk of a near term correction on the back of coronavirus and inflation concerns, the trend is likely to remain up against the backdrop of continuing economic recovery and low interest rates.
Seven key global charts worth keeping an eye on by investors are: the trend in new coronavirus cases and deaths – particularly in the UK; global business conditions PMIs; unemployment & underemployment; global inflation; bond yields; the gap between earnings yields and bond yields; and the $US.
Introduction
This note takes a look at seven charts we highlighted in January for investors to watch as being critical to the investment outlook this year. Put simply, where are they now?
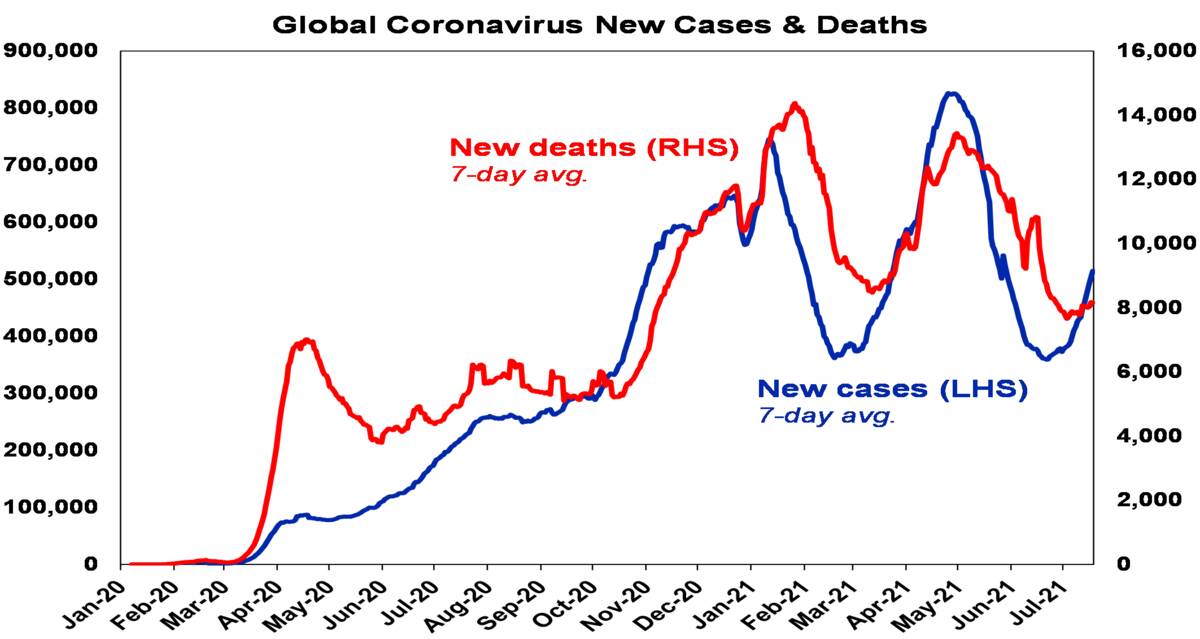 Chart #1 – new coronavirus cases
After plunging through the first half global new coronavirus cases and deaths are on the rise again, propelled by the more contagious Delta variant. This poses a new threat to the economic recovery and threatens a correction in share markets and further decline in bond yields.
Source: ourworldindata.org, AMP Capital
For lowly vaccinated countries this means using restrictions and lockdowns to avoid overwhelming healthcare systems, which disrupts economic recovery. Unfortunately, Australia is in this camp. But experience shows lockdowns work and if they are fast and hard, they can be short resulting in a quick recovery.
However, this wave may be very different in more heavily vaccinated countries – the UK, US and Europe which are around 50% fully vaccinated – with vaccines not necessarily preventing infection but 90%+ effective in preventing hospitalisation and death. Ideally these countries should have waited to reach herd immunity (which may be around 80-90% with Delta), with new cases set to surge to higher than ever levels. But, if hospitalisation and deaths don’t surge, then they can “learn to live it” with little disruption to reopening. So far so good for the UK, but simple maths tells us it could still run into trouble if cases and hospitalisation amongst the unvaccinated run up too quickly, stressing the hospital system & necessitating the return of some restrictions. The next chart is worth watching. Some lowly vaccinated US states are at greater risk.
Source: ourworldindata.org; AMP Capital
With vaccine production ramping up to 10bn plus this year other countries including Australia should be able to get to herd immunity by early next year.
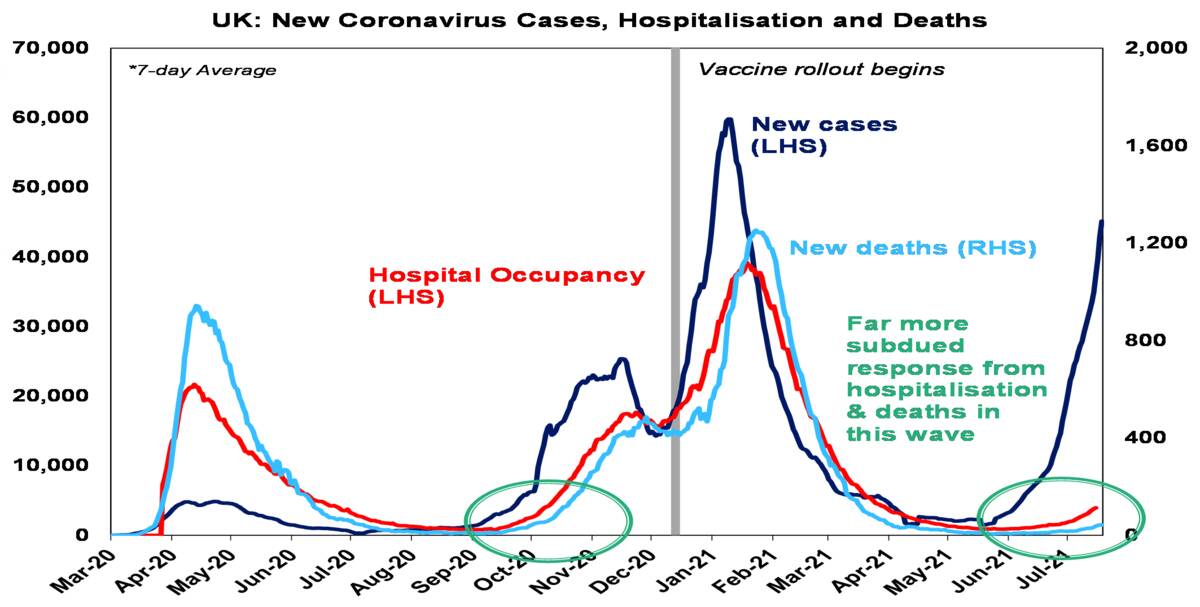
Chart # 2 – global business conditions PMIs
Global Purchasing Managers Indexes (PMIs) – surveys of purchasing managers at businesses – have surged to record levels globally suggesting a very strong recovery. They’re likely to slow from here but this is normal after an initial surge (see the 2010-12 period), but short of vaccines failing to head off severe illness in highly vaccinated countries and so breaking recovery, or central banks slamming on the brakes, this should still be to levels consistent with reasonable growth.
Source: Bloomberg, AMP Capital
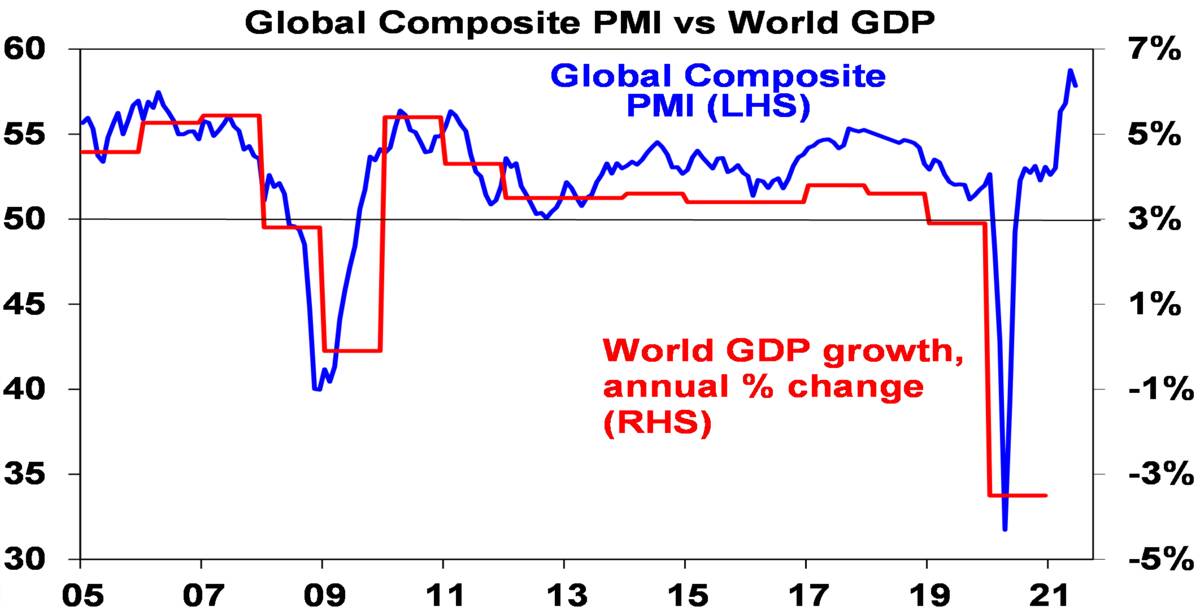
Chart 3 – unemployment and underemployment
One of the big surprises of this recovery is how quickly jobs came back. This has led to some wage pressures and perceptions that spare capacity has been used up. However, labour underutilisation rates are still relatively high and labour markets are still distorted by the pandemic, eg, by enhanced unemployment benefits in the US & by the closed international border in Australia. So, it still looks like we have a fair way to go to full employment and hence sustained decent wages growth, even without the latest coronavirus-related uncertainties.
Source: Bloomberg, AMP Capital
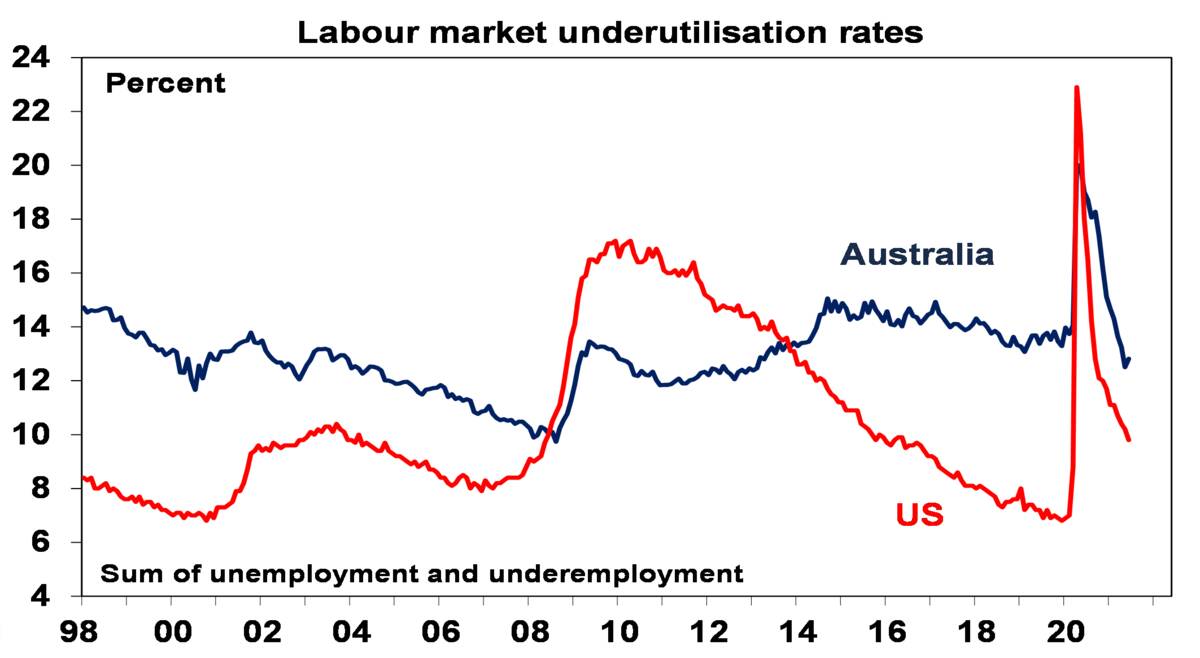
Chart 4 – global inflation
This year has seen an inflation scare with surging raw material prices and US consumer inflation. Core (ex food and energy) CPI inflation in the US has surged to 4.5%yoy but this has been driven by a handful of pandemic-impacted categories (like used car prices up 45%yoy) whereas the rest of the core CPI is up just 2%yoy. And core inflation in China, Europe and Japan is running 0.9%yoy or less. Underlying inflation in Australia still looks to be around 1.6%yoy.
Source: Bloomberg, AMP Capital
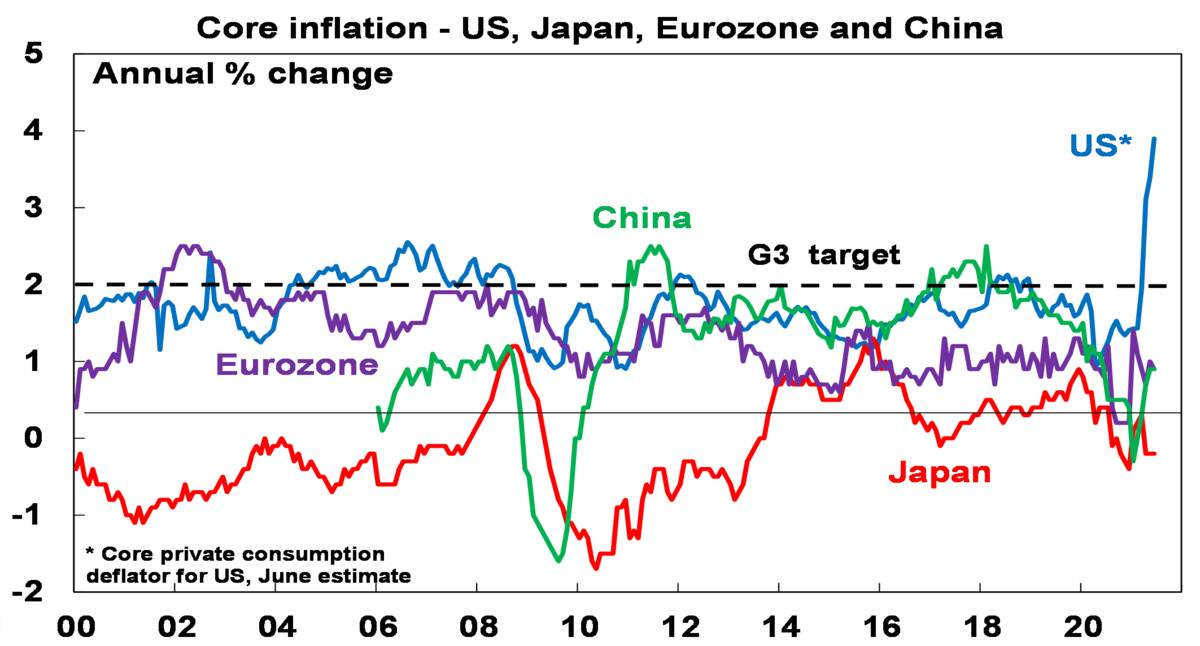
Chart 5 – bond yields
10-year bond yields surged early this year (to 1.7% in the US & 1.9% in Australia) on inflation fears, strong growth & expectations of less central bank bond buying but have since plunged (back to around 1.2% in the US and Australia) on fears about rising new coronavirus cases, concerns we have seen the peak in GDP growth, increased confidence the inflation spike is transitory and a short covering rally (as investors closed underweight positions).
Source: NBER, Bloomberg, AMP Capital
This looks more like a correction than a trend reversal and we anticipate that the rising trend in bond yields will resume as the global recovery continues, vaccines work and vaccination rates rise. But in the meantime, it has removed the near term threat of a 1994 style bond crash leading to a collapse in shares.
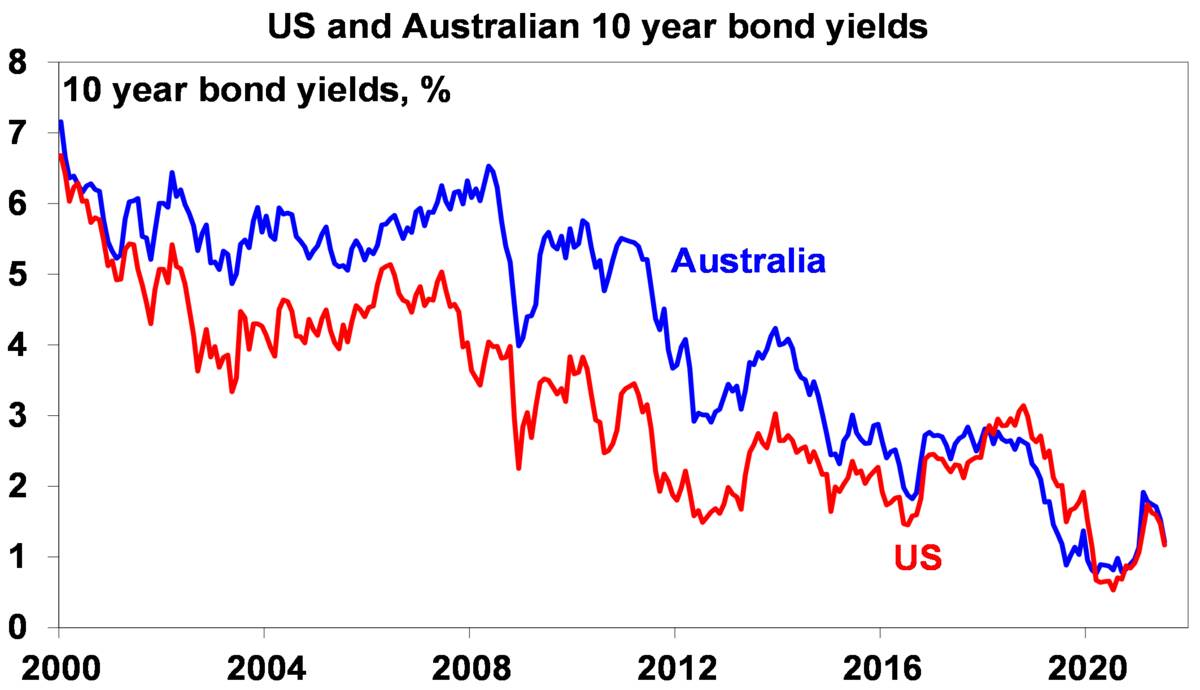
Chart 6 – the gap between earnings and bond yields
The rebound in company earnings has seen price to earnings multiples decline from recent highs despite the strength in share markets this year, resulting in higher earnings yields. At the same time, the decline in bond yields has increased the risk premium shares offer over bonds – as proxied by the earnings yield less the bond yield. In other words, shares have become more attractive again after seeing declining attractiveness into early this year.
Source: Thomson Reuters, AMP Capital
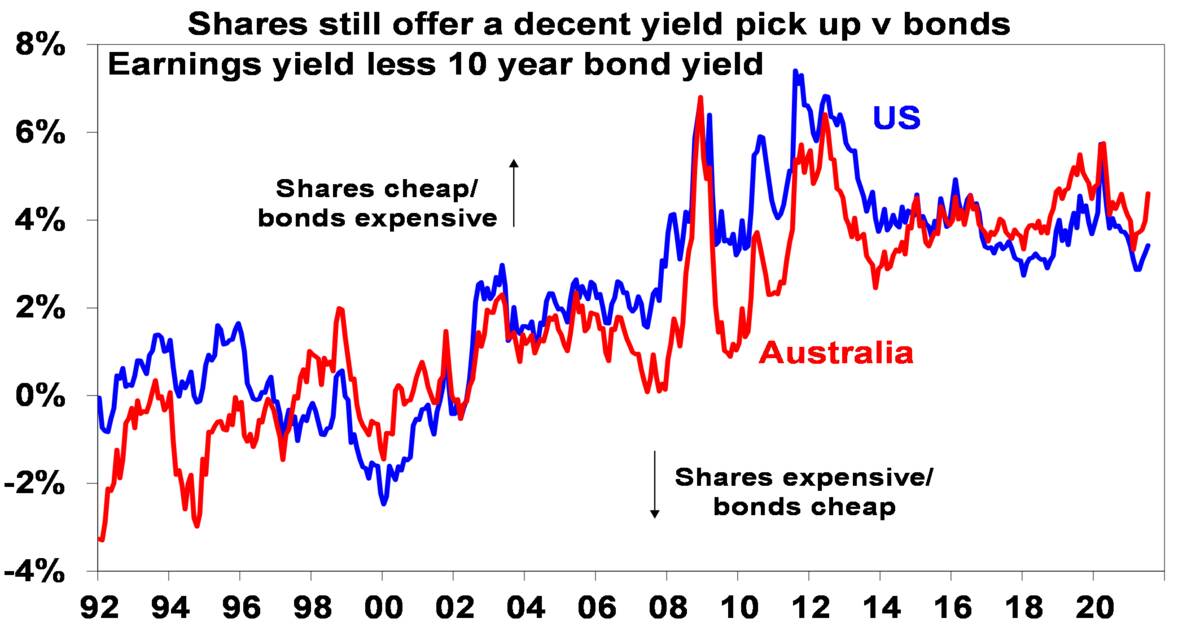
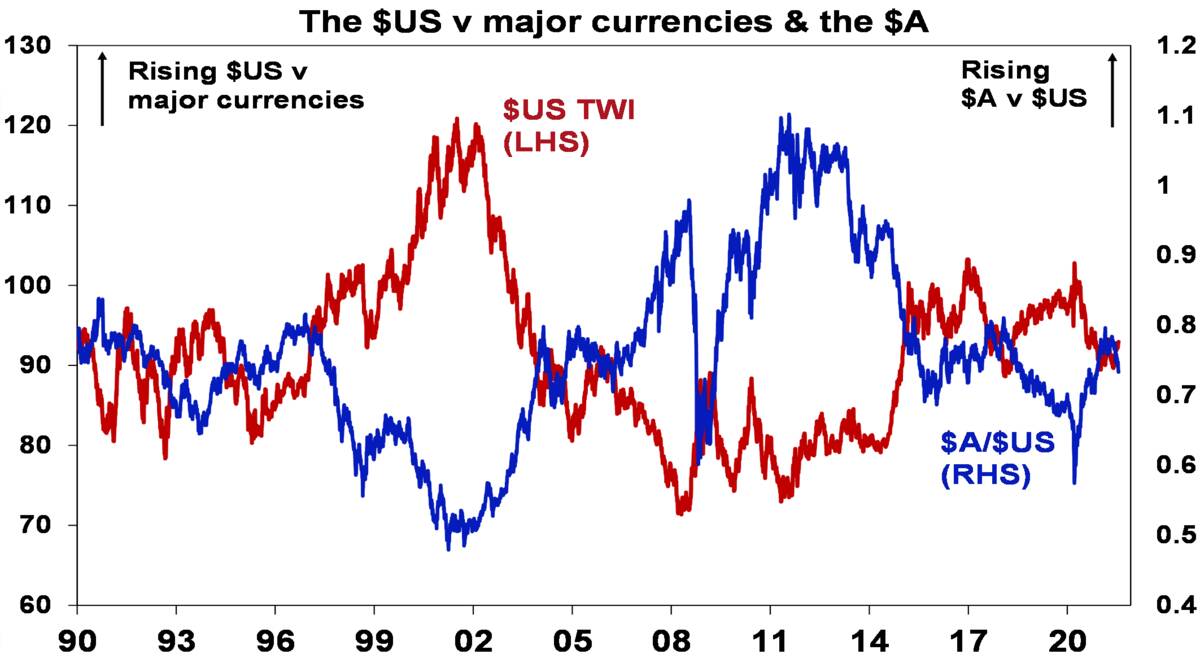
Chart 7 – the US dollar
The US dollar is a counter cyclical currency so big moves in it against a range of currencies are of global significance and bear close watching. Due to the relatively low exposure of the US economy to cyclical sectors like manufacturing and materials, the $US tends to be a “risk-off” currency, ie, it goes up when there are worries about global growth and down when the outlook brightens. If we are right and the global economy continues to recover beyond near term Delta coronavirus concerns, then the $US is likely to decline further (the red line in the next chart will fall further). Recently it’s been going in the wrong direction raising a flag and it could still go up further, which has seen the $A (a “risk-on” currency) decline. However, we anticipate the $US will resume its downswing later this year as vaccines prove their worth and the global economic recovery resumes.
Source: Bloomberg, AMP Capital
Concluding comments
Share markets have had very strong gains from their March 2020 lows (up 96% in the US and up 62% in Australia) and strong gains year to date. This has left them vulnerable to a near term correction – and the US inflation scare and renewed coronavirus fears may provide the trigger. However, this is more likely to be a correction than a trend change as the global and Australian economic recoveries ultimately continue. For further solid gains, beyond likely near-term setbacks, the indicators shown in these charts are worth keeping an eye on.
Singapore prepares to swap its oil hub status for greener future
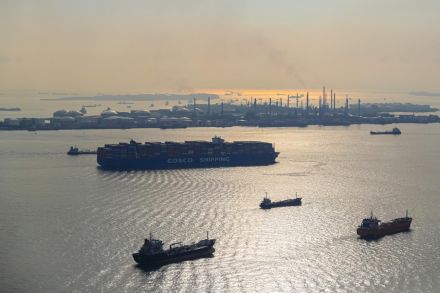
Royal Dutch Shell announced late last year it would slash capacity by half at its biggest oil refinery. For Singapore, where the plant has been a mainstay of the economy for six decades, it marked a turning point in one of the most successful bets on fossil fuels in history.
PHOTO: ST FILE
Royal Dutch Shell announced late last year it would slash capacity by half at its biggest oil refinery. For Singapore, where the plant has been a mainstay of the economy for six decades, it marked a turning point in one of the most successful bets on fossil fuels in history.
The plant on Bukom Island is part of a massive refining and petrochemical industry built largely on reclaimed islands just off the city-state. In tandem with the cargo vessels they fuelled, the refineries helped drive Singapore’s economic success after independence, attracting billions in investment and spawning businesses from plastics to rig construction and finance.
“We’ve come a long way as a result of the energy and chemical sector,” said Tan See Leng, Singapore’s labour minister and second minister for trade and industry. “The key thing is not to completely sort of move away, but to see how we can pivot, how we can transform.”
To that end, the government this year released the Singapore Green Plan 2030, setting out a path for the city-state to become a leading regional hub for carbon trading, green finance, consulting and risk management and other services.
We hope you have enjoyed another edition of the JMP Report, if you would like more information regarding the JMP Services including Funds Management, Custodial Services, buying shares and bonds, contact us for more detail. Is your company Superannuation Compliant?
Have a great week,
Chris Hagan,
Head, Fixed Interest and Superannuation
JMP Securities
Level 1, Harbourside West, Stanley Esplanade
Port Moresby, Papua New Guinea
Mobile (PNG):+675 72319913
Mobile (Int): +61 414529814