27 September, 2021
Welcome to this week’s JMP Report.
Good morning and welcome to this week’s JMP Report. Our commiserations go out to the Manly, Storms and Bulldogs supporters, maybe not a good weekend as a supporter. Until next season.
On the equity front CCP announced their Half Yearly results and the interim dividend which was inclusive of 4.6 toea interim dividend per share, the Group has declared a total of 22.6 toea per share in dividend payments to shareholders in FY 21.
Download Announcement Download Dividend Announcement
Last week on the local bourse, CCP traded 301,666 shares closing unchanged at K1.68 on Friday followed by BSP with 82,442 shares trading, closing up by 0.40 or 3.25% to K12.70 per share. CPL saw 24,128 shares trade closing unchanged at K1.00 along with KSL trading 13,004 shares closing unchanged at K3.25. KAM traded 12,800 shares also closing unchanged at K1.00 whilst OSH traded 6,649 shares down 0.01 toea or -0.09% to close at K10.60 per share. NGP also traded 4,009 shares in its securities closing at K0.70.
|
WEEKLY MARKET REPORT 20.09.21 – 24.09.21 |
|||||||||||
|
STOCK |
QTY |
CLOSING |
CHANGE |
% CHANGE | 2020 Final Div | 2021 Interim | Yield % | Ex Date | Record Date | Payment Date | DRP |
|
BSP |
82,442 |
12.70 |
0.40 |
3.25 | K1.0500 | K0.39000 | 11.61% | Frid 24 Sept | Mon 27 Sept | Mon 18 Sept | No |
|
KSL |
13,004 |
3.25 |
– | 0.00 | K0.1690 | K0.08250 | 7.74% | Wed 01 Sept | Thurs 02 Sept | Fri 01 Oct | No |
|
OSH |
6,649 |
10.60 |
-0.01 | -0.09 | K0.0000 | – | 0.00% | Mon 30 Aug | Mon 20 Sept | Thur 20 Oct | |
|
KAM |
12,800 |
1.00 |
– | 0.00 | K0.0400 | K0.06000 | 10.00% | Wed 15 Sept | Mon 20 Sept | Thurs 20 Oct | Yes |
|
NCM |
– |
75.00 |
– |
0.00 | K0.0000 | – | 10.00% | Thu 26 Aug | Fri 24 Sept | Mon 01 Nov | |
| NGP | 4,009 | 0.70 | – | 0.00 | K0.0000 | – | 10.00% | Fri 17 Sept | Fri 24 Sept | Mon 01 Nov | |
|
CCP |
301,666 |
1.68 |
– | 0.00 | K0.1800 | 0.04600 | 13.45% | Fri 1 Oct | Fri 8 Oct | Fri 26 Nov | Yes |
|
CPL |
24,128 |
1.00 |
– |
0.00 | K0.0000 | K0.0000 | 10.00% | ||||
On the interest rate front, liquidity continues to drive the short end of the market with 364 day TBills still trading at 7.20%.
What we have been reading this week
Experts predict cryptocurrency will dominate financial industry by 2029
A report has revealed why cryptocurrency purchases are soaring among a particular generation of Australians, fuelling a bold prediction.
Bitcoin plunges after brutal crackdown
China ramps up its crypto crackdown

Cryptocurrency experts believe it will surpass traditional finance in Australia as early as 2029 after a new report revealed the country had accumulated $7bn worth of digital coins.
Comparison site Finder has released its annual Cryptocurrency Report with some significant revelations, including that 31 per cent of Gen Z Australians (born after 1997) own some form of crypto.
Cryptocurrencies are virtual or digital forms of money that take on the form of tokens or “coins” using cryptography, making it difficult to be counterfeited.
Australians have amassed $7bn worth of cryptocurrency, with the average investor owning $2078 in assets.
Overall, 17 per cent of Australians own cryptocurrency, while a further 13 per cent said they intended to buy it within the next year.
A nationally representative Finder survey also found 56 per cent of Australians believed tech billionaire Elon Musk invented Bitcoin.
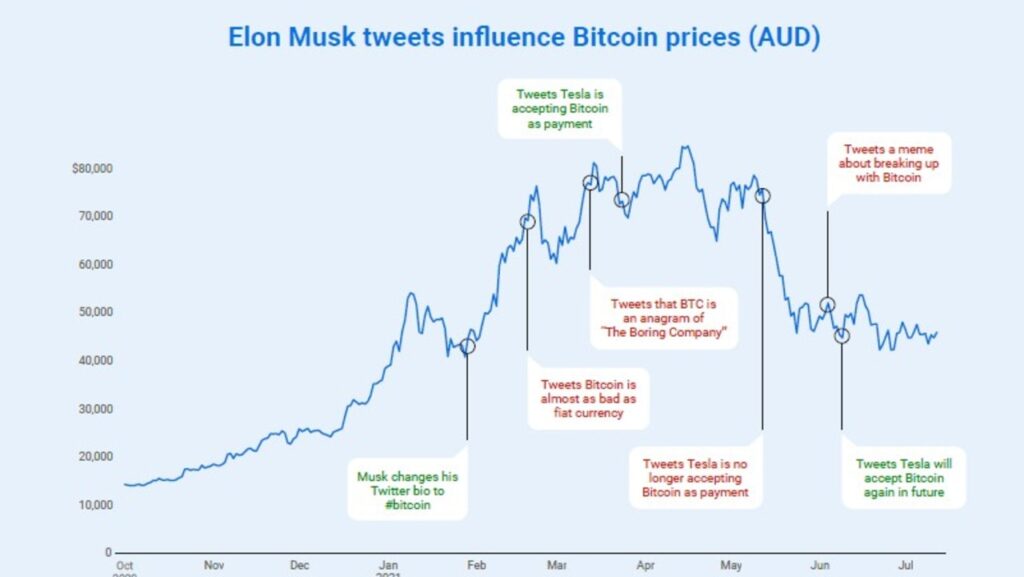
A graph shows the price of Bitcoin fluctuating in comparison to tweets by tech entrepreneur Elon Musk. Picture: Finder
 Bitcoin is the most popular crypto in Australia. Picture: Dan Kitwood/Getty Images
Bitcoin remains the most popular cryptocurrency, owned by 9 per cent of Australian crypto investors, followed by Ethereum (8 per cent), Dogecoin (5 per cent) and Bitcoin Cash (4 per cent).
The biggest revelation out of Finder’s report is that almost 31 per cent of Gen Z Australians (aged 24 and under) own cryptocurrency, and that figure has more than doubled since January.
But ownership of digital coins has dropped in other generations.
Finder’s cryptocurrency expert James Edwards said Gen Z’s behaviour was a sign traditional finance was being phased out in a bold prediction for its future.
“Many Aussies are now much more clear on the benefits cryptocurrencies offer, such as Bitcoin being a hedge against fiat currency and inflation, plus the ability to earn interest on assets through things like stablecoins and decentralised finance on Ethereum,” he said.

Fred Schebesta says the growth in cryptocurrency will explode.
“If the pace of education continues to grow, combined with easier access to cryptocurrencies, we should expect to see it as a dominant financial industry by the end of the decade, especially among younger generations who have never had meaningful access to traditional finance.”
Finder founder Fred Schebesta also predicted digital coins were about to explode.
“As the technology develops and there are easier ways to access it – like in the Finder app where you can buy Bitcoin and Ethereum in a few clicks – I believe the growth in cryptocurrency will explode,” he said.
The report emphasised social media will underpin the growth of cryptocurrencies.
Voluntary carbon markets: how they work, how they’re priced and who’s involved
Silvia Favasuli Vandana Sebastian
2021 will probably be remembered as the year when carbon finance emerged as a talking point among a wide range of industries.
In a market note released at the start of May, the most liquid carbon credits exchange currently, the New York-based Xpansiv CBL, shared a figure that made that clear: on May 7, CBL’s year-to-date carbon volume of more than 30 million tons of CO2 traded emissions was already approaching 2020’s full-year record of 31 million tons.
Among the 2021 new entrants in voluntary carbon markets, oil and gas majors, hedge funds and banks were heard as the most active players, resolutely taking positions in the market.
Many political entities like the EU, the UK or the state of California already have mandatory carbon markets covering specific industry sectors and gases. These form an important part of the effort to meet the Paris Agreement target of limiting global heating to 2 degrees Celsius above preindustrial levels, with a more ambitious ideal of remaining within a 1.5 C increase, although it should be noted that some of these markets predate the Paris commitments.
But other sectors have taken a cue from compliance schemes and pledged to offset their greenhouse gas emissions (GHG) by participating in carbon markets voluntarily.
Voluntary carbon markets allow carbon emitters to offset their unavoidable emissions by purchasing carbon credits emitted by projects targeted at removing or reducing GHG from the atmosphere.
Companies can participate in the voluntary carbon market either individually or as part of an industry-wide scheme.
While compliance markets are currently limited to carbon credits from a specific region, voluntary carbon credits are significantly more fluid, unrestrained by boundaries set by nation-states or political unions. They also have the potential to be accessed by every sector of the economy instead of a limited number of industries.
The Taskforce on Scaling Voluntary Carbon Markets, sponsored by the Institute of International Finance with support from McKinsey, estimates that the market for carbon credits could be worth upward of $50 billion as soon as 2030.
The participants
Five main players make up the engine of carbon markets.
Project developers
Project developers represent the upstream part of the market, and produce carbon credits. Projects can range from large-scale, industrial style projects like a high-volume hydro plant, to smaller community-based ones like clean cookstoves.
Community-based projects are usually very localized and typically designed and managed by local groups or NGOs. They tend to produce smaller volumes of carbon credits and it is often more expensive to certify them. However, they often generate more additional co-benefits and meet the UN’s Sustainable Development Goals (SDGs), contributing, for example, to improved welfare for the local population, better water quality, or the reduction of economic inequality.
When a carbon credit project also helps to meet some of the SDGs, the value of a credit from that project to potential buyers may be higher, and the credit can trade at a premium to other types of projects.
Industrial projects are typically larger-scale projects that can often produce large volumes of credits with more easily verified GHG offset potential. But this kind of project may not generate strong co-benefits and may not meet additional SDG objectives. For this reason, credits emitted by industrial projects may trade at a discount to projects that do carry SDGs.
The large-scale nature of some types of projects can also raise questions about whether they are truly “additional”, meaning that they would be able to operate without the additional revenue generated from the sale of carbon credits.
This is a particularly salient question in the development of renewable energy projects, given that renewable energy is often cheaper in some regions than the development of new, conventional fossil fuel plants.
End buyers
The downstream market is made of end buyers: companies—or even individual consumers—that have committed to offset part or all of their GHG emissions. Among the early buyers of carbon credits were tech companies such as Apple and Google, airplane operators, and oil and gas majors, but more industry sectors are joining the market as they set their own net-zero targets.
Retail traders
To link supply and demand, there are brokers and retail traders, just as in other commodity markets. Retail traders purchase large amounts of credits directly from the supplier, bundle those credits in portfolios, ranging from hundreds to hundreds or thousands of mtCO2e, and sell those bundles to the end buyers, typically with some commission.
Brokers
Brokers buy carbon credits from a retailer trader and market them to an end-buyer, usually with some commission.
Standards
There is a fifth player unique to carbon markets. Standards are organizations, usually NGOs, which certify that a particular project meets its stated objectives and its stated volume of emissions.
Standards have a series of methodologies, or requirements, for each type of carbon project. For example, a reforestation project will follow specific rules when calculating the level of CO2 absorption of the planned forest and therefore the number of carbon credits it produces over time.
A renewable energy project will have a different set of specific rules to follow when calculating the benefit in terms of avoided CO2 emissions and carbon credits generated over time.
As of January 2021, the number of carbon credits issued by the largest Standards (UN Clean Development Mechanism, Verra, the American Carbon Registry, Climate Action Reserve and Gold Standard), totaled 3,110 million mt of CO2. Of these, 810 million mt were still available in January, while 2,300 million mt had already been offset and therefore retired, meaning that those credits had been used by buyers to offset their emissions.
Overlapping roles, bilateral trade
There is an overlapping of roles that is specific to carbon markets.
Many brokers act as traders, and many financiers have both brokering arms and project development arms. All these groups may ultimately market credits to a buyer, or a developer may arrange to sell them direct. All these juxtapositions can have an impact on price, and ultimately affect market transparency.
While most of the transactions are currently happening in private conversations and over-the-counter deals, some exchanges are also emerging. Often, the exchanges are used to settle large bilateral deals that have been negotiated offscreen.
In a market note released May 7, Xsignals, a data company owned by CBL exchange operator Xpansiv, said that ever larger numbers of bilateral deals negotiated offscreen are being brought by traders on the CBL platform to be settled. These deals make up a significant portion of recent volume transacted on CBL.
Pricing a diverse supply
When a company turns to voluntary carbon markets as a potential way to compensate for its carbon emissions, one of the key pieces of information it looks for is the price of carbon credits. With this information, a company can decide how ambitious it can be when setting its emission reduction target and whether voluntary markets can really help in reaching it.
At the same time, a clear price signal for carbon allows players already involved in the market to make sure that they are trading their credit at a price that reflects the real market value.
But putting a price on carbon credits is far from a straightforward operation, mostly because of the wide variety of credits in the market.
Projects emitting carbon credits can be of many different types and sub-types. The nature of the underlying project is one of the main factors affecting the price of the credit. As mentioned above, for example, community-based projects can be priced at premiums to industrial projects.
Carbon credits can be grouped into three large categories or baskets: avoidance projects (they avoid emitting GHGs completely), reduction (they reduce the volume of GHGs emitted into the atmosphere) and removal (they remove GHG directly from the atmosphere).
The avoidance basket includes renewable energy projects—wind and solar power, hydroelectric power, and biofuel development including biogas—but also forestry and farming emissions avoidance projects. The latter, which are also known as REDD+, prevent deforestation or wetland destruction, or use soil management practices in farming that limit GHG emissions—such as projects aiming to avoid emissions from dairy cows and beef cattle through different diets.
The reduction category includes projects that reduce demand for energy (energy efficiency) including for example cookstove projects, fuel efficiency or the development of energy-efficient buildings. Plans to capture and destroy industrial pollutants are also part of this group (destruction of industrial pollutants). Another example is the methane collection and combustion group of projects, which involve the combustion or containment of methane generated through farming, landfills and heavy industry.
In the removal category there are reforestation projects, afforestation projects and wetland management (forestry and farming). Plans to remove the existing carbon in the atmosphere, including direct air capture, and neutralize it with permanent underground storage, fall into this basket (carbon capture).
Other factors impacting price are the volume of CO2 emissions traded (the higher the volume the lower the price, usually), the geography of the project, its vintage –the year when the credit was “produced” (typically, the older the vintage the cheaper the price); and the delivery time.
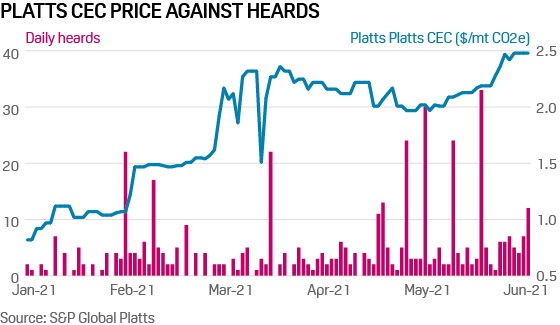
In current carbon markets, the price of one carbon credit can vary from a few cents per metric ton of CO2 emissions to $15/mtCO2e or even $20/mtCO2e. S&P Global Platts assesses the price of carbon credits traded within the CORSIA voluntary market (Platts CEC), which is one of the few commoditized parts of a market that otherwise defies commoditization. Platts began publishing new daily carbon credit price assessments that reflect nature-based carbon credit (CNC) projects and household device carbon credit projects from June 14, 2021.
Platts defines nature-based projects as forestry and land use including projects that avoid deforestation (including REDD/REDD+), afforestation, reforestation, no-till farming projects, soil sequestration (including biochar), wetland management and/or restoration, and reduced methane from livestock. Projects captured by the Platts household devices carbon credit assessment include clean cookstoves projects, clean water access and improved building energy efficiency projects. The assessment reflects projects that carry standard sustainable development goal (SDG) co-benefits, like good health and well-being.
CORSIA scheme
The Carbon Offsetting and Reduction Scheme for International Aviation (CORSIA) is one of the most clearly defined industry-wide voluntary schemes. Airline operators taking part in CORSIA have pledged to offset all the CO2 emissions they will produce above a baseline 2019 level.
Airlines intend to do this—at least in part—by purchasing carbon credits emitted by projects certified by international agencies and recognized as CORSIA-eligible. The first part of the scheme from 2021 to 2026 is voluntary. From 2027, CORSIA will become mandatory for almost all international routes. While CORSIA credits are one of the ways through which the aviation industry plans to achieve its ambitious climate goals, it is not the only way. The aviation industry has also committed to technology, operations and infrastructure advancement as well as focus on fuel efficiency.
Platts collects bid, offers and trades for carbon credits that are considered eligible for the CORSIA market and that have been certified by the following standards: The Gold Standard, Climate Action Reserve (CAR), Verified Carbon Standard (VCS), Architecture for REDD+ Transactions, and American Carbon Registry.
Price indications are collected directly from market participants during every trading day.
Go deeper: S&P Global Platts CEC assessments and summary on PlattsLIVE
The CEC reflects the spot market for specific vintages and for delivery in the current year (spot prices). It does not reflect price differences caused by project co-benefits or location.
These credits are measured in $/mtCO2e, and each one is made of a minimum of 5 lots of 1,000 CO2e units.
The CEC price represents the most competitive way at which end-buyers can fulfill their CORSIA offsetting goals on a given day and therefore it usually reflects some of the most competitively priced credits being traded in the market, be it from a wind power plant or from a reforestation project.
Given the wide array of credits, Platts also reports price indications for each category of projects as they are traded in the broader voluntary market and not just as part of the CORSIA scheme, in an effort to increase transparency.
Putting a price on each of these baskets will help increase visibility in the still-blurry world of carbon finance.
Although the rise of voluntary carbon markets dates back to the early 2000s, following the ratification of the Kyoto protocol, growth was stunted by the 2008 global economic crisis. The new wave of public and private commitments to curb carbon emissions over recent years is now triggering a resurgence of interest in voluntary carbon credits as one way to manage carbon footprints.
While there are no barriers to entry, the lack of transparency in transactions and insufficient understanding of how carbon finance works have kept many potentially interested players at bay.
However, the growing interest in understanding voluntary carbon markets, as well as the efforts of several players to scale and standardize operations, suggest that carbon finance will soon be able to attract new entrants and increase in size.
We hope you have enjoyed this weeks read, if you would like to find out more about investing in Bonds or Shares, please do reach out for our assistance.
Regards,
Chris Hagan,
Head, Fixed Interest and Superannuation
JMP Securities
Level 1, Harbourside West, Stanley Esplanade
Port Moresby, Papua New Guinea
Mobile (PNG):+675 72319913
Mobile (Int): +61 414529814