15 – 19 June 2026
Weekly Trade Commentary
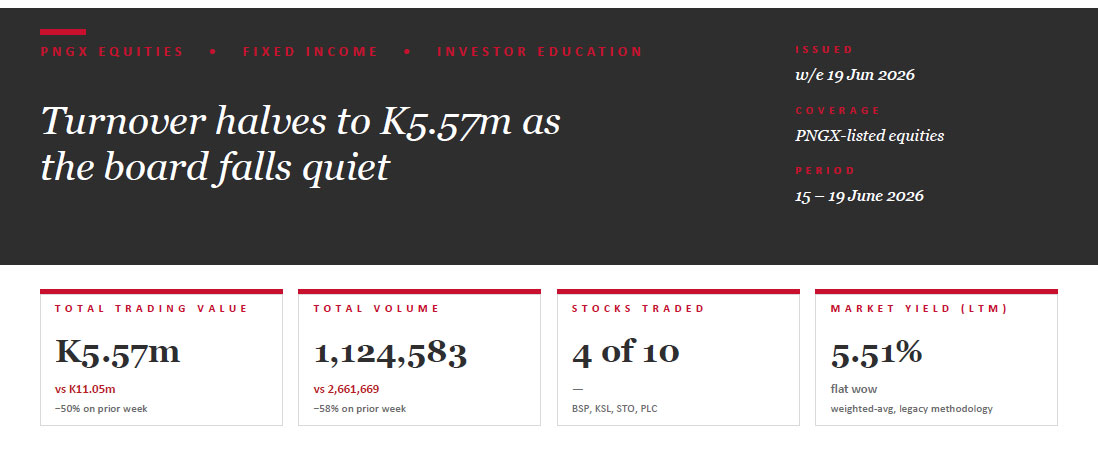
- A much quieter week — just 4 stocks traded for K5.57m, roughly half last week’s K11.05m.
- Total volume fell 58% to 1,124,583 shares.
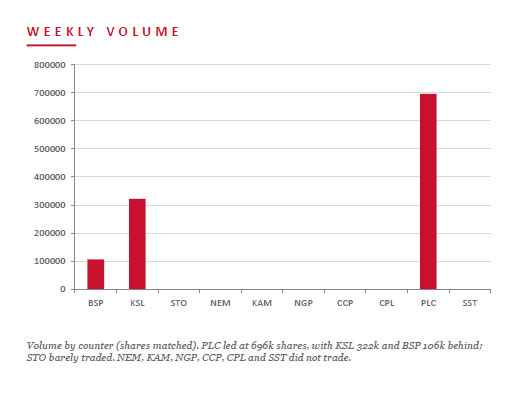
- PLC led activity with 696,260 shares, steady at K1.45 for K1.01m.
- BSP traded 106,266 shares, easing 5t to K27.95, for K2.97m.
- KSL traded 321,802 shares but softened 10t to K4.85.
- STO added just 255 shares at K22.36.
- NEM, KAM, NGP, CCP, CPL and SST did not trade.
WEEKLY MARKET REPORT | 15 June, 2026 – 19 June, 2026
| STOCK | WEEKLY VOLUME | CLOSING PRICE | VALUE | CHANGE | % CHANGE |
|---|---|---|---|---|---|
| BSP | 106,266 | 27.95 | 2,972,194.05 | −0.05 | −0.18% |
| KSL | 321,802 | 4.85 | 1,582,833.76 | −0.10 | −2.02% |
| STO | 255 | 22.36 | 5,701.80 | — | — |
| NEM | — | 490.00 | — | — | — |
| KAM | — | 2.12 | — | — | — |
| NGP | — | 1.36 | — | — | — |
| CCP | — | 4.66 | — | — | — |
| CPL | — | 0.79 | — | — | — |
| PLC | 696,260 | 1.45 | 1,009,577.00 | — | — |
| SST | — | 50.00 | — | — | — |
| 1,124,583 | TOTAL | 5,570,306.61 | −0.06% |
WEEKLY YIELD CHART | 15 June, 2026 – 19 June, 2026
| STOCK | ISSUED SHARES | MKT CAP (K) | INT 24 | FIN 24 | INT 25 | FIN 25 | YIELD % LTM |
|---|---|---|---|---|---|---|---|
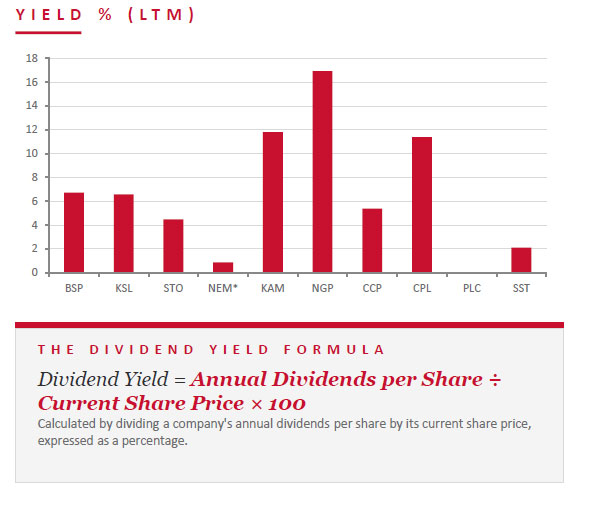
| BSP | 467,317,665 | 13,061,528,737 | 0.450 | 1.210 | 0.500 | 1.380 | 6.73% |
| KSL | 294,332,296 | 1,427,511,636 | 0.106 | 0.155 | 0.126 | 0.193 | 6.58% |
| STO | 3,261,616,703 | 72,929,749,479 | 0.506 | 0.414 | 0.559 | 0.443 | 4.48% |
| NEM* | 1,097,000,000 | 537,530,000,000 | — | 2.110 | 2.110 | USD $0.260 | 0.86% |
| KAM | 53,259,588 | 112,910,327 | 0.200 | — | 0.250 | — | 11.79% |
| NGP | 45,890,700 | 62,411,352 | 0.040 | 0.120 | 0.040 | 0.190 | 16.91% |
| CCP | 307,931,332 | 1,434,960,007 | 0.120 | 0.121 | 0.121 | 0.130 | 5.39% |
| CPL | 206,277,911 | 162,959,550 | — | — | 0.050 | 0.040 | 11.39% |
| PLC | 860,718,662 | 1,248,042,060 | — | — | — | — | — |
| SST | 31,008,237 | 1,550,411,850 | 0.400 | 0.300 | 0.400 | 0.650 | 2.10% |
| TOTAL / WEIGHTED-AVG | 5.51% |
Key Market Announcements
- BSP – Update on unauthorised third-party access to Test Environment Download >>
- STO – Appointment of Kate Vidgen as Independent Non-Executive Director Download >>
- STO – Appendix 3X — Initial Director’s Interest Notice (Vidgen) Download >>
- NEM – Form 8-K (as filed) Download >>
- PLC – Appendix 3G — Issue/conversion of unquoted equity securities Download >>
- PNGX – Public Holiday Notice — King’s Official Birthday Download >>
BPNG TREASURY BILL AUCTION
Auction: 16-JUN-26 / GOI / Government Treasury Bill Settlement: 19-JUN-26 Amount on Offer: K290.0m (over-subscribed by K133.25m)
| TERMS | ISSUE / 63 | ISSUE / 91 | ISSUE / 182 | ISSUE / 273 | ISSUE / 364 | TOTAL |
|---|---|---|---|---|---|---|
| Weighted Avg Yield | — | — | 4.61% | 4.97% | 4.98% | — |
| Amount on Offer (K’m) | — | — | 10.00 | 60.00 | 220.00 | 290.00 |
| Bids Received (K’m) | — | — | 55.35 | 138.00 | 229.90 | 423.25 |
| Successful Bids (K’m) | — | — | 10.00 | 60.00 | 220.00 | 290.00 |
| Over / (Under) Subscribed (K’m) | — | — | +45.35 | +78.00 | +9.90 | +133.25 |
BPNG GOVERNMENT BOND AUCTION
MOST RECENT AUCTION — NO NEW ISSUANCE WEEK ENDING 19 JUNE 2026
Auction: 19-MAY-26 / GOB / Government Bond Settlement: 22-MAY-26 Amount on Offer: K380.0m
| SERIES | AMOUNT ON OFFER (K’m) | BIDS RECEIVED (K’m) | SUCCESSFUL BIDS (K’m) | SUCCESSFUL YIELD | WEIGHTED AVG RATE | COUPON RATE | NET SUBSCRIPTION (K’m) |
|---|---|---|---|---|---|---|---|
| Issue ID 2026/5057 — 3 yr | 40.00 | 58.00 | 53.00 | 6.13–6.30% | 6.17% | 6.30% | +18.00 |
| Issue ID 2026/5058 — 5 yr | 100.00 | 137.00 | 100.00 | 6.49–6.49% | 4.49% | 6.70% | +37.00 |
| Issue ID 2026/5059 — 7 yr | 60.00 | 71.00 | 60.00 | 6.61–6.61% | 6.61% | 6.80% | +11.00 |
| Issue ID 2026/5060 — 10 yr | 100.00 | 216.63 | 162.00 | 6.60–6.80% | 6.72% | 6.90% | +116.63 |
| Issue ID 2026/5061 — 15 yr | 80.00 | 164.00 | 80.00 | 7.00–7.17% | 7.06% | 7.30% | +84.00 |
| TOTAL | 380.00 | 646.63 | 455.00 | +266.63 |
INVESTOR EDUCATION – Mergers & Acquisitions
What is M&A?
Mergers and acquisitions (M&A) are transactions in which companies combine or change ownership. In a merger, two companies combine to form a single new entity and shareholders of both typically receive shares in the combined company. In an acquisition, one company buys another, which then either ceases to exist independently or becomes a subsidiary.
Deals come in several forms. A horizontal deal joins competitors in the same industry; a vertical deal links different points of one supply chain; a conglomerate deal combines unrelated industries for diversification; and market- or product-extension deals broaden reach into new markets or adjacent products.
Structure matters. In a stock purchase the buyer acquires the target’s shares — and its contracts and liabilities, including hidden ones. In an asset purchase the buyer takes only specified assets and liabilities: a cleaner risk profile, but one that can trigger taxes and require contracts to be re-assigned.
Why companies do it
- Growth — Acquiring is often faster than building organically, offering instant market share, customers or geographic reach.
- Synergies — Cost synergies and revenue synergies are the classic justification for the premium a buyer pays.
- Capabilities — Buying technology, talent or intellectual property can be quicker and surer than building it internally.
- Defensive & financial — Consolidating before a rival does, neutralising a competitive threat, or buying undervalued assets and using leverage to generate returns.
What we’ve been reading
The energy shock is testing government budgets

IMF Blog — IMF Fiscal Affairs • Dabla-Norris, Mumssen, Valdés & Zakharova
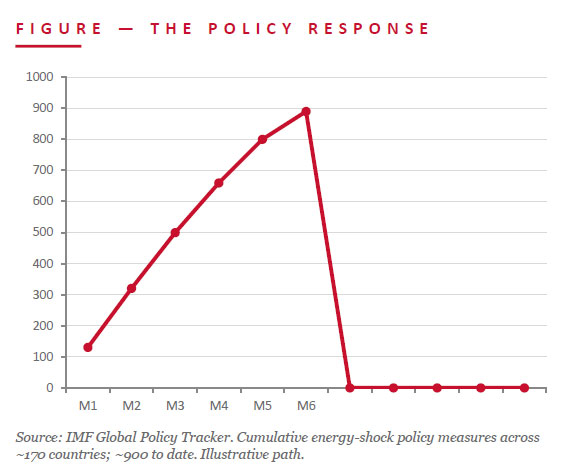
As governments move to shield households and firms from the energy shock caused by the war in the Middle East, early evidence suggests many are reaching for untargeted and potentially expensive policies at a time of tight budgets. A new IMF Global Policy Tracker has recorded nearly 900 measures across about 170 countries since the war began, with fiscal measures dominating as governments limit the pass-through of higher energy prices.
The composition of today’s response broadly resembles the 2022 energy shock — but circumstances differ. Debt-service burdens are rising, fiscal space is limited, and uncertainty is high. A large share of “temporary” measures lack clear expiry dates or costings, and price suppression that compresses margins at state energy firms can resurface later as contingent liabilities. The IMF’s message: protect people, not prices.
JMP read: For PNG the fiscal-discipline lesson lands close to home, though from the other side of the shock. As a net energy and LNG exporter, PNG can see elevated prices support revenue — but the IMF’s warning about untargeted subsidies and eroding fiscal space is a useful frame for the Budget. Targeted support and preserved fiscal room matter more the longer global energy prices stay high.
- Nearly 900 energy-shock policy measures logged across ~170 countries — IMF.
- Fiscal measures dominate; many lack expiry dates or costings — IMF.
- IMF counsel: protect people, not prices — keep support temporary and targeted.
Regards,
Benny Takin
Equities Trader — Primary contact, JMP Weekly Report
benny.takin@jmpmarkets.com
+675 7001 9121 / 320 0240
JMP Securities Limited
Level 3, ADF Haus, Musgrave Street
PO Box 2064, Port Moresby NCD, Papua New Guinea