08 – 12 June 2026
Weekly Trade Commentary
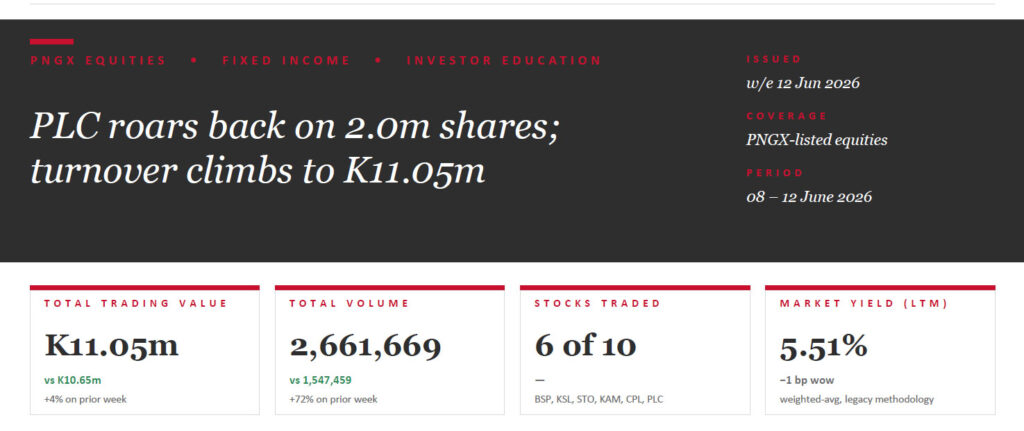
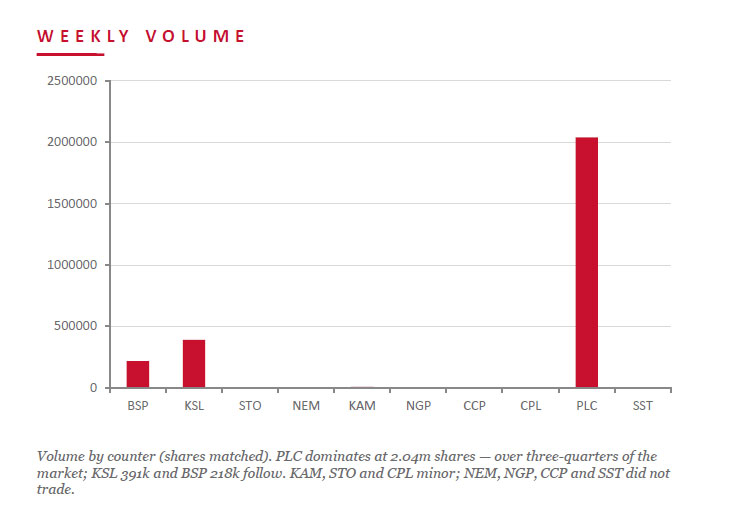
A busier week — 6 stocks traded for K11.05m, up about 4% on last week’s K10.65m, and volume jumped 72% to 2.66m shares as PLC roared back. PLC alone traded 2,041,032 shares, up 5t to K1.45, for K2.93m. BSP held the value anchor at K6.11m, steady at K28.00 on 218,456 shares. KSL traded 390,882 shares up 5t to K4.95, STO 3,161 shares up 6t to K22.36, and KAM 7,144 shares up 1t to K2.12. CPL added 994 shares steady at K0.79.
WEEKLY MARKET REPORT | 08 June, 2026 – 12 June, 2026
| STOCK | WEEKLY VOLUME | CLOSING PRICE | VALUE | CHANGE | % CHANGE |
|---|---|---|---|---|---|
| BSP | 218,456 | 28.00 | 6,111,244.45 | — | — |
| KSL | 390,882 | 4.95 | 1,923,568.05 | +0.05 | +1.02% |
| STO | 3,161 | 22.36 | 70,648.33 | +0.06 | +0.27% |
| NEM | — | 490.00 | — | — | — |
| KAM | 7,144 | 2.12 | 15,145.28 | +0.01 | +0.47% |
| NGP | — | 1.36 | — | — | — |
| CCP | — | 4.66 | — | — | — |
| CPL | 994 | 0.79 | 785.26 | — | — |
| PLC | 2,041,032 | 1.45 | 2,927,111.70 | +0.05 | +3.57% |
| SST | — | 50.00 | — | — | — |
| 2,661,669 | TOTAL | 11,048,503.07 | +0.28% |
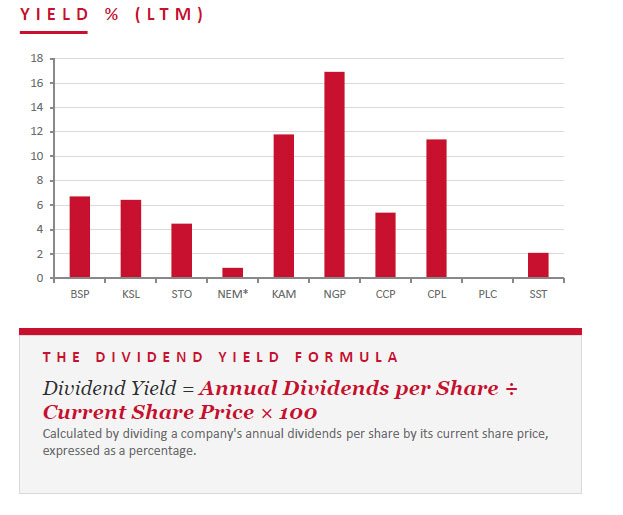
DIVIDEND TABLE (PGK)
| Stock | Number Issued of Shares | Market Cap | 2024 Interim Div | 2024 Final Div | 2025 Interim Div | 2025 Final Div | Yield % LTM |
|---|---|---|---|---|---|---|---|
| BSP | 467,317,665 | 13,084,894,620 | K0.450 | K1.210 | K0.500 | K1.380 | 6.71% |
| KSL | 294,332,296 | 1,456,944,865 | K0.106 | K0.155 | K0.126 | K0.193 | 6.44% |
| STO | 3,261,616,703 | 72,929,749,479 | K0.506 | K0.414 | K0.559 | K0.443 | 4.48% |
| NEM* | 1,097,000,000 | 537,530,000,000 | — | K2.110 | K2.110 | (USD) $0.260 | 0.86% |
| KAM | 53,259,588 | 112,910,327 | K0.200 | — | K0.250 | — | 11.79% |
| NGP | 45,890,700 | 62,411,352 | K0.040 | K0.120 | K0.040 | K0.190 | 16.91% |
| CCP | 307,931,332 | 1,434,960,007 | K0.120 | K0.121 | K0.121 | K0.130 | 5.39% |
| CPL | 206,277,911 | 162,959,550 | — | — | K0.050 | K0.040 | 11.39% |
| PLC | 860,718,662 | 1,248,042,060 | — | — | — | — | — |
| SST | 31,008,237 | 1,550,411,850 | K0.400 | K0.300 | K0.400 | K0.650 | 2.10% |
| TOTAL | 5.51% |
LTM = Last twelve months. Yields use most recently declared interim and final dividends. NEM dividends in USD until PGK rate announced; NEM excluded from market-wide yield. PLC now added.
KEY MARKET ANNOUNCEMENTS
It was an exceptionally quiet week for disclosures — a single PNGX filing. KAM published its Net Tangible Assets (NTA) statement as at 31 May 2026; no other listed company lodged a market announcement during the week.
- Market Announcement: KAM – NTA as at 31 May 2026 Download >>
BPNG TREASURY BILL AUCTION
Auction Number: 10-JUN-26 / GOI / Government Treasury Bill
Settlement Date: 12-JUN-26
Amount on Offer: K480.0 million
| TERMS | ISSUE / 182 | ISSUE / 273 | ISSUE / 364 | TOTAL |
|---|---|---|---|---|
| Weighted Average Yield | 4.73% | 4.99% | 4.97% | — |
| Amount on Offer Kina Million | 60.00 | 90.00 | 330.00 | 480.00 |
| Bids Received Kina Million | 116.63 | 85.00 | 791.68 | 993.31 |
| Successful Bids Kina Million | 60.00 | 85.00 | 335.00 | 480.00 |
| Over / (Under) Subscribed | +56.63 | -5.00 | +461.68 | +513.31 |
BPNG GOVERNMENT BOND AUCTION
MOST RECENT AUCTION — NO NEW ISSUANCE WEEK ENDING 12 JUNE 2026
Auction Number: 19-MAY-26 / GOB / Government Bond
Settlement Date: 22-MAY-26
Amount on Offer: K380.0 million
| SERIES | Amount on Offer (K’million) | Bids Received (K’million) | Successful Bids (K’million) | Successful Bids Yield | Weighted Average Rate (WAR) | Coupon Rate | Overall Auction Net Subscription |
|---|---|---|---|---|---|---|---|
| Issue ID 2026/5057 (3 years) | 40.00 | 58.00 | 53.00 | 6.13%-6.30% | 6.17% | 6.30% | 18.00 |
| Issue ID 2026/5058 (5 years) | 100.00 | 137.00 | 100.00 | 6.49%-6.49% | 4.49% | 6.70% | 37.00 |
| Issue ID 2026/5059 (7 years) | 60.00 | 71.00 | 60.00 | 6.61%-6.61% | 6.61% | 6.80% | 11.00 |
| Issue ID 2026/5060 (10 years) | 100.00 | 216.63 | 162.00 | 6.60%-6.80% | 6.72% | 6.90% | 116.63 |
| Issue ID 2026/5061 (15 years) | 80.00 | 164.00 | 80.00 | 7.00%-7.17% | 7.06% | 7.30% | 84.00 |
| TOTAL | 380.00 | 646.63 | 455.00 | 266.63 |
INVESTOR EDUCATION – CREDIT FIXED INCOME & SPREADS
WHAT IS CREDIT FIXED INCOME?
Credit fixed income is debt issued by corporations, financial institutions, municipalities or governments where investors are paid to take credit risk — the risk the issuer defaults. The two main classes are investment-grade (IG) bonds (higher quality, lower yield) and high-yield (HY) or “junk” bonds (lower quality, higher yield).
The idea that ties it together is the credit spread: the extra yield, in basis points, a bond pays above a risk-free benchmark such as US Treasuries to compensate for credit risk. The spread reflects the market’s read on probability of default, loss given default, and liquidity.
Spreads are not static — they widen when risk rises and tighten when confidence grows, and they are highly cyclical. The 2008 financial crisis and the 2020 COVID shock show up as sharp spikes, with high-yield spreads moving far more violently than investment-grade.
FOUR KEY TAKEAWAYS
- Spread = compensation for risk
The wider the spread, the more investors demand to hold a bond — and the cheaper that bond is relative to its risk-free alternative. Spread is, in essence, the price of credit risk. - IG vs HY is a structural divide
Many funds can only hold investment-grade paper, so downgrades across the BBB/BB line force selling. That structural divide can amplify spread moves well beyond any change in fundamentals. - Spreads are a leading indicator
Widening credit spreads often signal deteriorating economic confidence before it shows up in equity prices or GDP data — which is why credit markets are watched as an early warning. - Two risk dimensions: rate + spread
A credit investor faces both interest-rate risk (duration) and credit-spread risk. The two are distinct and can each hurt returns independently, even when the other is benign.
WHAT WE’VE BEEN READING
Is AI starting to pay its way?

Monthly Bell — Bell Potter • Rob Crookston, Strategist
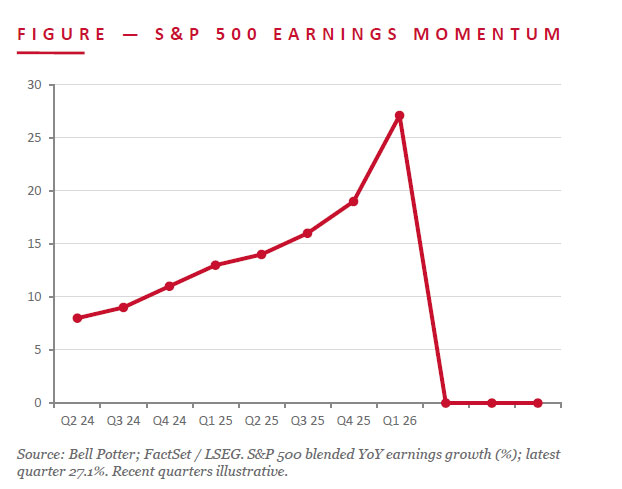
The bear case on AI always rested on one question: when does the spending pay off? After two years of hyperscalers pouring capital into chips, power and data centres at a dot-com pace, the first-quarter US reporting season gives the clearest answer yet — and it isn’t the sceptics’. With two-thirds of the S&P 500 reported, 84% beat on earnings and 80% on revenue; year-on-year earnings growth was revised up to 27.1%, a sixth straight double-digit quarter, with 2026 estimates lifted 2.6% since March.
The build-out is being validated. Close to US$700bn of capex is forecast from the four largest hyperscalers this year, yet demand is outrunning supply: remaining performance obligations at Amazon, Google and Meta are up more than 120% and now top US$1 trillion, while backlogs at power and infrastructure suppliers are up 100–110%. Margins are improving too — the blended net margin sits at 14.7%, above its 12.3% five-year average.
JMP read: The read-through for PNG is indirect but real. The AI capex super-cycle is tightening global markets for power, copper and construction inputs — demand that underpins commodity prices and, by extension, PNG’s resource-linked names and the kina. It also shows why global credit conditions (this week’s Investor Education topic) matter locally: cheaper, more confident capital eases the financing backdrop for PNG’s larger issuers.
Regards,
JMP Securities Team
a. Level 3, ADF Haus, Musgrave St., Port Moresby NCD Papua New Guinea
p. PO Box 2064, Port Moresby NCD Papua New Guinea
Benny Takin
Email: benny.takin@jmpmarkets.com
Ph: +675 7001 9121 / 320 0240