
PNGX Equities • Fixed Income • Investor Education
Broad rebound lifts turnover to K11.96m; seven counters trade
JMP Weekly Report | Week ending 17 July 2026
|
Trading Value
K11.96m
+79% on prior week
|
Total Volume
6,229,273
+47% on prior week
|
Stocks Traded
7 of 10
BSP, KSL, KAM, NGP, CCP, CPL, PLC
|
Market Yield (LTM)
5.51%
Weighted average
|
Download as PDF >>
Weekly Trade Commentary
A broad rebound saw seven stocks trade for K11.96 million, up 79% on the previous week’s K6.69 million, while volume increased 47% to 6.23 million shares. PLC again led activity with 5,690,147 shares traded steadily at K1.48, representing K8.42 million in value. Breadth also returned: KSL traded 402,189 shares at K4.74 for K1.90 million, BSP rose 5 toea to K28.00, and CPL jumped 10 toea, or 11.8%, to K0.95 on 62,610 shares. CCP eased 1 toea to K4.65, KAM firmed 9 toea to K2.21, and NGP added 481 shares at K1.35. STO did not trade.
| Stock | Volume | Close (K) | Value (K) | Change | Change % |
|---|---|---|---|---|---|
| BSP | 53,046 | 28.00 | 1,484,242.05 | +0.05 | +0.18% |
| KSL | 402,189 | 4.74 | 1,899,663.19 | — | — |
| STO | — | 22.37 | — | — | — |
| NEM | — | 490.00 | — | — | — |
| KAM | 2,800 | 2.21 | 6,188.00 | +0.09 | +4.25% |
| NGP | 481 | 1.35 | 649.35 | — | — |
| CCP | 18,000 | 4.65 | 83,700.00 | −0.01 | −0.21% |
| CPL | 62,610 | 0.95 | 59,479.50 | +0.10 | +11.76% |
| PLC | 5,690,147 | 1.48 | 8,421,417.56 | — | — |
| SST | — | 50.00 | — | — | — |
| TOTAL | 6,229,273 | 11,955,339.65 | +0.05% |
Source: PNGX matched on-market trades, week ending 17 July 2026. JMP Securities analysis.
Dividend Yield
The market-wide trailing-twelve-month dividend yield held at 4.77% this week, weighted by market capitalisation under the legacy methodology, and remained steady week on week even as several counters repriced. CPL’s yield fell to 9.47% as it jumped to K0.95, KAM eased to 11.31% on its move to K2.21, and NGP firmed to 17.04%. NGP still leads, followed by KAM and CPL. KSL yielded 6.73%, BSP 6.71%, CCP 5.40%, STO 4.48% and SST 2.10%. PLC remains pre-dividend, while NEM is excluded from the market-wide yield because its dividends are declared in US dollars until a PGK rate is announced.
| Stock | Issued Shares | Market Cap (K) | Int 24 | Fin 24 | Int 25 | Fin 25 | Yield |
|---|---|---|---|---|---|---|---|
| BSP | 467,317,665 | 13,084,894,620 | 0.450 | 1.210 | 0.500 | 1.380 | 6.71% |
| KSL | 294,332,296 | 1,395,135,083 | 0.106 | 0.155 | 0.126 | 0.193 | 6.73% |
| STO | 3,261,616,703 | 72,929,749,479 | 0.506 | 0.414 | 0.559 | 0.443 | 4.48% |
| NEM* | 1,097,000,000 | 537,530,000,000 | — | 2.110 | 2.110 | USD $0.260 | 0.86% |
| KAM | 53,259,588 | 117,703,689 | 0.200 | — | 0.250 | — | 11.31% |
| NGP | 45,890,700 | 61,952,445 | 0.040 | 0.120 | 0.040 | 0.190 | 17.04% |
| CCP | 307,931,332 | 1,431,880,694 | 0.120 | 0.121 | 0.121 | 0.130 | 5.40% |
| CPL | 206,277,911 | 195,964,015 | — | — | 0.050 | 0.040 | 9.47% |
| PLC | 860,718,662 | 1,273,863,620 | — | — | — | — | — |
| SST | 31,008,237 | 1,550,411,850 | 0.400 | 0.300 | 0.400 | 0.650 | 2.10% |
| TOTAL / WEIGHTED AVERAGE | 5.51% | ||||||
Key Market Announcements
Three PNGX-listed companies filed announcements during the week. KAM published its Net Tangible Assets statement as at 30 June 2026, STO lodged four Unquoted Securities notices, and KSL named its Person Responsible for Communications with the ASX and PNGX.
| Stock | Announcement |
|---|---|
| KAM | NTA as at 30 June 2026 |
| STO | Unquoted Securities notices (×4) One Two Three Four |
| KSL | Person Responsible for Communications with ASX & PNGX |
Source: PNGX market announcements, 13–17 July 2026.
BPNG Treasury Bill Auction
Auction: 15 July 2026 | Settlement: 17 July 2026 | Amount on offer: K270.0 million
| Terms | 63 days | 91 days | 182 days | 273 days | 364 days | Total |
|---|---|---|---|---|---|---|
| Weighted Average Yield | — | — | 4.86% | 5.04% | 5.03% | — |
| Amount on Offer (K’m) | — | — | 20.00 | 50.00 | 200.00 | 270.00 |
| Bids Received (K’m) | — | — | 17.00 | 42.00 | 164.59 | 223.59 |
| Successful Bids (K’m) | — | — | 17.00 | 42.00 | 164.59 | 223.59 |
| Over / (Under) Subscribed (K’m) | — | — | −3.00 | −8.00 | −35.41 | −46.41 |
BPNG Government Bond Auction
There was no new Government Bond issuance during the week ending 17 July 2026. The most recent auction was held on 23 June 2026, with settlement on 26 June 2026. K200.0 million was offered, with bids received totalling K369.25 million and successful bids of K239.65 million.
| Series | Offer (K’m) | Bids (K’m) | Successful (K’m) | Successful Yield | Weighted Avg | Coupon | Net Subscription (K’m) |
|---|---|---|---|---|---|---|---|
| 2026/5057 – 3 yr | 20.00 | 49.00 | 49.00 | 6.11–6.20% | 6.16% | 6.20% | +29.00 |
| 2026/5058 – 5 yr | 50.00 | 110.50 | 72.50 | 6.30–6.43% | 6.40% | 6.60% | +60.50 |
| 2026/5059 – 7 yr | 40.00 | 112.50 | 62.50 | 6.48–6.59% | 6.56% | 6.70% | +72.50 |
| 2026/5060 – 10 yr | 50.00 | 55.65 | 55.65 | 6.30–6.73% | 6.72% | 6.80% | +5.65 |
| 2026/5061 – 15 yr | 40.00 | 41.60 | 0.00 | — | — | 7.20% | +1.60 |
| TOTAL | 200.00 | 369.25 | 239.65 | +169.25 | |||
Investor Education: Sovereign Wealth Funds
A sovereign wealth fund (SWF) is a state-owned investment vehicle that manages national assets, typically surplus commodity revenue, foreign exchange reserves or fiscal surpluses. These funds invest at home and abroad to meet long-term public objectives rather than day-to-day budget needs.
SWFs differ from central bank foreign exchange reserves, which are held for liquidity and currency management, and public pension funds, which exist to meet defined liabilities. Their broader mandates generally fall into four categories:
| 01 | Stabilisation funds Help smooth government spending against volatile commodity revenue. |
| 02 | Savings or future-generations funds Convert a depleting resource into a lasting financial endowment. |
| 03 | Reserve investment funds Invest part of excess foreign exchange reserves for higher returns. |
| 04 | Strategic development funds Support domestic infrastructure and industrial policy. |
Governance is the key distinction between well-run funds and troubled ones. Clear mandates, ring-fenced objectives, legal independence and strong accountability help prevent political patronage and resource mismanagement.
What We’ve Been Reading
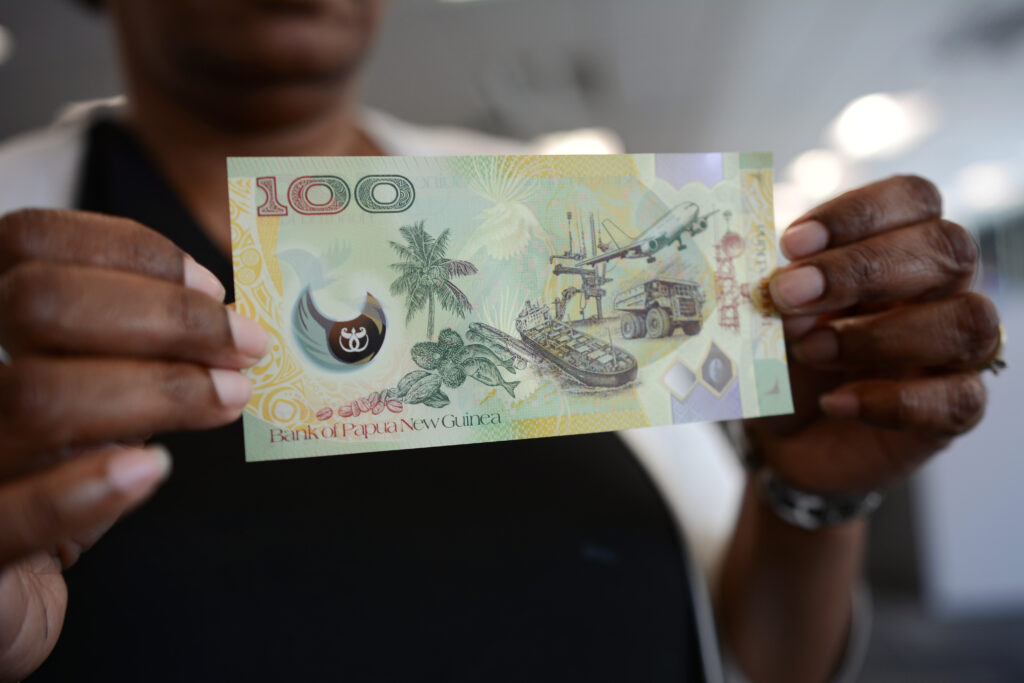
Featured Read
Sovereign wealth funds need legal clarity as they grow
IMF Blog • Yan Liu, Deputy General Counsel
Sovereign wealth funds now manage more than US$16 trillion globally, up from about US$3 trillion in 2008. As their mandates expand into infrastructure, social policy and industrial development, vague or overlapping responsibilities can weaken accountability, distort budgets and obscure public debt.
JMP read: The topic is particularly relevant to Papua New Guinea as its Sovereign Wealth Fund develops alongside new resource projects. The IMF’s message is that a fund is only as strong as its legal and governance framework. Clear mandates, ring-fenced objectives and genuine independence separate successful funds from cautionary examples.
For Further Enquiries
Speak to your equities trader for orders, research questions or market colour.
Benny Takin
Equities Trader – Primary contact, JMP Weekly Report
benny.takin@jmpmarkets.com
+675 7001 9121 / 320 0240
Disclaimer
This report has been prepared by JMP Securities Limited (Capital Market Licence holder, Securities Commission of PNG). It is general information only and does not take into account the objectives, financial situation or needs of any particular person. It is not an offer or solicitation to buy or sell any security. Information is sourced from PNGX, Bank of Papua New Guinea and external publications cited herein, with JMP analysis. While reasonable care has been taken, no warranty is given as to accuracy or completeness; to the maximum extent permitted by law JMP accepts no liability for loss arising from reliance on this material. Investors should obtain independent professional advice before making any investment decision.