
 06 – 10 July 2026
Weekly Trade Commentary
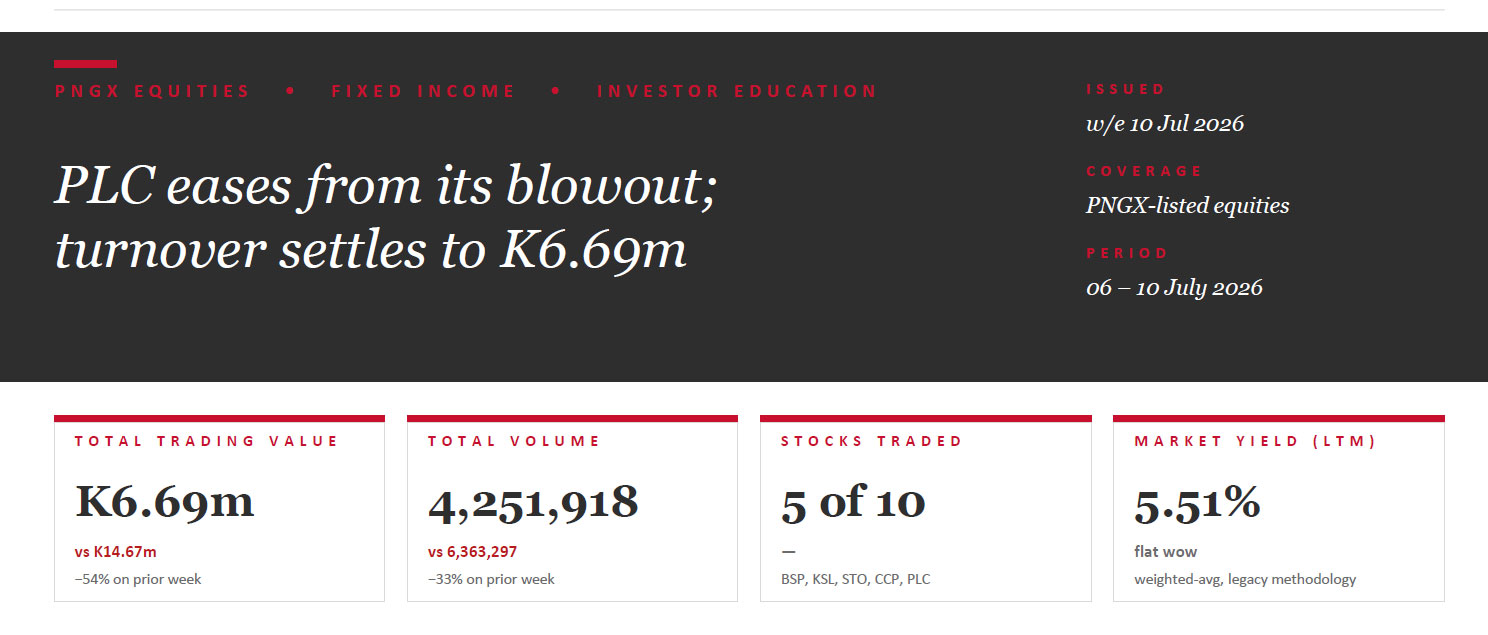
- Activity cooled from last week’s PLC blowout — turnover fell 54% to K6.69m and volume eased 33% to 4.25m shares, though PLC still dominated.
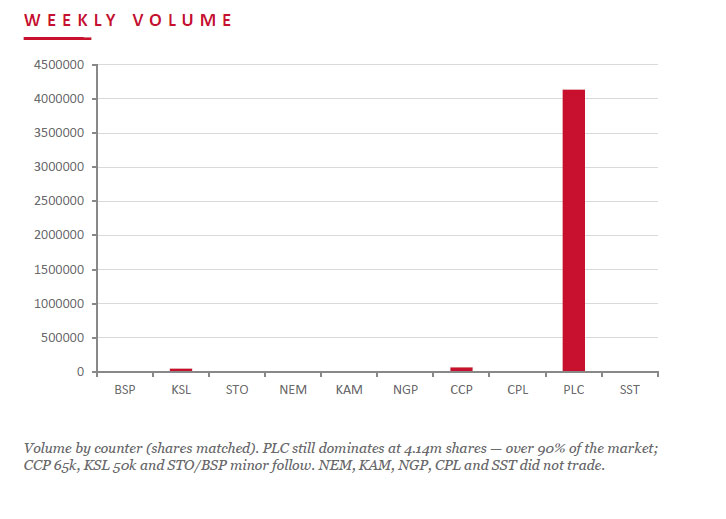
- PLC traded 4,136,166 shares, steady at K1.48, for K6.12m — still over 90% of the market.
- CCP was next most active at 65,016 shares steady at K4.66 (K0.30m), and KSL traded 49,541 shares but softened 11t to K4.74.
- BSP firmed 5t to K27.95 on just 945 shares, and STO edged up 1t to K22.37 on 250.
- CPL and the rest sat out.
WEEKLY MARKET REPORT | 06 July, 2026 – 10 July, 2026
| STOCK | WEEKLY VOLUME | CLOSING PRICE | VALUE | CHANGE | % CHANGE |
|---|---|---|---|---|---|
| BSP | 945 | 27.95 | 26,372.80 | +0.05 | +0.18% |
| KSL | 49,541 | 4.74 | 233,512.09 | −0.11 | −2.22% |
| STO | 250 | 22.37 | 5,592.50 | +0.01 | +0.04% |
| NEM | — | 490.00 | — | — | — |
| KAM | — | 2.12 | — | — | — |
| NGP | — | 1.36 | — | — | — |
| CCP | 65,016 | 4.66 | 302,620.66 | — | — |
| CPL | — | 0.85 | — | — | — |
| PLC | 4,136,166 | 1.48 | 6,121,525.68 | — | — |
| SST | — | 50.00 | — | — | — |
| 4,251,918 | TOTAL | 6,689,623.73 | +0.03% |
Source: PNGX matched on-market trades, week ending 10 July 2026. JMP Securities analysis.
WEEKLY YIELD CHART | 06 July, 2026 – 10 July, 2026
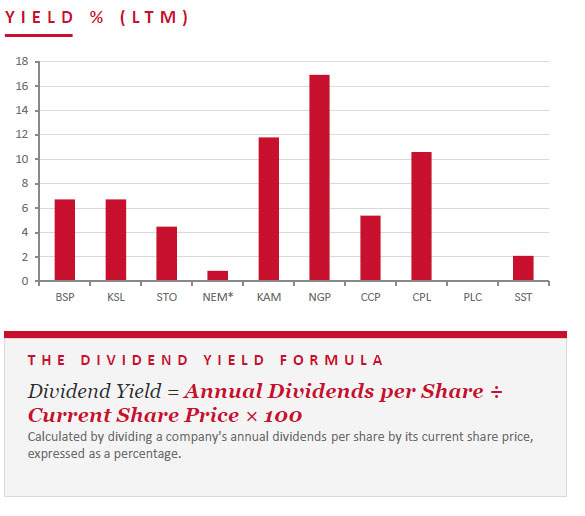
Market-wide LTM dividend yield held at 4.77% this week (weighted by market cap, legacy methodology), steady week on week. KSL’s yield ticked up to 6.73% as it eased to K4.74, while BSP held at 6.73% on its move to K27.95. NGP (16.91%) still leads, with KAM (11.79%) and CPL (10.59%) next. BSP (6.73%), KSL (6.73%), CCP (5.39%) and STO (4.48%) follow, with SST at 2.10%. PLC remains pre-dividend.
| STOCK | ISSUED SHARES | MKT CAP (K) | INT 24 | FIN 24 | INT 25 | FIN 25 | YIELD % LTM |
|---|---|---|---|---|---|---|---|
| BSP | 467,317,665 | 13,061,528,737 | 0.450 | 1.210 | 0.500 | 1.380 | 6.73% |
| KSL | 294,332,296 | 1,395,135,083 | 0.106 | 0.155 | 0.126 | 0.193 | 6.73% |
| STO | 3,261,616,703 | 72,929,749,479 | 0.506 | 0.414 | 0.559 | 0.443 | 4.48% |
| NEM* | 1,097,000,000 | 537,530,000,000 | — | 2.110 | 2.110 | USD $0.260 | 0.86% |
| KAM | 53,259,588 | 112,910,327 | 0.200 | — | 0.250 | — | 11.79% |
| NGP | 45,890,700 | 62,411,352 | 0.040 | 0.120 | 0.040 | 0.190 | 16.91% |
| CCP | 307,931,332 | 1,434,960,007 | 0.120 | 0.121 | 0.121 | 0.130 | 5.39% |
| CPL | 206,277,911 | 175,336,224 | — | — | 0.050 | 0.040 | 10.59% |
| PLC | 860,718,662 | 1,273,863,620 | — | — | — | — | — |
| SST | 31,008,237 | 1,550,411,850 | 0.400 | 0.300 | 0.400 | 0.650 | 2.10% |
| TOTAL / WEIGHTED-AVG | 5.51% | ||||||
LTM = Last twelve months. Yields use most recently declared interim and final dividends. NEM dividends in USD until PGK rate announced; NEM excluded from market-wide yield. PLC now added.
Key Market Announcements
It was a quiet week for disclosures — a single PNGX filing. KSL published a Market Guidance Announcement; no other listed company lodged a market announcement during the week.
- KSL – Market Guidance Announcement Download >>
Source: PNGX market announcements, 06 – 10 July 2026.
BPNG TREASURY BILL AUCTION
Auction: 08-JUL-26 / GOI / Government Treasury Bill
Settlement: 10-JUL-26
Amount on Offer: K270.0m (over-subscribed by K85.59m)
| TERMS | ISSUE / 63 | ISSUE / 91 | ISSUE / 182 | ISSUE / 273 | ISSUE / 364 | TOTAL |
|---|---|---|---|---|---|---|
| Weighted Avg Yield | — | — | 4.85% | 4.99% | 5.01% | |
| Amount on Offer (K’m) | — | — | 20.00 | 50.00 | 200.00 | 270.00 |
| Bids Received (K’m) | — | — | 22.75 | 78.00 | 254.84 | 355.59 |
| Successful Bids (K’m) | — | — | 20.00 | 50.00 | 200.00 | 270.00 |
| Over / (Under) Subscribed (K’m) | — | — | +2.75 | +28.00 | +54.84 | +85.59 |
Source: Bank of Papua New Guinea — Domestic Markets Department, T-Bill auction 08 July 2026 (settlement 10 July 2026).
BPNG GOVERNMENT BOND AUCTION
MOST RECENT AUCTION — NO NEW ISSUANCE WEEK ENDING 10 JULY 2026
Auction: 23-JUN-26 / GOB / Government Bond
Settlement: 26-JUN-26
Amount on Offer: K200.0m
Net Subscription: K169.25m
| SERIES | OFFER | BIDS | SUCCESSFUL | YIELD | AVG RATE | COUPON | NET SUB. |
|---|---|---|---|---|---|---|---|
| 2026/5057 — 3 yr | 20.00 | 49.00 | 49.00 | 6.11–6.20% | 6.16% | 6.20% | +29.00 |
| 2026/5058 — 5 yr | 50.00 | 110.50 | 72.50 | 6.30–6.43% | 6.40% | 6.60% | +60.50 |
| 2026/5059 — 7 yr | 40.00 | 112.50 | 62.50 | 6.48–6.59% | 6.56% | 6.70% | +72.50 |
| 2026/5060 — 10 yr | 50.00 | 55.65 | 55.65 | 6.30–6.73% | 6.72% | 6.80% | +5.65 |
| 2026/5061 — 15 yr | 40.00 | 41.60 | 0.00 | — | — | 7.20% | +1.60 |
| TOTAL | 200.00 | 369.25 | 239.65 | +169.25 | |||
Source: Bank of Papua New Guinea — Domestic Markets Department, GOB auction 23 June 2026 (settlement 26 June 2026).
INVESTOR EDUCATION – Investment Banking
What is Investment Banking (IB)?
Investment banking is the branch of finance that helps corporations, governments and large institutions raise capital and navigate major transactions. Rather than serving everyday retail customers, investment banks act as intermediaries between organizations that need money — or need to buy or sell something big — and the investors who supply it.
At its core an investment bank sits between two groups: clients (companies and governments needing capital or advice) and investors (who supply it). It earns fees and commissions on deals rather than income from customer deposits — which is what separates it from a commercial or retail bank.
A special note on restructuring: when a company is in financial distress, bankers renegotiate debt terms with lenders out of court or guide the company (or its creditors) through formal insolvency. This group tends to get busiest when the economy is weak — exactly when other deal flow dries up.
Core functions
- Capital raising — Underwriting IPOs, follow-on share offerings and bond issuance — essentially pricing and selling new securities to investors on a client’s behalf.
- M&A advisory — Advising companies on mergers, acquisitions, divestitures and restructurings, including valuation, deal structuring and negotiation support.
- Sales & trading — Executing trades for clients and making markets in stocks, bonds and derivatives — connecting buyers and sellers and providing liquidity.
- Restructuring — Renegotiating debt with lenders out of court or guiding a distressed company through insolvency. Counter-cyclical: busiest when the economy is weak and other deal flow dries up.
What We’ve Been Reading
Why a hawkish Fed won’t necessarily wake the bears
Monthly Bell — Bell Potter • Rob Crookston, Strategist

The Fed’s June meeting marked a turning point: for the first time this cycle the bond market has stopped pricing cuts and started pricing hikes. As recently as February traders saw about 35bps of cuts over the coming year; that has flipped to roughly 40bps of hikes by year-end, driven by an energy shock from the Iran conflict and a stabilising US labour market. Nine of eighteen FOMC members now see the funds rate ending 2026 higher.
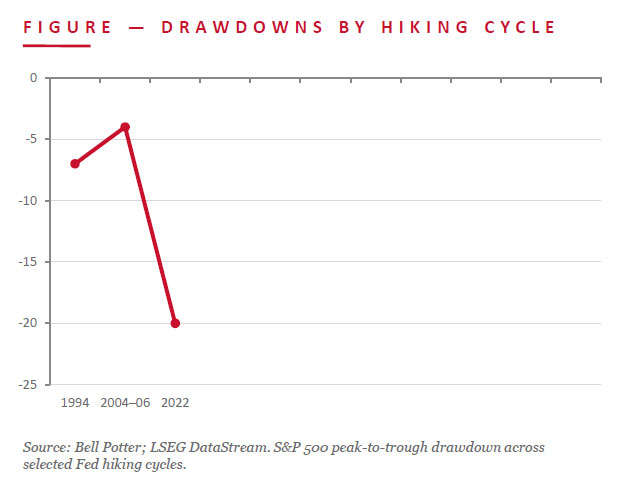
The instinct to sell into a hiking Fed misreads history. Since 1971 the S&P 500 has averaged a 9% gain in the twelve months after a Fed hike — higher than the 7.7% after a cut. The Fed hikes when the economy runs hot, so strong earnings offset higher rates; it cuts when it fears recession. Drawdown depth tracks how much control the Fed lost over inflation — shallow in the pre-emptive 1994 and 2004–06 cycles, near 20% in 2022.
JMP read: For PNG-facing portfolios the more direct channel is the currency. Bell Potter flags the Australian dollar as the clearest near-term casualty of a hawkish Fed as the AUD–US rate gap narrows — relevant for kina cross-rates and import costs. The equity message is calmer: a hiking Fed, starting from a higher base with anchored inflation expectations, has historically been survivable for stocks, with the AI-capex cost of capital the main risk to watch.
- Since 1971 the S&P 500 has averaged +9% in the 12 months after a Fed hike — Bell Potter.
- Drawdown depth tracks lost inflation control: shallow in 1994/2004, ~20% in 2022 — Bell Potter.
- The Australian dollar looks the clearest near-term casualty of a hawkish Fed — Bell Potter.
Regards,
Benny Takin
Equities Trader — Primary contact, JMP Weekly Report
benny.takin@jmpmarkets.com
+675 7001 9121 / 320 0240
JMP Securities Limited
Level 3, ADF Haus, Musgrave Street
PO Box 2064, Port Moresby NCD, Papua New Guinea