22 – 26 June 2026
Weekly Trade Commentary
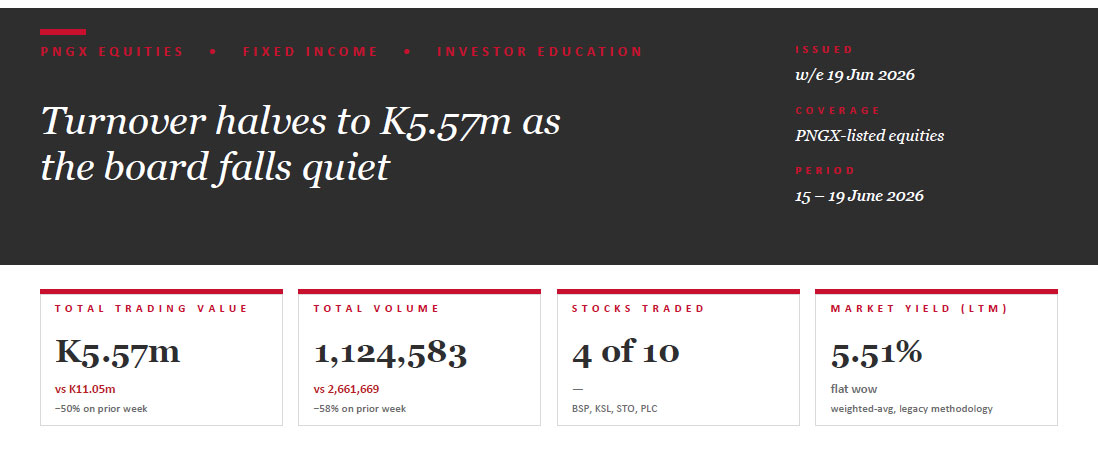
- Activity bounced back — 6 stocks traded for K10.92m, nearly double last week’s K5.57m.
- Total volume rose 80% to 2,022,799 shares.
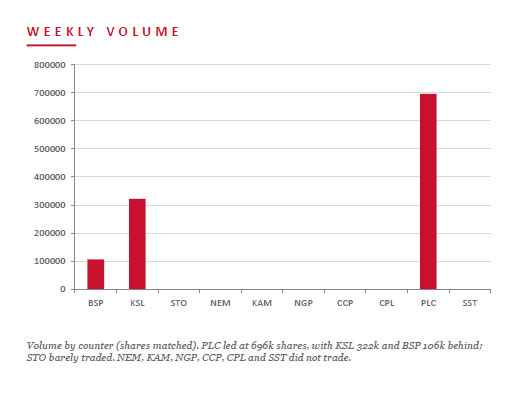
- BSP led on value at K7.58m, steady at K27.95 on 270,954 shares.
- PLC again dominated volume with 1,522,188 shares, steady at K1.45 for K2.21m.
- KSL traded 223,930 shares, steady at K4.85.
- CPL was the mover, up 6t (+7.59%) to K0.85 on 2,410 shares.
- CCP traded 1,935 shares, steady at K4.66, and STO traded 1,382 shares at K22.36.
WEEKLY MARKET REPORT | 22 June, 2026 – 26 June, 2026
| STOCK | WEEKLY VOLUME | CLOSING PRICE | VALUE | CHANGE | % CHANGE |
|---|---|---|---|---|---|
| BSP | 270,954 | 27.95 | 7,578,425.81 | — | — |
| KSL | 223,930 | 4.85 | 1,093,150.24 | — | — |
| STO | 1,382 | 22.36 | 30,901.52 | — | — |
| NEM | — | 490.00 | — | — | — |
| KAM | — | 2.12 | — | — | — |
| NGP | — | 1.36 | — | — | — |
| CCP | 1,935 | 4.66 | 9,017.10 | — | — |
| CPL | 2,410 | 0.85 | 2,048.50 | +0.06 | +7.59% |
| PLC | 1,522,188 | 1.45 | 2,207,172.60 | — | — |
| SST | — | 50.00 | — | — | — |
| 2,022,799 | TOTAL | 10,920,715.77 | +0.01% |
WEEKLY YIELD CHART | 22 June, 2026 – 26 June, 2026
| STOCK | ISSUED SHARES | MKT CAP (K) | INT 24 | FIN 24 | INT 25 | FIN 25 | YIELD % LTM |
|---|---|---|---|---|---|---|---|
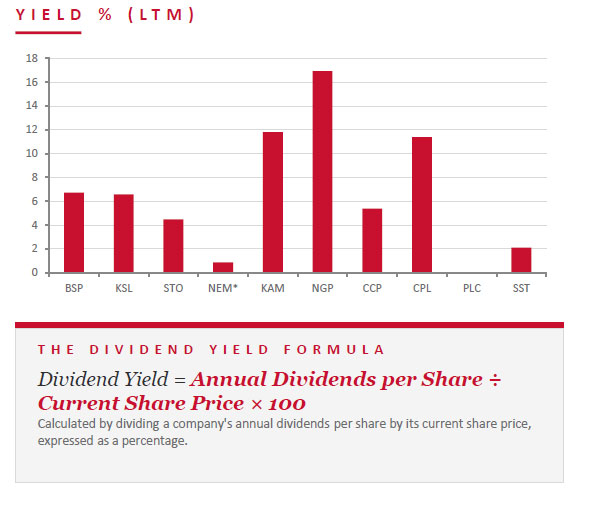
| BSP | 467,317,665 | 13,061,528,737 | 0.450 | 1.210 | 0.500 | 1.380 | 6.73% |
| KSL | 294,332,296 | 1,427,511,636 | 0.106 | 0.155 | 0.126 | 0.193 | 6.58% |
| STO | 3,261,616,703 | 72,929,749,479 | 0.506 | 0.414 | 0.559 | 0.443 | 4.48% |
| NEM* | 1,097,000,000 | 537,530,000,000 | — | 2.110 | 2.110 | USD $0.260 | 0.86% |
| KAM | 53,259,588 | 112,910,327 | 0.200 | — | 0.250 | — | 11.79% |
| NGP | 45,890,700 | 62,411,352 | 0.040 | 0.120 | 0.040 | 0.190 | 16.91% |
| CCP | 307,931,332 | 1,434,960,007 | 0.120 | 0.121 | 0.121 | 0.130 | 5.39% |
| CPL | 206,277,911 | 175,336,224 | — | — | 0.050 | 0.040 | 10.59% |
| PLC | 860,718,662 | 1,248,042,060 | — | — | — | — | — |
| SST | 31,008,237 | 1,550,411,850 | 0.400 | 0.300 | 0.400 | 0.650 | 2.10% |
| TOTAL / WEIGHTED-AVG | 5.51% |
Key Market Announcements
- CCP – 2026 AGM Presentation Download >>
- CCP – 2026 AGM — Chairman’s Speech Download >>
- CCP – 2026 AGM — CEO’s Speech Download >>
- CCP – 2026 AGM — Results of Meeting Download >>
BPNG TREASURY BILL AUCTION
Auction: 24-JUN-26 / GOI / Government Treasury Bill Settlement: 26-JUN-26 Amount on Offer: K210.0m (over-subscribed by K70.17m)
| TERMS | ISSUE / 63 | ISSUE / 91 | ISSUE / 182 | ISSUE / 273 | ISSUE / 364 | TOTAL |
|---|---|---|---|---|---|---|
| Weighted Avg Yield | — | — | 4.88% | 4.97% | 5.00% | — |
| Amount on Offer (K’m) | — | — | 10.00 | 50.00 | 150.00 | 210.00 |
| Bids Received (K’m) | — | — | 27.72 | 77.00 | 175.45 | 280.17 |
| Successful Bids (K’m) | — | — | 27.72 | 57.17 | 125.45 | 210.34 |
| Over / (Under) Subscribed (K’m) | — | — | +17.72 | +27.00 | +25.45 | +70.17 |
BPNG GOVERNMENT BOND AUCTION
NEW ISSUANCE — WEEK ENDING 26 JUNE 2026
Auction: 23-JUN-26 / GOB / Government Bond Settlement: 26-JUN-26 Amount on Offer: K200.0m
| SERIES | AMOUNT ON OFFER (K’m) | BIDS RECEIVED (K’m) | SUCCESSFUL BIDS (K’m) | SUCCESSFUL YIELD | WEIGHTED AVG RATE | COUPON RATE | NET SUBSCRIPTION (K’m) |
|---|---|---|---|---|---|---|---|
| Issue ID 2026/5057 — 3 yr | 20.00 | 49.00 | 49.00 | 6.11–6.20% | 6.16% | 6.20% | +29.00 |
| Issue ID 2026/5058 — 5 yr | 50.00 | 110.50 | 72.50 | 6.30–6.43% | 6.40% | 6.60% | +60.50 |
| Issue ID 2026/5059 — 7 yr | 40.00 | 112.50 | 62.50 | 6.48–6.59% | 6.56% | 6.70% | +72.50 |
| Issue ID 2026/5060 — 10 yr | 50.00 | 55.65 | 55.65 | 6.30–6.73% | 6.72% | 6.80% | +5.65 |
| Issue ID 2026/5061 — 15 yr | 40.00 | 41.60 | 0.00 | — | — | 7.20% | +1.60 |
| TOTAL | 200.00 | 369.25 | 239.65 | +169.25 |
INVESTOR EDUCATION – Corporate Spin-Offs
What is a Spin-Off?
A spin-off is a corporate action in which a parent company distributes shares of a subsidiary or business unit to its existing shareholders, creating a new, independent, publicly traded company.
No cash changes hands and no new shares are sold to the public — ownership of the unit simply transfers from the parent’s balance sheet to direct shareholder ownership. Shareholders end up holding stock in two separate companies instead of one.
Well-known examples include PayPal from eBay (2015), GE’s split into Aerospace, Vernova and HealthCare (2023–24), and Philip Morris International from Altria (2008). After a spin-off the parent’s share price typically drops to reflect the value that leaves with the new company — that’s expected, not a sign of trouble.
- Pro-rata distribution — Existing shareholders receive shares in the spun-off company in proportion to what they already own.
- Often tax-free — Spin-offs are frequently structured to avoid an immediate taxable event for shareholders.
- A new, independent company — SpinCo gets its own board, management and stock ticker.
- Why companies do it — To shed the “conglomerate discount” and create focused “pure-play” companies.
What we’ve been reading

Aid is falling fast — what can African countries do?
IMF Country Focus • Aoyagi, Leonardi, Laws & Mighri
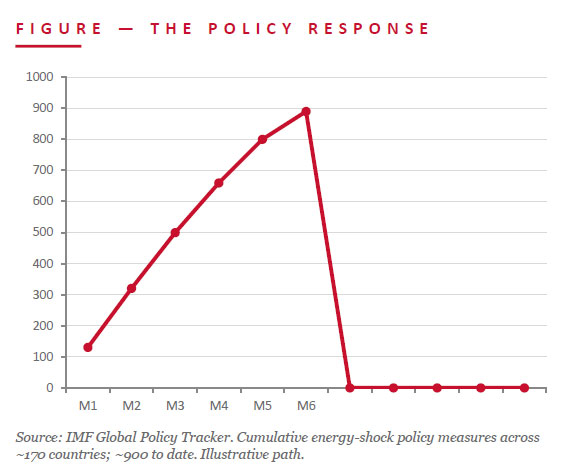
For decades, official development assistance has been a central pillar of financing in sub-Saharan Africa — and that pillar is now weakening quickly and broadly. In 2025 bilateral aid to the region fell sharply, with early estimates pointing to cuts of about 26% in a single year, while multilateral institutions project sizeable budget reductions of their own.
The stakes are high. Sub-Saharan Africa had the highest aid dependency in the world in 2024 — aid averaged about 3% of regional GDP, but 6% or more in low-income and fragile states. Around half of that aid funds essential services, so cuts of this scale threaten the very systems people rely on.
JMP read: For PNG — itself a recipient of development assistance and concessional finance — the episode is a reminder to watch donor exposure closely. The IMF’s prescription travels well beyond Africa: protect and target high-impact aid, mobilise domestic revenue, and strengthen local institutions so service delivery is less hostage to shifting donor budgets.

Regards,
Benny Takin
Equities Trader — Primary contact, JMP Weekly Report
benny.takin@jmpmarkets.com
+675 7001 9121 / 320 0240
JMP Securities Limited
Level 3, ADF Haus, Musgrave Street
PO Box 2064, Port Moresby NCD, Papua New Guinea