
PNGX Equities • Fixed Income • Investor Education
Quiet again: turnover K1.17m as PLC sits out the week
JMP Weekly Report | Week ending 21 August 2026
|
Trading Value
K1.17m
−79% on prior week
|
Total Volume
188,236
−95% on prior week
|
Stocks Traded
4 of 10
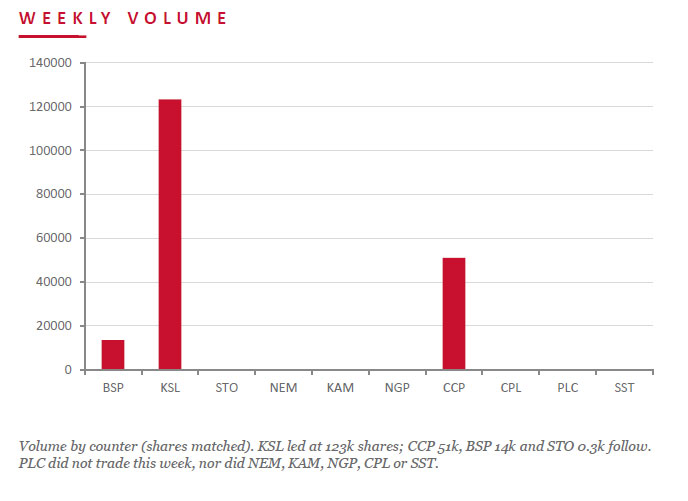
BSP, KSL, STO, CCP
|
Market Yield (LTM)
5.49%
+3 bps wow
|
Download PDF >>
Weekly Trade Commentary
A subdued week — turnover eased to K1.17m on 188,236 shares as just four counters traded and PLC sat out entirely for the first time in months. BSP led on value at K0.38m, easing 20t to K28.00 on 13,612 shares. KSL traded 123,312 shares off 1t to K4.44 for K0.55m, and CCP 51,012 shares steady at K4.66 for K0.24m. STO added 300 shares at K22.61. NEM, KAM, NGP, CPL and SST did not trade. Separately, BSP declared a 2026 interim dividend of K0.54.
| Stock | Volume | Close (K) | Value (K) | Change | Change % |
|---|---|---|---|---|---|
| BSP | 13,612 | 28.00 | 381,698.00 | −0.20 | −0.71% |
| KSL | 123,312 | 4.44 | 547,505.28 | −0.01 | −0.22% |
| STO | 300 | 22.61 | 5,498.63 | — | — |
| NEM | — | 490.00 | — | — | — |
| KAM | — | 2.25 | — | — | — |
| NGP | — | 1.36 | — | — | — |
| CCP | 51,012 | 4.66 | 237,715.92 | — | — |
| CPL | — | 1.05 | — | — | — |
| PLC | — | 1.48 | — | — | — |
| SST | — | 50.00 | — | — | — |
| TOTAL | 188,236 | 1,172,417.83 | −0.10% |
Source: PNGX matched on-market trades, week ending 21 August 2026. JMP Securities analysis.
Dividend Yield
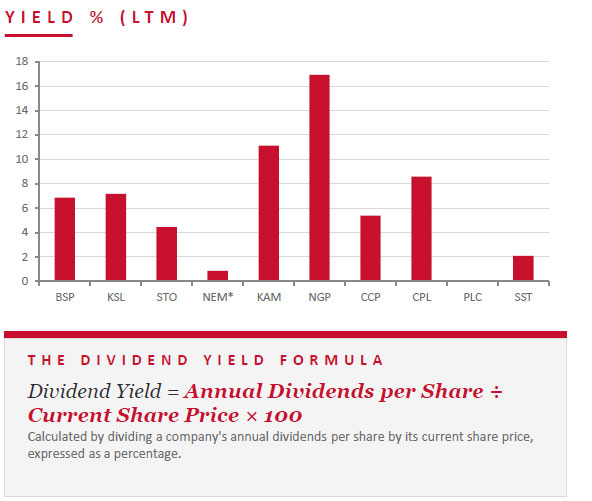
Market-wide LTM dividend yield firmed to 4.75% this week (weighted by market cap, legacy methodology), up about 2 bps after BSP declared a 2026 interim dividend of K0.54 — lifting its LTM yield to 6.86% (from 6.67%). KSL edged to 7.18% on its slip to K4.44. NGP (16.91%) still leads, with KAM (11.11%) and CPL (8.57%) next. KSL (7.18%), BSP (6.86%), CCP (5.39%) and STO (4.43%) follow, with SST at 2.10%. PLC remains pre-dividend.
| Stock | Issued Shares | Market Cap (K) | Fin 24 | Int 25 | Fin 25 | Int 26 | Yield |
|---|---|---|---|---|---|---|---|
| BSP | 467,317,665 | 13,084,894,620 | 0.450 | 1.210 | 1.38 | 0.54 | 6.86% |
| KSL | 294,332,296 | 1,306,835,394 | 0.106 | 0.155 | 0.193 | — | 7.18% |
| STO | 3,261,616,703 | 73,745,153,655 | 0.506 | 0.414 | 0.443 | USD $0.116 | 4.43% |
| NEM* | 1,097,000,000 | 537,530,000,000 | — | 2.110 | 2.110 | USD $0.520 | 0.86% |
| KAM | 53,259,588 | 119,834,073 | 0.200 | — | 0.250 | — | 11.11% |
| NGP | 45,890,700 | 62,411,352 | 0.120 | 0.040 | 0.190 | — | 16.91% |
| CCP | 307,931,332 | 1,434,960,007 | 0.121 | 0.121 | 0.130 | — | 5.39% |
| CPL | 206,277,911 | 216,591,807 | — | 0.50* | 0.040 | — | 8.57% |
| PLC | 860,718,662 | 1,273,863,620 | — | — | — | — | — |
| SST | 31,008,237 | 1,550,411,850 | 0.300 | 0.400 | 0.650 | — | 2.10% |
| TOTAL / WEIGHTED AVERAGE | 5.49% | ||||||
LTM = Last twelve months. Yields use most recently declared interim and final dividends. NEM dividends in USD until PGK rate announced; NEM excluded from market-wide yield. PLC now added.
*CPL Special Dividend
Key Market Announcements
A results-heavy week. BSP released its 2026 Half-Year Results — a market announcement, investor presentation, financial statements and Appendix 5B — and, as noted on the yield page, declared a K0.54 interim dividend. STO also reported: its 2026 Half-Year Report, a “strong base business” update, and an Appendix 3A.1 dividend-distribution notice.
| Stock | Announcement |
|---|---|
| BSP | 2026 Half-Year Results (announcement, presentation & financials) |
| STO | 2026 Half-Year Report |
| STO | Santos reports strong base business |
| STO | Appendix 3A.1 — Notification of dividend distribution |
Source: PNGX market announcements, 17–21 August 2026.
BPNG Treasury Bill Auction
Auction: 19 August 2026 | Settlement: 21 August 2026 | Amount on offer: K270.0 million
| Terms | 63 days | 91 days | 182 days | 273 days | 364 days | Total |
|---|---|---|---|---|---|---|
| Weighted Average Yield | — | — | 4.62% | 4.98% | 5.05% | — |
| Amount on Offer (K’m) | — | — | 20.00 | 50.00 | 200.00 | 270.00 |
| Bids Received (K’m) | — | — | 0.26 | 35.00 | 150.10 | 185.36 |
| Successful Bids (K’m) | — | — | 0.26 | 20.00 | 110.10 | 130.36 |
| Over / (Under) Subscribed (K’m) | — | — | −19.74 | −15.00 | −49.90 | −84.64 |
BPNG Government Bond Auction
A new Government Bond auction was held on 18 August 2026, with settlement on 21 August 2026. K480.0 million was offered, bids received totalled K563.0 million and successful bids were K480.0 million, resulting in net subscription of K83.0 million.
| Series | Offer (K’m) | Bids (K’m) | Successful (K’m) | Successful Yield | Weighted Avg | Coupon | Net Subscription (K’m) |
|---|---|---|---|---|---|---|---|
| 2026/5057 – 3 yr | 50.00 | 60.00 | 50.00 | 6.10–6.27% | 6.26% | 6.30% | +10.00 |
| 2026/5058 – 5 yr | 100.00 | 118.00 | 100.00 | 6.43–6.70% | 6.61% | 6.70% | +18.00 |
| 2026/5059 – 7 yr | 80.00 | 85.00 | 80.00 | 6.73–6.80% | 6.76% | 6.80% | +5.00 |
| 2026/5060 – 10 yr | 150.00 | 180.00 | 150.00 | 6.73–6.90% | 6.84% | 6.90% | +30.00 |
| 2026/5061 – 15 yr | 100.00 | 120.00 | 50.00 | 7.13–7.30% | 7.26% | 7.30% | +20.00 |
| TOTAL | 480.00 | 563.00 | 480.00 | +83.00 | |||
Investor Education: Hedge Funds
A hedge fund is a pooled, actively managed investment vehicle for sophisticated investors. It gathers capital from accredited or institutional investors and deploys it across a wide range of strategies and asset classes, aiming to generate returns largely independent of broad market direction. It can go long or short, use leverage and trade derivatives — a far broader mandate than a mutual fund.
Hedge funds are lightly regulated relative to retail funds, cap their investor count with high minimums, and charge performance fees tied to returns. The classic “2 and 20” model — a ~2% management fee plus ~20% of profits above a hurdle and subject to a high-water mark — has compressed industry-wide, with many funds now closer to “1.5 and 15” or below.
Four strategy families cover most industry assets: long/short equity, global macro, event-driven and relative-value/quant. Many funds blend these as “multi-strategy”. Access is restricted to accredited or institutional investors precisely because of the leverage, liquidity and concentration risks involved.
| 01 | Long / short equity Buy undervalued stocks and short overvalued ones to isolate stock-picking skill from overall market direction. |
| 02 | Global macro Trade currencies, rates and indices on top-down macroeconomic and geopolitical views — the most directional of the families. |
| 03 | Event-driven Position around corporate catalysts — mergers, restructurings, spin-offs — where a specific event, not the market, drives the return. |
| 04 | Relative value / quant Exploit pricing gaps between related instruments using statistical and quantitative models, often market-neutral. |
What We’ve Been Reading
Featured Read
Economic update: a region-by-region view
Monthly Bell — Bell Potter • Rob Crookston, Strategist
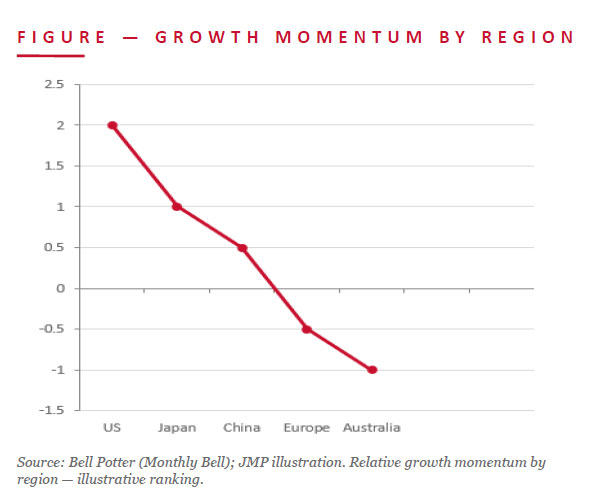
Global growth is holding up better than feared, but it is a story of two forces: a positive technology shock from AI investment now driving demand, and a fading energy shock as oil prices ease. Economies with less energy exposure and more AI exposure look best placed. The US leads the G7 on steady above-trend growth — AI capex alone is adding roughly 1% to GDP — supported by tax cuts, bank deregulation and energy independence, though disinflation has stalled with core inflation sticky near 3.4%.
Elsewhere the picture is mixed. Australia is the one major economy still absorbing simultaneous monetary and fiscal tightening — Bell Potter sits more hawkish than the market and sees one to two more RBA hikes, with housing inflation the sticky point. Japan is finally normalising, helped by AI-geared semiconductor exporters; Europe’s energy-sensitive industrials bear the drag; and China grows only moderately, with front-loaded policy support putting a floor under real-estate and consumption headwinds.
JMP read: The through-line for PNG is the commodity and rate backdrop. A firmer US and the AI-capex cycle support demand for the metals and energy PNG exports, while easing oil is a mixed blessing — good for import costs, softer for LNG-linked revenue. The Australian angle matters too: further RBA hikes and a firmer AUD feed directly into kina cross-rates and imported inflation. The key risk is a Middle East re-escalation that pushes oil back up.
For Further Enquiries
Speak to your equities trader for any orders, research questions or market colour.
Benny Takin
Equities Trader – Primary contact, JMP Weekly Report
benny.takin@jmpmarkets.com
+675 7001 9121 / 320 0240
JMP Securities Limited
Level 3, ADF Haus, Musgrave Street
PO Box 2064, Port Moresby NCD, Papua New Guinea
Disclaimer
This report has been prepared by JMP Securities Limited (Capital Market Licence holder, Securities Commission of PNG). It is general information only and does not take into account the objectives, financial situation or needs of any particular person. It is not an offer or solicitation to buy or sell any security. Information is sourced from PNGX, Bank of Papua New Guinea and external publications cited herein, with JMP analysis. While reasonable care has been taken, no warranty is given as to accuracy or completeness; to the maximum extent permitted by law JMP accepts no liability for loss arising from reliance on this material. Investors should obtain independent professional advice before making any investment decision.