4 December, 2023
Hello and welcome to this week’s JMP Report
On the equity front last week, we saw BSP trade 3,182 shares, closing 2t higher at K13.68, KSL traded 550,963 shares, closing 5t higher to close at K2.50, STO traded 440 shares, closing 1t higher at K19.24, CCP traded 44,082 shares, closing 1t higher at K2.01 and CPL traded 5,000 shares, closing steady at K0.79.
WEEKLY MARKET REPORT | 27 November, 2023 – 1 December, 2023
| STOCK | QUANTITY | CLOSING PRICE | BID | OFFER | CHANGE | % CHANGE | 2022 FINAL DIV | 2023 INTERIM | YIELD % | EX-DATE | RECORD DATE | PAYMENT DATE | DRP |
| BSP | 3,172 | 13.68 | 13.66 | 15.00 | 0.02 | 0.15 | K1.4000 | K0.370 | 13.33 | FRI 22 SEPT 2023 | MON 25 SEPT 2023 | FRI 13 OCT 2023 | NO |
| KSL | 550,963 | 2.50 | 2.46 | 2.50 | 0.04 | 1.60 | K0.1610 | K0.097 | 10.75 | WED 6 SEPT 2023 | THU 7 SEPT 2023 | THU 5 OCT 2023 | NO |
| STO | 430 | 19.24 | 19.24 | – | 0.01 | 0.05 | K0.5310 | K0.314 | 4.42 | MON 28 AUG 2023 | TUE 29 AUG 2023 | THU 28 SEPT 2023 | – |
| NEM | – | – | 145.00 | – | – | – | – | K0.12 | 13.33 | TUE 19 SEP 2023 | WED 20 SEP 2023 | THU 19 SEP 2023 | YES |
| KAM | – | 0.90 | 0.90 | 1.00 | – | 0.00 | K0.5310 | K0.314 | 4.42 | MON 28 AUG 2023 | TUE 29 AUG 2023 | THU 28 SEPT 2023 | – |
| NGP | – | 0.69 | 0.69 | – | – | 0.00 | – | K0.0.3 | 5.80 | FRI 6 OCT 2023 | WED 11 OCT 2023 | WED 1 NOV 2023 | – |
| CCP | 44,082 | 2.01 | 2.01 | – | 0.01 | 0.50 | K0.123 | K0.110 | 11.51 | FRI 24 MAR 2023 | WED 29 MAR 2023 | FRI 5 MAY 2023 | YES |
| CPL | 5,000 | 0.79 | – | 0.79 | – | 0.00 | – | – |
– |
WED 22 MAR 2023 | THU 30 MAR 2023 | THU 30 JUL 2023 | – |
| SST | – | 35.46 | 36.46 | 50.00 | – | – | K0.70 | K0.35 | 2.96 | FRI 29 SEP 2023 | MON 2 OCT 2023 | TUE 31 OCT 2023 | NO |
Dual Listed PNGX/ASX Stocks
BFL – 5.30 flat
KSL – 76 -.05
NEM – 60.78 + 3.68
STO – 6.90 -17c
The JMP Order Book
The JMP Order Book starts the week as nett buyers of BSP KSL and STO
Interest Rates
It appears the Bank did not come into the Central Bank Bill Market again last week. In the TBills, we saw the Bank accept 284 mill in bids at 3.56% after receiving 620 mill in bids. The Bank issued 284 mill only and left the Market oversubscribed by 336 mill.
The Depo Market remains flat with the best 12mth rates at 2.75%
Other Assets we monitor
Natural Gas -2.72 -28c
Silver – 25.90 -1.56
Platinum – 941 +2
Bitcoin – 38,786 +3.7%
Ethereum – 2190 +5.98%
PAX Gold – 2068 +2.33%
What we’ve been reading this week
Has the Energy Transition Failed and is it Over?
Many fail to realize this is not the first energy transition.
Although the media have made it appear as if it’s the first energy transition, it’s not.
For example, the nuclear energy industry development which started in WW2 was a major energy transition. In today’s dollars, half a trillion dollars went into the research and development of nuclear reactors along with uranium mines and fabrication plants that would feed the operating nuclear reactors.
In fact, one of the most fascinating stories of collusion, corruption and cartels happened as America was developing its first energy transition. Amazingly, it almost “destroyed” the nuclear industry.
So, before you think the current Energy Transition has failed (which it is not over and will happen) let’s explain the drama that almost took down the first major Energy Transition in America.
Have you ever heard of the Yellow Cartel?
The Yellow Cartel
Everyone knows about the oil cartel called OPEC. But did you know that in the 1970s, a uranium cartel was conspired by one of the largest mining companies in the world and the Canadian government?
From 1955 through 1970 hundreds of billions of dollars were being committed by the US, France, Sweden, Japan and West Germany to build nuclear power plants. The Yellow Cartel started in 1971 with the London based mining giant, Rio Tinto approaching the Canadian government concerning the formation of a cartel for controlling uranium market pricing. The first official meeting occurred in February 1972, in Paris, and the International Uranium Cartel was created.
Eventually, 29 producing companies would become members of the International Uranium Cartel, which was nicknamed the ‘Yellow Cartel” for the color of yellowcake that the cartel was colluding to price fix.
Rio Tinto, Uranerz (the large German uranium producer in the 70s), the Canadian Government and ultimately a total 29 uranium producers made up the Uranium Cartel. The Uranium Cartel was successful in increasing the price of uranium almost 10-fold in a few short years by deploying illegal tactics such as price fixing schemes. Later, the Canadian government would form two uranium entities which would lead to the creation of Cameco, a top 5 uranium producer worldwide.
There were two real catalysts that caused the formation of the International Uranium Cartel. But why did Rio Tinto pitch this plan that almost would turn the energy world upside down and risk America’s energy security and the first major energy transition?
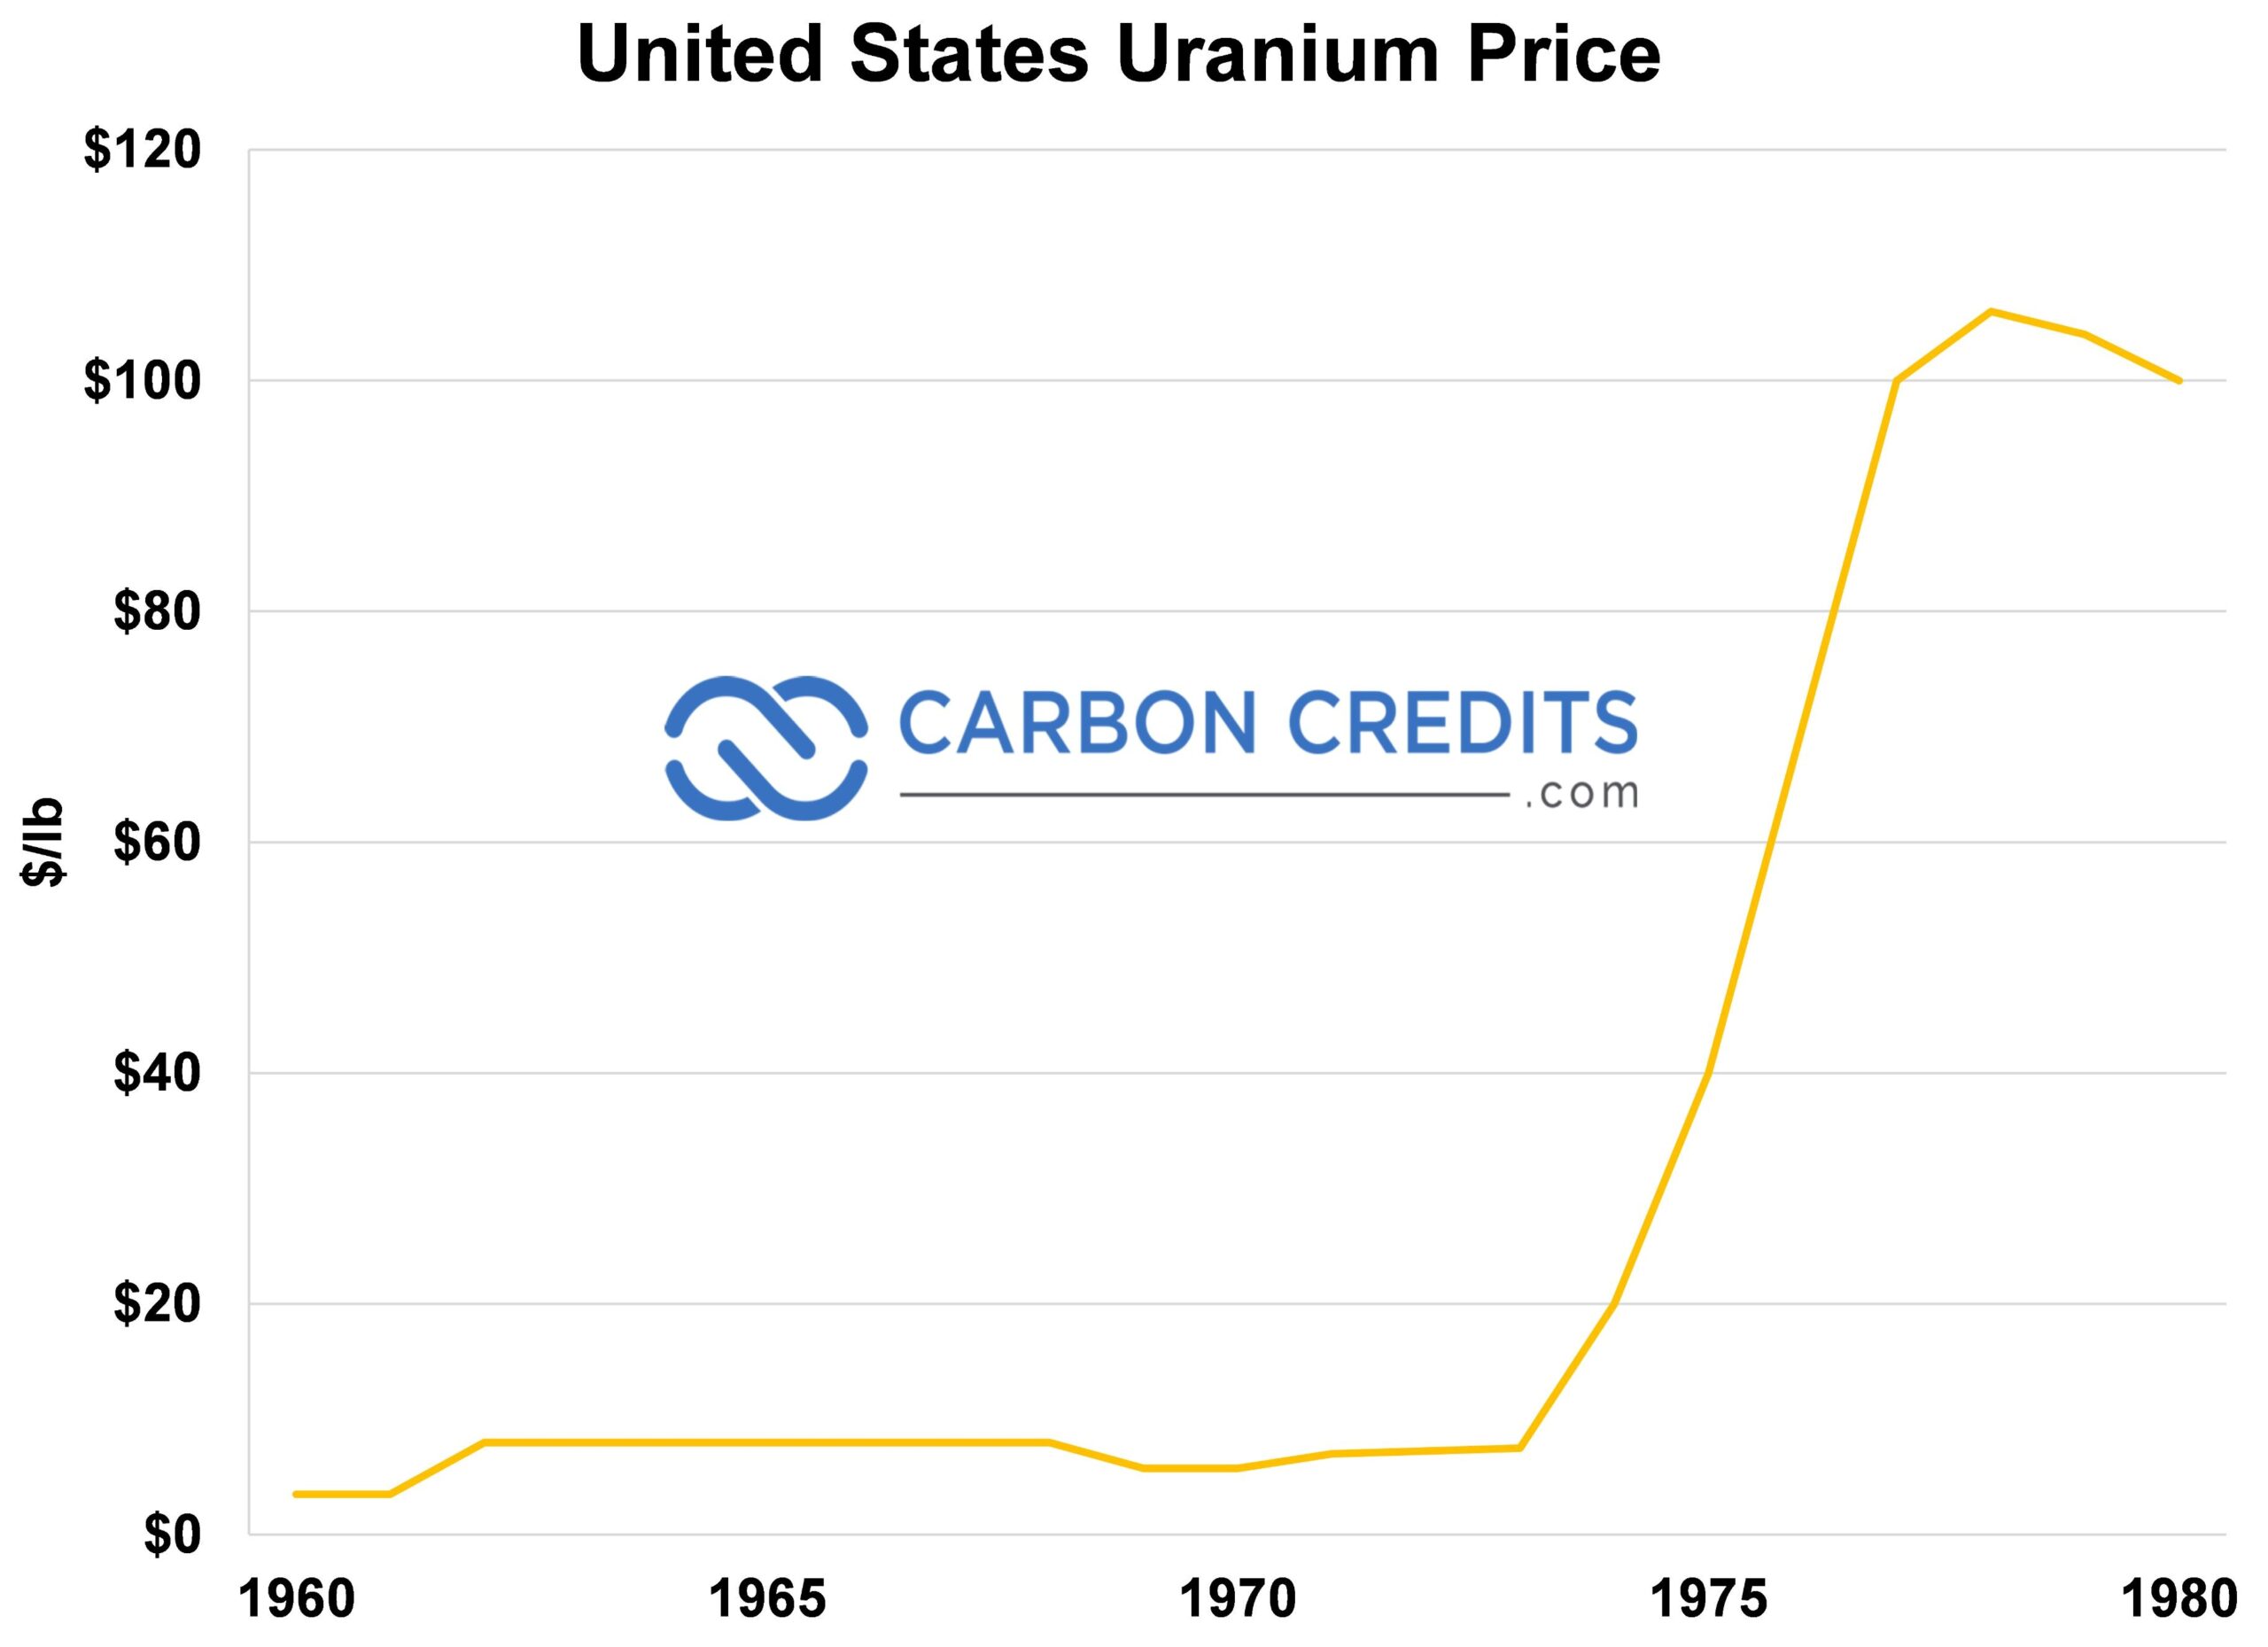
The first catalyst was the move by the US government to place an embargo on all foreign uranium in 1964 to protect its own uranium mines. At that time, the United States consumed about 70% of the global uranium production (for both its military and energy needs) and with that demand for uranium now gone outside the USA, the price of uranium crashed to $5 per pound in 1970.
But because the price of uranium was so high during the 1950s and first half of the 1960s, significant amounts of risk capital was spent on exploration for new uranium deposits globally. As a result of all this new uranium exploration was major uranium discoveries were made in places like Niger and Australia.
By the late 1960s significant uranium deposits would be discovered in Australia such as Jabiluka 1 & 2. Eventually the massive discovery of Olympic Dam which would become one of the largest polymetallic mines (including uranium) in the world. Olympic Dam would soon replace the depleting uranium from the Rum Jungle Mine in Australia which was producing uranium since 1954 and was shut down for good in 1971.
Because of and other events such as those mentioned above, by 1971, there was over 220 Million pounds of global uranium production and only 55 Million pounds of uranium global demand. The uranium market was oversupplied by 400%.
Because of both the US embargo on foreign supplies of uranium and an oversupply of uranium production to demand by 400%, the price of uranium was hovering around $5/pound in 1971.
But because of the price fixing tactics of the Uranium Cartel, the price of uranium surged to $40/pound.
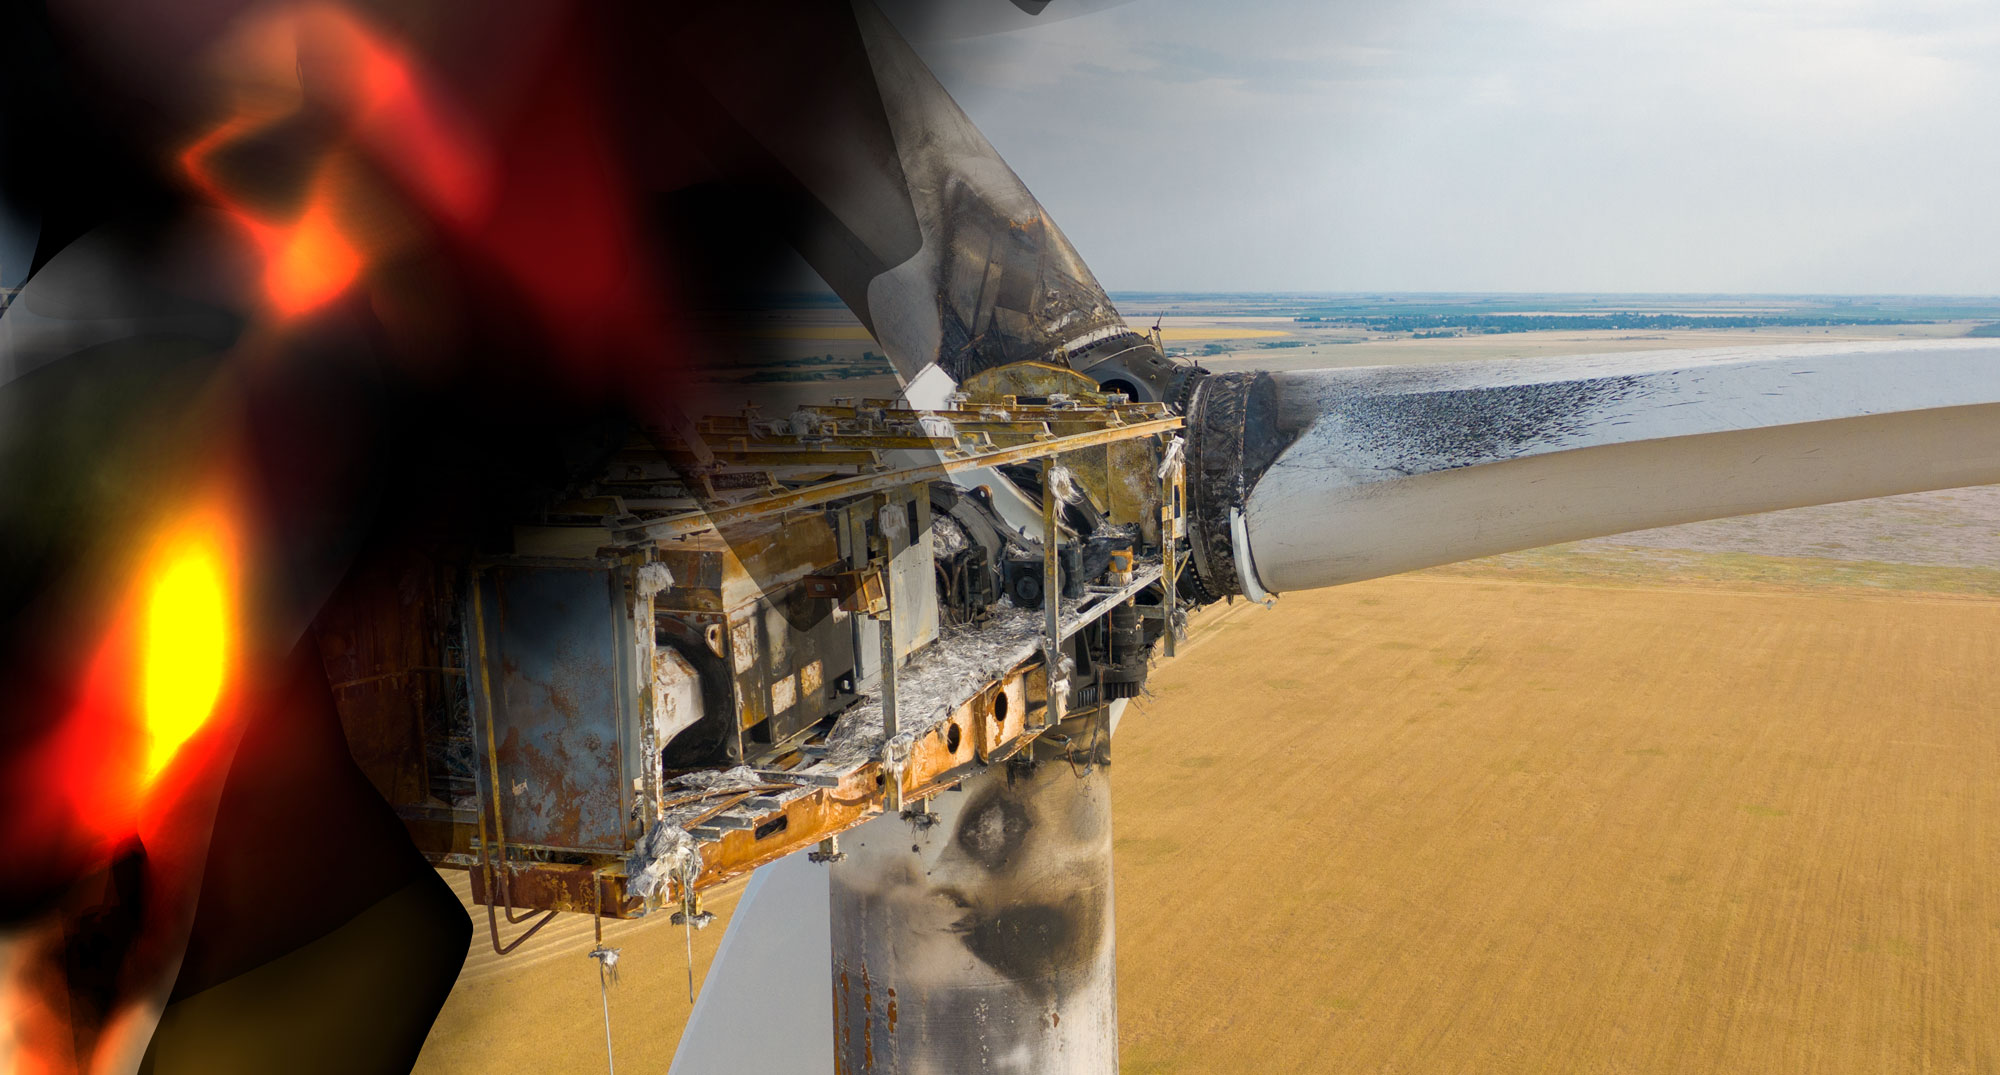
The move in uranium prices brought down the world’s largest nuclear reactor builder in the world, Westinghouse Electric Corp. on September 8, 1975.
Westinghouse was able to become the world’s largest developer and installer of nuclear reactors because it had the best track record, nuclear technology and most importantly it promised a long-term supply of uranium feed to power the Westinghouse PWR reactors. A dream trifecta for large utilities and government entities alike.
To put things in perspective, half of the world’s current operating nuclear power plants are using the basis of Westinghouse’s PWR reactor technology. Between 1960 and 1970, Westinghouse was able to secure US government backed utility contracts (and same in Sweeden) worth tens of billions of dollars because Westinghouse committed to supply 65 million pounds to the American and Swedish nuclear reactors with a fixed price contract.
But things quickly turned very bad for Westinghouse. The utilities, citizens and the American Government. Because the price of uranium increased 10X (1000%) from when Westinghouse signed those fixed price utility contracts, on September 8th, 1975 Westinghouse announced that it would not honour the 65 million pounds of uranium it committed to the American and Swedish utilities.
It was revealed in legal documents that the American consumer ended up paying billions of dollars in additional electricity costs due to the Uranium Cartels actions. In fact, New York state alone paid over $1Billion in electricity prices shortly after the Yellow Cartel activities.
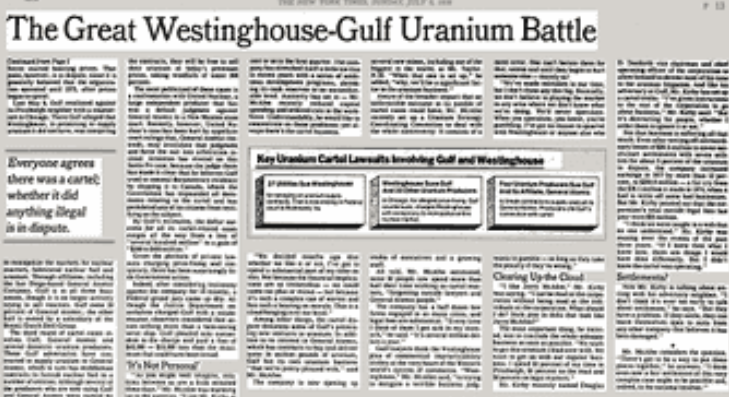
On October 15, 1976, Westinghouse took matters into its own hands. It filed for conspiracy, in violation of United States anti-trust laws against the 29 producing uranium companies that made up the International Uranium Cartel estimating damages between $4-6 Billion.
Uranium continued to soar after 1976, surpassing $100 per pound throughout the late seventies.
Around that time, people called for the end of the energy transition citing the negative impact caused by the Uranium Cartel. This was just one of many attacks survived by the uranium industry. In fact, the nuclear sector not only survived the Uranium Cartel fiasco, but Chernobyl, Fukushima and countless other project and sector setbacks over the years.
Right now, we are current in the greatest energy transition in human history. Tens of trillions of dollars will be spent worldwide on energy transition and decarbonization. Nuclear is a big part of the solution. In fact, without uranium, there is no clean, long term base load nuclear power. Which is why we are currently in one of the greatest uranium bull markets of all time.
There are three uranium giants in global uranium production. The largest global producer came out of the fall of the Soviet Union, Kazatomprom. The third largest global uranium producer, as described above, was the result of the Canadian Government merging two state owned enterprises and created Cameco.
Impact Investor responsAbility Launches $500 Million Asia-Focused Climatetech Investment Strategy

Susan Lahey November 29, 2023
M&G’s impact investing unit responsAbility Investments, together with Germany’s development bank KfW and the Dutch development bank FMO, announced the launch of new climate investment strategy, aimed at actively contributing to CO2 reduction in Asia through targeted investments in low-emission technologies, and seeking to mobilize $500 million in capital.
According to responsAbility, the new strategy is being launched amidst an urgent need for investment in climate-friendly technologies and infrastructure in Asia, which is the largest emitter of greenhouse gases, but also has a projected strong increase in energy demand over the next several years.
The new climate investment strategy focuses on sectors with high CO2 savings potential in Asia, including renewable energy, battery energy storage, electric mobility, energy efficiency and circular economy. A key element of the strategy is the “Climate Impact Assessment and Monitoring Framework,” which ensures high transparency and targets direct CO2 savings of an estimated 10 million tons over the entire lifetime of the investments.
Ewout van der Molen, Head of Climate Finance at responsAbility, said:
“Our investment strategy appeals to institutional investors who are looking for both environmental impact and financial value from their investment. As a key step towards a low-carbon economy in Asia, responsAbility provides a significant opportunity for investors to make a tangible and measurable difference in the fight against climate change. The successful launch will enhance access to capital for Asian businesses that are keen to reduce their carbon footprint.”
According to responsibility, the climate investment strategy will use a blended finance structure that combines public funding with private capital. Blended finance brings together public capital and private funding through a common investment structure, enabling investors to invest in certain types of investments that have high perceived risk profiles, such as new climate mitigation-related technologies. The instruments are designed to attract large-scale institutional capital, allowing public financiers to use a small amount of their own resources as a first loss to mobilize large amount of private capital to reach large number of underlying climate projects needed.
Stephanie Lindemann-Kohrs, Director of Global Equity and Funds at KfW, said:
“KfW Development Bank, on behalf of the German Federal Ministry for Economic Cooperation and Development, strives to increasingly channel private sector capital into the SDGs. Through its blended finance structure and KfW’s investment into the first loss tranche, the climate investment strategy is ideally positioned to mobilize private funding at scale for investments that foster the energy transition and contribute to greenhouse gas abatement.”
Quantifying the financial costs of climate change physical risks for companies
S&P Published November 20,2023
HIGHLIGHTS
Companies already exposed to extreme weather events and the physical impacts of climate change will likely see increasingly significant financial costs over the coming decades.
Without adaptation measures, by the 2050s these costs will equal an average of 3.3% — and up to 28% — per annum of the value of real assets held by companies in the S&P Global 1200, according to the S&P Global Sustainable1 Physical Risk Exposure Scores and Financial Impact dataset.
These costs are annual and cumulative over time, representing a material financial risk for many companies, absent adaptation and resilience measures.
Different physical hazards are poised to create substantial financial costs in some sectors but not others. In the communications sector of the S&P Global 1200, most of the assets facing high financial impact are datacenters due to their sensitivity to extreme heat.
Author
Jennifer Laidlaw | S&P Global Sustainable1, Thought Leadership Senior Writer
Rick Lord | S&P Global Sustainable1, Head of Innovation Methodology
Matthew MacFarland | S&P Global Sustainable1, Thought Leadership Editor
Kuntal Singh | S&P Global Sustainable1, ESG Innovation and Analytics Manager
Extreme weather events have defined 2023, from Cyclone Freddy sweeping across several African countries, to wildfires in Canada that blanketed eastern North America in smoke, to extreme heat around the world that made July the hottest month on record by a wide margin.
Scientists are increasingly making the connection between extreme weather events and climate change. As the damage from extreme weather events becomes more apparent, we seek in this research to measure the financial costs of climate hazards on corporate assets in different sectors and geographies.
Applying the S&P Global Sustainable1 Physical Risk Exposure Scores and Financial Impact dataset to companies in the S&P Global 1200, we find that by the 2050s the costs of the physical hazards of climate change will equal an average of 3.3% per annum — and up to 28% per annum — of the value of real assets held by companies in the index, absent adaptation. That average per-annum figure rises to 6.0% by the 2090s. These costs are annual and cumulative over time, representing a material financial risk for many companies.
The relative size of the financial impact in the 2050s and 2090s under this scenario is similar for the S&P 500.
The S&P Global Sustainable1 Physical Risk Exposure Scores and Financial Impact dataset defines for each company the financial impact due to changing hazard exposure, absent any adaptation and resilience measures. Financial impact at the company level reflects the weighted average financial impact for all assets linked to the company, weighted by the estimated value of the assets.
To assess the financial impact at the asset level, we use S&P Global Sustainable1 climate physical risk data, which assigns an exposure score for physical climate hazards to each of the more than 2 million corporate assets in the dataset. We assess seven physical climate hazards: extreme heat, water stress, coastal flood, fluvial flood, tropical cyclone, drought and wildfire. The hazard exposure score for an asset is combined with the asset type-specific sensitivity profile to quantify the future financial costs associated with each hazard. These costs can include a range of costs stemming from increased operational expenses to lost revenues due to business interruption through to physical damage and costs to repair assets. These costs are expressed as a percentage of the value of each asset type as an indicator of the financial impact at the asset level.
The assets considered are real assets or physical assets. The asset values are constant and indicate the relative value of different asset types, such as an office compared with an electric power plant. The costs associated with the hazards can, but do not always, reduce the value of a real asset.
These projections are based on the climate scenario known as SSP3-7.0, which is characterized by limited mitigation where total greenhouse gas emissions double by 2100 and global average temperatures rise by 2.8 degrees C to 4.6 degrees C by 2100. The S&P Global 1200 is an index that covers the largest companies across North America, Europe, Asia, Australia and Latin America, capturing approximately 70% of global market capitalization.
S&P Global Sustainable1 does not currently have complete data on all asset holdings of all companies in the S&P Global 1200, and these results could change as asset data coverage expands over time.
Some climate hazards will generate more significant financial costs for S&P Global 1200 assets than others, according to our data. Extreme heat is projected to generate the highest cost for companies in the 2050s, in part because nearly all assets will face at least some exposure to extreme heat, whereas exposure to other hazards is more variable. Water stress and fluvial flooding are the second- and third-most significant sources of financial impact for the S&P Global 1200. Water stress refers to the combination of reduced freshwater availability from sources such as rainfall and increased water demand from the general population, industrial use and agriculture.
For example, extreme heat could affect businesses across sectors through lower labor productivity: If it is too hot, employee health and safety and company operations can suffer. Energy grids can come under pressure as the general population cranks up air conditioning use. Transportation links can be damaged, leading to delays in supply chains.
If we look further ahead to the 2090s, the financial impact of extreme heat intensifies, and hazards that are less severe in the 2050s become more significant without efforts to adapt.
How climate affects sectors differently
The potential financial impact of climate hazards could influence where a company decides to develop its operations or where investors put their money. A severe drought may decimate a vineyard while the productivity of a nearby office building might not be affected much at all. Such shifts, in turn, would change the risk profile of businesses and have a knock-on effect on banks, insurers and investors.
Our analysis shows that some sectors are more sensitive than others in terms of the potential financial impact of climate hazards. The location of an asset also influences how high the financial impact could be.
For example, the communication services sector in the S&P Global 1200 would face significant financial impact: 5.4% per annum of real asset values by the 2050s. This sector includes telecommunications firms, data providers and media companies. Extreme heat would generate the largest impact absent adaptation, followed by water stress, drought and fluvial flooding. In communication services, 97% of real assets with financial impact of 10% or more by the 2050s are datacenters, and datacenter assets have the highest average financial impact for this sector at 8.3%. Datacenters are sensitive to extreme temperatures and restricted access to water due to their dependency on heating, ventilating and air conditioning (HVAC) and cooling.
Extreme heat represents the largest share of financial impact for most sectors in the 2050s. While that holds true further out toward the 2090s, other hazards become much more significant. The financial impacts from coastal flooding and drought become more severe across many sectors.
Datacenters
Zooming in on one type of corporate asset — datacenters — provides insight into how different climate hazards contribute to financial impact absent adaptation and resilience measures. Datacenters are also worth examining because they are fundamental infrastructure to the digital economy, and they are likely to become more important as technology evolves throughout the rest of the century.
The Physical Risk Exposure Scores and Financial Impact dataset covers more than 2,000 datacenters owned by S&P Global 1200 companies. These assets are particularly sensitive to extreme heat, which will have the highest financial impact by the 2050s, followed by drought and water stress.
Extreme heat can lead to accelerated degradation of HVAC systems and thus increase capital expenditure. For example, take two hypothetical datacenters located on the same block in a city that is exposed to extreme heat. One of them is a small site operated by a local internet service provider while the other is a state-of-the-art facility operated by a multinational social network company. Periods of extreme heat would increase cooling costs and speed up the deterioration of HVAC systems for both datacenters. These costs can be expressed in relative terms for both assets (i.e., the percentage of typical asset value), but the absolute cost would be much higher for a state-of-the-art facility. The value of each facility is not known, which is why this analysis focuses on the relative impact.
While the absolute costs are likely to vary by location or the size of the asset, the vast majority of datacenters owned by S&P Global 1200 companies will face at least some financial impact by the 2050s. In that decade, about one-quarter of these datacenters could face financial impact equal to 10% or more of the asset’s value. That share skyrockets to nearly 89% of datacenters by the 2090s.
The regional differences of climate hazards
Location will also drive companies’ exposure to physical risk hazards and what financial impact their assets may face. Extreme heat is the greatest source of financial impact for datacenters owned by S&P Global 1200 companies in Europe and Central Asia, North America, and Latin America and the Caribbean by the 2050s. However, in sub-Saharan Africa, South Asia, and the Middle East and North Africa, water stress will have the greatest financial impact.
These two hazards can also reinforce one another, worsening the outcome in areas dealing with both. In sub-Saharan Africa, 80% of countries are likely to have more than 45 days of heat waves per year by 2050, compared with less than 15% currently, according to a report on potential economic losses from physical climate risks by S&P Global Ratings.
The slow pace of adaptation
A growing number of large corporates around the world have pledged to cut their greenhouse gas emissions as close to zero as possible and offset the remainder, usually by the distant deadline of 2050. But they remain the exception rather than the rule. Meanwhile, corporate action to adapt to the physical risks of climate change has been slow. An analysis of S&P Global ESG Raw Data, which is built on the S&P Global Corporate Sustainability Assessment, shows that just one in five companies across sectors has a plan to adapt to the physical impacts of climate change. Just over 46% of assessed companies globally conduct physical risk assessments, which could indicate how climate-related risks are embedded throughout a company. A certain amount of change is locked in due to the lag in the climate system owing to historic GHG emissions — many of the impacts of climate change will therefore materialize irrespective of the policy choices made today and absent adaptation.
In the run-up to COP28, there is urgent need for action on climate and the creation of solutions to address worsening physical risks. Adaptation and resilience will be key to preventing the worst damage from physical climate risks over the coming years. Understanding these hazards, weighing the severity of climate events in a geographical area, and then assessing the potential financial impact on assets could help companies make more effective decisions on adapting their operations to climate change.
Methodology of the Physical Risk Exposure Scores and Financial Impact dataset
Our data projects future financial costs of climate change on more than 20,000 companies and more than 2 million individual assets. The data includes the projected impacts of extreme heat, wildfire, water stress, drought, coastal flood, fluvial flood and tropical cyclone. The data is based on four climate scenarios, which consider future GHG emissions and to what extent governments have enacted policies to curb the effects of climate change. The dataset measures a physical asset’s exposure to climate hazards through exposure scores. It also projects the future financial costs of evolving climate hazards and expresses these costs as a percentage of typical asset value to reflect the potential financial impact of those hazards absent adaptation and resilience measures. These costs can include a range of costs stemming from increased operational expenses, to lost revenues due to business interruption, through to physical damage and costs to repair assets.
Shared Socioeconomic Pathways Defined
The IPCC established the Shared Socioeconomic Pathways (SSPs) as a set of scenarios for projected greenhouse gas emissions and temperature changes. The SSPs incorporate broad changes in socioeconomic systems, including global population growth, economic growth, resource availability and technological developments:
- SSP1-2.6 is a low-emissions scenario in which the world shifts gradually, but consistently, toward a more sustainable path. This SSP aligns with the Paris Agreement on climate change’s target to limit the average increase in global temperature to well below 2 degrees Celsius by the end of the century. The global temperature is projected to increase by 1.7 degrees (a likely range of 1.3-2.2 degrees) by 2050 or by 1.8 degrees (1.3-2.4 degrees) by the end of the century.
- SSP2-4.5 is a moderate-emissions scenario, consistent with a future with relatively ambitious emissions reductions but where social, economic and technological trends do not deviate significantly from historical patterns. This scenario falls short of the Paris Agreement on climate change’s aim of limiting the global temperature rise to well below 2 degrees, with a projected increase of 2.0 degrees (1.6-2.5 degrees) by 2050 or 2.7 degrees (2.1-3.5 degrees) by the end of the century.
- SSP3-7.0 is a moderate- to high-emissions scenario, in which countries increasingly focus on domestic or regional issues, with slower economic development and lower population growth. A low international priority for addressing environmental concerns leads to rapid environmental degradation in some regions. This SSP projects a global temperature increase of 2.1 degrees (1.7-2.6 degrees) by 2050 or 3.6 degrees (2.8-4.6 degrees) by the end of the century.
- SSP5-8.5 is a high-emissions scenario, in which the world places increasing faith in competitive markets, innovation and participatory societies to produce rapid technological progress and development of human capital as a path to sustainable development. This SSP projects the global temperature increase at 2.4 degrees (1.9-3.0 degrees) by 2050 or 4.4 degrees (3.3-5.7 degrees) by the end of the century.
Many companies do not disclose the value of their corporate assets. To help address such data gaps, S&P Global Sustainable1 has calculated typical asset replacement values for more than 250 unique asset types and ownership structures. These typical asset values can be used to produce a relative measure of financial impact — expressing the costs of climate physical hazard exposure as a percentage of the typical asset value and providing an indicator of the financial impact of those costs to an asset, or in aggregate for a company owning many assets.
The exposure scores and financial impact metrics are measured by looking at a specific hazard. For flooding, for example, we calculate the annual frequency of exceeding a historical 100-year flood level relative to a baseline period between 1950 and 1999 for four scenarios and all decades between the 2020s and 2090s. We then look at the business interruption, cleanup and repair and calculate the projected cost to an asset. The exposure scores demonstrate the presence of climate hazards at asset locations or in aggregate for a company, while the financial impact metrics quantify the financial costs of that exposure as a percentage of the future value of a specific asset type or group of assets, enabling users to focus on those hazards that will potentially have the greatest financial impact absent adaptation and resilience measures.
This research was prepared by and reflects the views of S&P Global Sustainable1, which is separate and independent from other businesses/divisions of S&P Global, including S&P Global Ratings.
I hope you have enjoyed this week’s read, please feel free to reach out if you would like to inquire as to how to open a JMP Trading account.
Regards,
Head, Fixed Interest and Superannuation
JMP Securities
Level 1, Harbourside West, Stanley Esplanade
Port Moresby, Papua New Guinea
Mobile (PNG):+675 72319913
Mobile (Int): +61 414529814