8 November 2021
Welcome to this week’s JMP Report.
On the equity front last week, BSP, KSL and KAM did the hard work. BSP traded 524,295 unchanged at K12.30 per share. KSL had 132,689 shares trading at K10.60 and KAM traded 3,211 shares at K3.00 per share.
Refer details below;
|
WEEKLY MARKET REPORT 01.11.21 – 05.11.21 |
|||||||||||
| STOCK
|
QTY |
CLOSING |
CHANGE |
% CHANGE | 2020 Final Div | 2021 Interim | Yield % | Ex Date | Record Date | Payment Date | DRP |
|
BSP |
524,295 |
12.30 |
– |
0.00 | K1.0500 | K0.39000 | 11.61% | Fri 24 Sept | Mon 27 Sept | Mon 18 October | No |
|
KSL |
132.689 |
3.00 |
– 0.20 | – 6.25 | K0.1690 | K0.08250 | 7.74% | Wed 01 Sept | Thurs 02 Sept | Fri 01 Oct | No |
|
OSH |
– |
10.60 |
– | 0.00 | K0.0000 | – | 0.00% | Mon 30 Aug | Mon 20 Sept | Thur 20 Oct | |
|
KAM |
3,211 |
1.00 |
– | 0.00 | K0.0400 | K0.06000 | 10.00% | Wed 15 Sept | Mon 20 Sept | Thurs 20 Oct | Yes |
|
NCM |
– |
75.00 |
– |
0.00 | K0.0000 | – | 0.00% | Thu 26 Aug | Fri 24 Sept | Mon 01 Nov | |
| NGP | – | 0.70 | – | 0.00 | K0.0000 | – | 0.00% | Fri 17 Sept | Fri 24 Sept | Mon 01 Nov | |
|
CCP |
– |
1.69 |
– | 0.00 | K0.1800 | 0.04600 | 6.19% | Fri 1 Oct | Fri 8 Oct | Fri 26 Nov | Yes |
|
CPL |
– |
0.95 |
– |
0.00 | K0.0000 | – | 0.00% | ||||
On the ASX – last trade on the dual listed stocks
BFL (BSP) $4.82
OSH $4.315
KSL $0.84
On the interest rate front, shortly we should see commentary regarding the 2022 PNG Budget. The handing down of the budget will give investors an indication on when we are likely to see some budgetary raising through the issuance of Government Inscribed Stock. The market has not seen an auction since July and with the high end investors still remaining liquid, the appetite for stock is quite strong.
Bank PNG Tap Bonds rates for the small investors are;
- 2 Year 8.00% – coupon 8.0%
- 4 Year 8.85% – coupon 8.85%
- 8 Year 9.40% – coupon 9.40%
- 10 Year 9.40% – coupon 9.40%
There were no surprises in last weeks auction in the short end with 364 day TBills remaining at 7.20%
What we have been reading this week
What are we reading
Man announces he will quit drinking by 2050

A Sydney man has set an ambitious target to phase out his alcohol consumption within the next 29 years, as part of an impressive plan to improve his health.
The program will see Greg Taylor, 73, continue to drink as normal for the foreseeable future, before reducing consumption in 2049 when he turns 101. He has assured friends it will not affect his drinking plans in the short or medium term.
Taylor said it was important not to rush the switch to non-alcoholic beverages. “It’s not realistic to transition to zero alcohol overnight. This requires a steady, phased approach where nothing changes for at least two decades,” he said, adding that he may need to make additional investments in beer consumption in the short term, to make sure no night out is worse off.
Taylor will also be able to bring forward drinking credits earned from the days he hasn’t drunk over the past forty years, meaning the actual end date for consumption may actually be 2060.
To assist with the transition, Taylor has bought a second beer fridge which he describes as the ‘capture and storage’ method.
Central Banks – including RBA and FED – gradually removing Monetary Stimulus is more good news than bad
Shane Oliver, AMP Capital
Key Points
The march of central banks towards removing monetary stimulus is continuing with the RBA bringing forward its guidance regarding the first rate hike and the Fed set to commence tapering. We expect both to start raising rates later next year.
The shift towards monetary tightening signals slower more constrained share market returns – but the trend should remain up as the impact of monetary tightening is offset by economic recovery & higher profits, monetary policy is still easy and will be for a while & bull markets usually only end when monetary policy is tight.
Introduction
The march of central banks towards tighter monetary policy has stepped up over the last few months. Central banks in Norway, New Zealand and South Korea have raised interest rates, the Bank of Canada has ended quantitative easing and brought forward its expected first rate hike, the Bank of England looks likely to start raising interest rates soon, and several emerging market central banks have raised rates.
In the US the Fed has flagged that it’s likely to announce the start of tapering its bond buying at its meeting this week. This is likely to see its current bond and mortgage-backed securities buying program of $US120bn a month reduced by $US15bn a month such that it ends by mid next year. The Fed’s post meeting statement and press conference is also likely to be a bit more hawkish reflecting more concern about inflation and rate hikes are likely to start in the second half of next year.
And in Australia, having reduced its weekly bond buying from $5bn to $4bn, the RBA has now ended its 0.1% yield target for the April 2024 bond (which had helped keep 2 and 3-year fixed mortgage rates around 2%) and implicitly brought forward its guidance on the first rate hike to late 2023 (previously this was not expected to be “before 2024”).
Missing in this are the Bank of Japan and European Central Bank that both show little sign of moving towards monetary tightening reflecting their history of lower inflation rates.
But the broad hawkish move by central banks has caused ongoing bouts of uncertainty in investment markets – with concern at times that central banks will be too slow to tighten which will see inflation spiral out of control, but at other times concern that central banks will raise prematurely crunching the recovery. So, should investors be concerned?
What’s driving central banks to more hawkishness?
The move to the exits from easy money reflects three key developments:
- First inflation has risen sharply in numerous countries. Much of it can be traced to pandemic-driven distortions to supply and demand – basically a surge in goods demand at a time when supply has been constrained by pandemic-related disruptions and a boost to various services prices from reopening. However, there is rising concern this could feed through into inflation expectations and lead to permanently higher inflation beyond a short-term spike in price levels.
- Second, economies have been recovering with coronavirus outbreaks having smaller impacts on economic activity. And in Australia recovery now looks to be back on track after the recent east coast lockdowns. This is evident in a sharp rebound in our Australian Economic Activity Tracker.
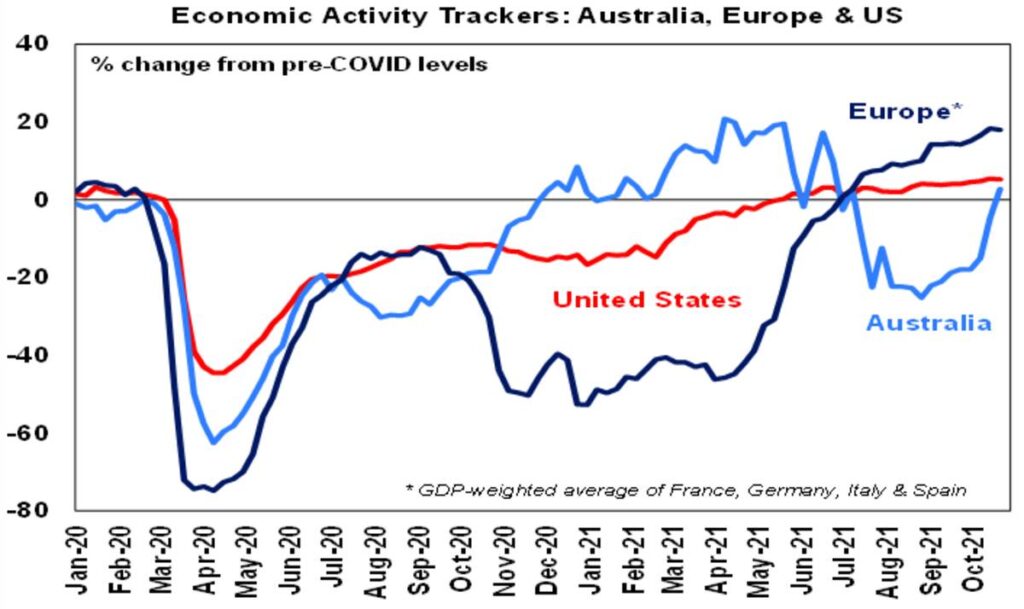
Based on weekly data for eg job ads, restaurant bookings, confidence, mobility, credit & debit card transactions, retail foot traffic, hotel bookings. Source: AMP Capital
- Thirdly, there is increasing confidence that coronavirus is (gradually) coming under control thanks to vaccines heading off serious illness and new treatments for coronavirus.
So, in short, the need for emergency ultra-easy monetary conditions is receding.
The removal of monetary stimulus is a sign of recovery
From a broad cyclical perspective, the intensifying shift towards removing monetary stimulus should not be a major concern for investors. Although it does confirm that we have moved into a more constrained and potentially more volatile phase of the bull market in shares that began in March last year. A typical cyclical bull market in shares has three phases:
- Phase 1 normally starts when economic conditions are still weak and confidence is poor, but smart investors start to see value in shares and anticipate economic and profit recovery helped by easy monetary conditions.
- Phase 2 is driven by rising profits as economic growth turns up and investor scepticism gives way to optimism. While monetary policy invariably starts to tighten, it is from very easy conditions & remains easy so bond yields may be rising, but not enough to derail the bull market.
- Phase 3 sees investors move from optimism to euphoria helped by strong economic and profit conditions, which pushes shares into clearly overvalued territory. Meanwhile, strong economic conditions drive significant inflation problems and force central banks to put the brakes on and move into tight monetary policy, which pushes bond yields significantly higher. The combination of clear overvaluation, investors being fully invested and tight monetary policy sets the scene for a new bear market.
Right now, we are likely in Phase 2 of the investment cycle. The “easy” Phase 1 gains are behind us. Monetary support is starting to diminish and we are now more dependent on earnings growth. This shifting of the gears from the Phase 1 valuation driven gains typically sees some slowing in average share market gains. But the trend remains up and we are likely still a fair way away from the unambiguous overheating and exhaustion evident at the end of a bull market. In this context:
- Central banks are reflecting the reality of economic recovery – so the need for emergency monetary settings is receding. So, it’s really a vote of confidence in recovery. And the reduction in monetary stimulus is being offset for share markets by stronger profits. This can be seen in the current US profit reporting season which has seen 82% of companies beat expectations by an average of around 10%.
- Monetary policy remains ultra-easy and is a long way from being tight. While the Fed and RBA are slowing their bond buying, tapering is not monetary tightening, it’s just slower easing. While some central banks have raised rates, rate hikes in the US and Australia are still around a year away in our view and the ECB and Bank of Japan are further behind.
- Through the period of the last US taper from December 2013 to October 2014 US shares rose – as tapering is a slowing in easing not tightening and rates were still low. There is no reason to expect a different outcome this time, as the start of tapering in the US has been well flagged.
- Even if the first rate hikes from the Fed and RBA are sooner than we anticipate, the experience of the last 30 years suggests an initial dip in shares around the first rate hike but then the bull market resumes – and continues until rates become onerously tight which weighs on economic activity and profits. This can be seen in the next chart. Shares had wobbles when interest rates first started to move up in February 1994 (US shares had a 9% correction), in June 2004 (US shares had an 8% correction) and in December 2015 (US shares had a 13% correction) but thereafter they resumed their rising trend and a bear market did not set in till 2000, 2007 and 2020 after multiple hikes. Recession did not come for seven years after the February 1994 first hike, for three and a half years after the June 2004 first hike and for four years after the December 2015 first hike. This is because the first rate hike only takes monetary policy to a bit less easy, and it’s only when monetary policy becomes tight after numerous rate hikes that the economy gets hit.
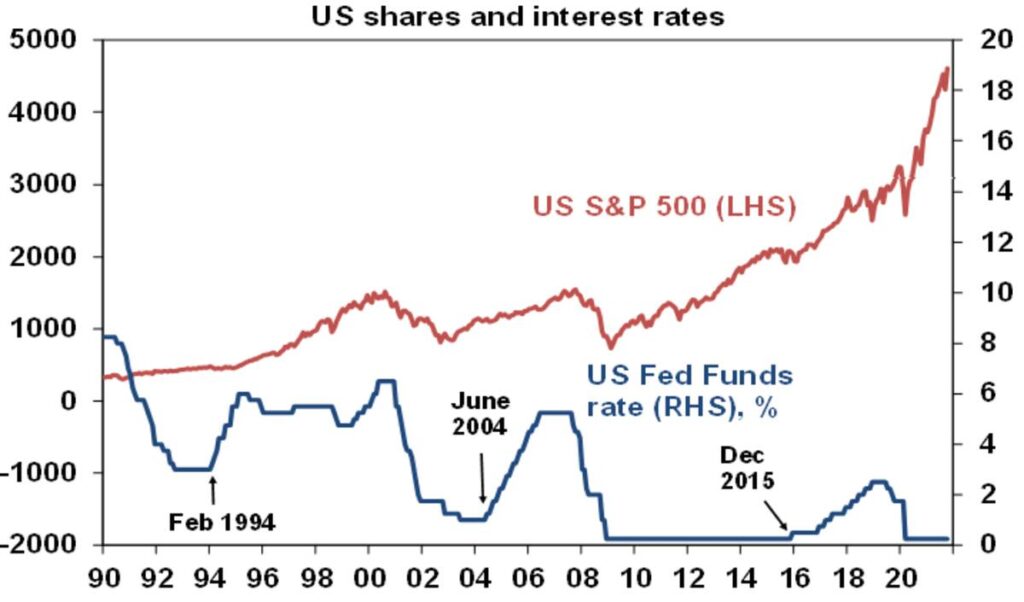
Source: Bloomberg, AMP Capital
The main risk is supply constraints
Of course, the main risk is that this time is different due to supply constraints resulting in much higher for longer inflation necessitating aggressive monetary policy tightening over the next six to 12 months. The most likely scenario is that, as workers return to work with reopening (and backpackers and immigrants return to Australia) and consumer demand swings from goods back to services with reopening, goods supply bottlenecks will start to recede allowing the spike in inflation to recede later next year. Of course, this could take 6 to 12 months to work itself through, but it should ultimately delay the need for an aggressive tightening in monetary policy.
Key things to watch are: labour force participation (if it starts to rise again in the US signalling an end to the so-called “Great Resignation”), wages growth (if it becomes broad based), energy prices (coal and gas prices have fallen back lately which is a good sign), computer chip prices (with some signs that shortages are abating) and demand for goods versus services.
A comment on the RBA
While the RBA does not see the conditions being in place for a rate hike (sustained 2-3% inflation, full employment and 3% or more wages growth) until late 2023, it has effectively brought forward its assessment from 2024. And we expect that the conditions could be in place by late next year and so are allowing for two rate hikes in November and December 2022 taking the cash rate to 0.5%. That said, this is still a year away and we agree with the RBA’s assessment that inflation pressures are less in Australia than in many comparable countries. As Governor Lowe points out we have not seen the same fall in labour force participation and the impact of supply bottlenecks, has been less in Australia. Additionally, we have headline and underlying inflation around 3% and 2% respectively, compared to 5% and 3% in many other comparable countries. As a result, we see money market expectations for rate hikes starting mid-next year and taking the cash rate to 1% to 1.25% by end 2022 as being too hawkish.
While rate hikes are still a fair way off, the removal of the 0.1% April 2024 yield target implies more upwards pressure on 2 and 3-year fixed mortgage rates. The April 2024 bond yield is around 0.7% which is about 0.6% above where it was a week ago implying up to a 0.6% increase in bank funding costs for fixed mortgage lending, at least some of which is likely to be passed. While this has no impact on existing borrowers it will have an impact on new borrowers & with higher serviceability buffers implies some dampening in housing demand.
Concluding comments
The key implications for major asset classes are as follows:
- For fixed income, monetary tightening initially means higher bond yields and so is negative for this asset class. Only when monetary policy becomes tight, seriously threatening economic growth, will long term bonds decline significantly.
- For shares monetary tightening usually means slower more volatile returns but (absent external shocks) new bear markets usually only commence when monetary policies become tight and we are a long way from that.
- Interest rates are shifting from a tailwind to a headwind for Australian housing demand. Property demand tends to be more geared than demand for shares leaving the property market sensitive to interest rate moves. And fixed rates have played a bigger role lately, so rising fixed rates combined with higher serviceability buffers are likely to slow price gains further into next year ahead of likely price falls in 2023 as the RBA starts hiking.
$9.4bn hydrogen mega-project set for Namibia

A new $9.4bn green hydrogen project is set to be developed in Namibia with Hyphen Hydrogen Energy being selected by the local Government to develop the first, large-scale green hydrogen project.
The project will produce an estimated 300,000 tonnes of green hydrogen per year in the African nation which will serve both domestic applications as well as exportation potential.
Read more: Germany, Namibia ink hydrogen cooperation agreement
Read more: Namibia and Pakistan to trial fuel cell generators
Initially, 2GW of renewable electricity generation will be implemented that will produce green hydrogen with further phases planned to scale up to 5GW and 3GW of electrolyser capacity.
Nambia is a nation with an abundance of potential for producing renewable energy and, in turn, green hydrogen.
This project, situated in the Tsau/Khaeb national park, will put the country on the map for green hydrogen as its looks to situate itself as a key global player for the export of hydrogen and ammonia.
Marco Raffinetti, CEO of Hyphen Hydrogen Energy, said, “The first phase, which is expected to enter production in 2026, will see the creation of 2GW of renewable electricity generation capacity to produce green hydrogen for conversion into green ammonia, at an estimated capital cost of $4.4bn.
“Further expansion phases in the late 2020s will expand combined renewable generation capacity to 5GW and 3GW of electrolyser capacity, increasing the combined total investment to $9.4bn.
“The Tsau //Khaeb national park is among the top 5 locations in the world for low-cost hydrogen production, benefiting from a combination of co-located onshore wind and solar resources near the sea and land export routes to market.”
Nangula Uaandja, CEO of the Namibian Investment Promotion and Development Board, said, “This is exactly the type of investment the board aims to attract as it is directly aligned to our mandate of unlocking investment opportunities that drive the economy forward, and most importantly, improve the quality of life for all Namibians.
“This is a milestone project that will enable the country to create on average 15,000 direct jobs over the four years of combined construction and 3,000 permanent direct jobs over the 40-year operational period, while contributing to other efforts to stimulate economic recovery.
“We look forward to welcoming Hyphen as an investor in Namibia and reiterate the Board’s commitment to creating a conducive environment for investment, provide the necessary support to all investors and ensure continued ease of doing business in Namibia.”
Half world’s fossil fuel assets could become worthless by 2036 in net zero transition

$11tn fossil fuel asset crash could cause 2008-style financial crisis, warns new study
Jonathan Watts, Ashley Kirk, Niamh McIntyre, Pablo Gutiérrez and Niko Kommenda
About half of the world’s fossil fuel assets will be worthless by 2036 under a net zero transition, according to research.
Countries that are slow to decarbonise will suffer but early movers will profit; the study finds that renewables and freed-up investment will more than make up for the losses to the global economy.
It highlights the risk of producing far more oil and gas than required for future demand, which is estimated to leave $11tn-$14tn (£8.1tn-£10.3tn) in so-called stranded assets – infrastructure, property and investments where the value has fallen so steeply they must be written off.
The lead author, Jean-Francois Mercure of the University of Exeter, said the shift to clean energy would benefit the world economy overall, but it would need to be handled carefully to prevent regional pockets of misery and possible global instability.
“In a worst-case scenario, people will keep investing in fossil fuels until suddenly the demand they expected does not materialise and they realise that what they own is worthless. Then we could see a financial crisis on the scale of 2008,” he said, warning oil capitals such as Houston could suffer the same fate as Detroit after the decline of the US car industry unless the transition is carefully managed.
The challenge is evident at the ongoing Cop26 climate conference, where some of the nations most at risk of being left with stranded assets – such as the oil and gas exporters Russia and Brazil – are likely to try to slow down the transition as they have done at previous climate meetings, while those most likely to gain – such as the fuel-importing EU – are pushing for faster action.
The new paper, published in Nature Energy, illustrates how a drop in demand for oil and gas before 2036 will reshape the geopolitical landscape. Current investment flows and government commitments to reach net zero emissions by 2050 will make renewable energy more efficient, cheaper and stable, while fossil fuels will be hit by more price volatility. Many carbon assets, such as oil or coal reserves, will be left unburned, while machinery will also be stranded and no longer produce value for its owners.
The most vulnerable assets are those in remote regions or technically challenging environments. Most exposed are Canadian tar sands, US shale and the Russian Arctic followed by deep offshore wells in Brazil and elsewhere. North Sea oil is also relatively expensive to extract and likely to be hit when demand falls.
By contrast, current oil, gas and coal importers such as the EU, Japan, India and South Korea, will reap hefty economic dividends from the transition because they will be able to use the money they save on overseas fuel purchases to invest in their own countries, including money for renewables that will modernise infrastructure, create jobs and improve energy independence.
The situation for the world’s two biggest emitters – the US and China – is more complex as they have more diversified economies with both substantial fossil fuel assets and powerful renewable sectors. The UK is in a similar situation, but as a net energy importer, stands to benefit overall.
Much depends on the speed and spread of decarbonisation, along with the tactics used by fossil fuel exporters to sell off their assets before they lose value.
$25tn in a business-as-usual scenario
In a business-as-usual scenario, researchers estimate global fossil fuel assets would be valued at over $25tn by 2036. Most would be held by the US, Russia and Opec nations.
But their analysis shows the true value of these assets is far lower because renewables are on course to replace them due to technological innovation, investments flows and government policies.
Shrinking to $14tn with net zero coming into effect
The value of fossil fuel assets is projected to fall as a result of net zero policies, which will diminish demand for oil and gas.
Estimated new value of fossil fuel assets Stranded assets
With asset values falling, Opec countries could choose to raise production and sell off fossil fuels as quickly as possible. This would mean more fossil fuel assets are stranded elsewhere. In the US, for example, 62% of assets would be stranded by 2036.
Quota system levels out stranded assets
In another scenario, Opec accepts quotas to avoid a destabilising global fire sale. This would mean slightly lower ($11tn) stranded assets and the losses would be distributed more evenly across producer countries.
This means the true value of fossil fuel assets would be around half that estimated today. This would lead to more than $1tn hits for each of the US, Russia and China by 2036.
Majority of countries still grow their economies
Despite the loss of fossil fuel assets in this net zero scenario, the world economy would still grow by $44tn in real terms by 2036 – or 3.9%. Russia and China would see the value of their fossil fuel assets fall, but their economies would still increase overall.
The outlook for developing nations is even rosier. Countries including Argentina, Kazakhstan and India are projected to record double-digit economic growth, assuming they have access to capital from financial institutions. But the US, Canada and Norway would be among the net losers because so much of their oil and gas assets are comparatively expensive to extract.
The model forecasts large economic benefits for most importers of fossil fuels. The GDP of most European countries would increase under either net zero scenario, researchers found, with gains outstripping the lost fossil fuel revenue.
The benefits vary across nations. The UK, for example, would potentially add $700bn to the value of its GDP under a net zero scenario, despite losing almost half of its fossil fuel assets, worth $120bn, by 2036. By contrast, the GDP of Norway, which is more dependant on oil exports, could fall by 9% unless it diversifies rapidly.
The US could also face an overall hit of $3.5tn and Canada $920bn over the next 15 years if they do not reduce their economic dependence on fossil fuels. The projected losses in these two North American nations are independent of domestic climate policies because they stem mostly from a decline in demand for petroleum products once major markets such as the EU and China have shifted towards net zero.
The extent of asset stranding will partly depend on low-cost producers, such as Saudi Arabia and the rest of the Opec group of oil-producing states. If they ramp up production and begin a fire-sale-style selloff, other exporters could be priced out, leading to a sudden collapse. Under this scenario $11tn of global fossil fuel assets would be stranded.
However, if oil producers agreed on a quota system, the effects could be more evenly distributed and lower overall, though would still eventually reach $11tn of stranded assets, according to the projections. For a nation such as Canada, this could mean a 5% fall in GDP relative to business as usual, compared with 7% under the fire-sale scenario – a difference of about $400bn.
Opec nations are likely to demand hefty compensation for lost revenue if they agree to quotas. Saudi Arabia, for example, would make only $1.3tn under a quota scenario, compared with $1.7tn from a fire sale.
The authors of the study say a race to the bottom should be avoided at all costs.
“If Saudi Arabia plays one way and the US another way, then we will see economic, financial and political instability worldwide, banks going bust and changes in capital flows. People need to think about these transition risks very seriously,” said Mercure, adding that major institutions, including the Bank of England and the Bank of France, were increasingly concerned about the potential dangers to the financial system.
To prevent chaos, he said, oil exporters should diversify their economies as quickly as possible before change is forced on them when importers switch to renewables. Even more important, he said, was closer engagement between the two sides so the overall economic benefits of transition could be shared. “This needs to be a story of international cooperation and not leaving people behind.”
We hope you have enjoyed our read this week.
Stay safe,
Chris Hagan,Head, Fixed Interest and Superannuation
JMP Securities
Level 1, Harbourside West, Stanley Esplanade
Port Moresby, Papua New Guinea
Mobile (PNG):+675 72319913
Mobile (Int): +61 414529814