15 November 2021
Welcome to this week’s JMP Report.
On the equity front, the volume was split between BSP, KSL, OSH, CCP and CPL. BSP had 122,813 shares trade, unchanged at K12.30, KSL traded 79,614 shares to close at K3.20, OSH saw 4,065 shares trade at K10.60, CCP traded 2,765 shares at K1.68 while CPL traded 2,161 shares at K0.95.
Refer details below;
|
WEEKLY MARKET REPORT 08.11.21 – 12.11.21 |
|||||||||||
| STOCK
|
QTY |
CLOSING |
CHANGE |
% CHANGE | 2020 Final Div | 2021 Interim | Yield % | Ex Date | Record Date | Payment Date | DRP |
|
BSP |
122,813 |
12.30 |
– |
0.00 | K1.0500 | K0.39000 | 11.61% | Fri 24 Sept | Mon 27 Sept | Mon 18 October | No |
|
KSL |
79,614 |
3.20 |
0.20 | 0.1875 | K0.1690 | K0.08250 | 7.74% | Wed 01 Sept | Thurs 02 Sept | Fri 01 Oct | No |
|
OSH |
4,065 |
10.60 |
– | 0.00 | K0.0000 | – | 0.00% | Mon 30 Aug | Mon 20 Sept | Thur 20 Oct | |
|
KAM |
– |
1.00 |
– | 0.00 | K0.0400 | K0.06000 | 10.00% | Wed 15 Sept | Mon 20 Sept | Thurs 20 Oct | Yes |
|
NCM |
– |
75.00 |
– |
0.00 | K0.0000 | – | 0.00% | Thu 26 Aug | Fri 24 Sept | Mon 01 Nov | |
| NGP | – | 0.70 | – | 0.00 | K0.0000 | – | 0.00% | Fri 17 Sept | Fri 24 Sept | Mon 01 Nov | |
|
CCP |
2,765 |
1.68 |
– | 0.00 | K0.1800 | 0.04600 | 6.19% | Fri 1 Oct | Fri 8 Oct | Fri 26 Nov | Yes |
|
CPL |
2,161 |
0.95 |
– |
0.00 | K0.0000 | – | 0.00% | ||||
Dual listed POMX on the ASX close for Friday November 12
BFL – $4.53
KSL – $0.835
OSH – $4.29
I have orders on both sides of most stocks with a bit of volume for BSP and CCP.
On the interest rate front, the main drivers remain at play with no new stock on offer in the long end and excess liquidity driving the short end with 364 TBills still averaging 7.20%. Finance company money still remains around the 5.50% for 12mths with FIFL being the strongest.
What we have been reading this week
What are we reading
Compound Interest- it’s like magic – and investors best friend
Dr Shane Oliver
Key Points
Compound interest is an investor’s best friend.
The higher the return, the greater the investment contribution and the longer the period the more it works.
To make the most of it, ensure an adequate exposure to growth assets, contribute early and often to your investment portfolio and find a way to avoid being thrown off by the investment cycle.
Introduction
If there is one “technical thing” investors should know about investing, it’s the power of compound interest. In the rush to understand short-term developments impacting investment markets regarding the economy, interest rates, profits, politics, etc, and in recent times coronavirus its often forgotten about. It can be the worst nightmare of borrowers as interest gets charged on interest if it’s not regularly serviced. But it’s the best friend of investors. The well-known Australian economist Dr Don Stammer refers to it as the “magic” of compound interest. I often refer to it, but given its importance, this note updates one I wrote a few years ago looking at what it is, how it works, various issues around it and why investors often miss out.
What is compound interest?
Compound interest is simply the concept of earning interest on interest or getting a return on past returns. In other words, any interest or return earned in one period is added to the original investment so that it all earns interest or a return in the next period. And so on. Its best demonstrated by some examples.
- Suppose an investor invests $500 at the start of each year and receives a 3% annual return (see Case A in the next table). After 20 years the investment will have increased to $13,838, for a total outlay (or $ Flow) of $10,000.
- But if the investor put the same flow of money in say a higher risk asset returning an average 7% a year, after 20 years it will have grown to $21,933 (Case B). And in year 20, annual earnings are now $1,435, far above the investment earnings in the same year in Case A of $403.
- Finally, if the process was kicked off by a $2000 investment at the start of the first year, with $500 each year thereafter and still earning 7% per annum then after 20 years it will have grown to $27,737 (Case C). By year 20 in this case the annual investment earnings will have increased to $1,815.
These examples are relatively simple, in order to show how compounding works. All sorts of complications can affect the final outcome including inflation (which would boost the nominal results as the table uses relatively low nominal returns), more frequent compounding which occurs in investment markets (which would also boost the final outcome) and the timing of the average return from the high growth/more risky asset through time in that it won’t be a steady 7% year after year.
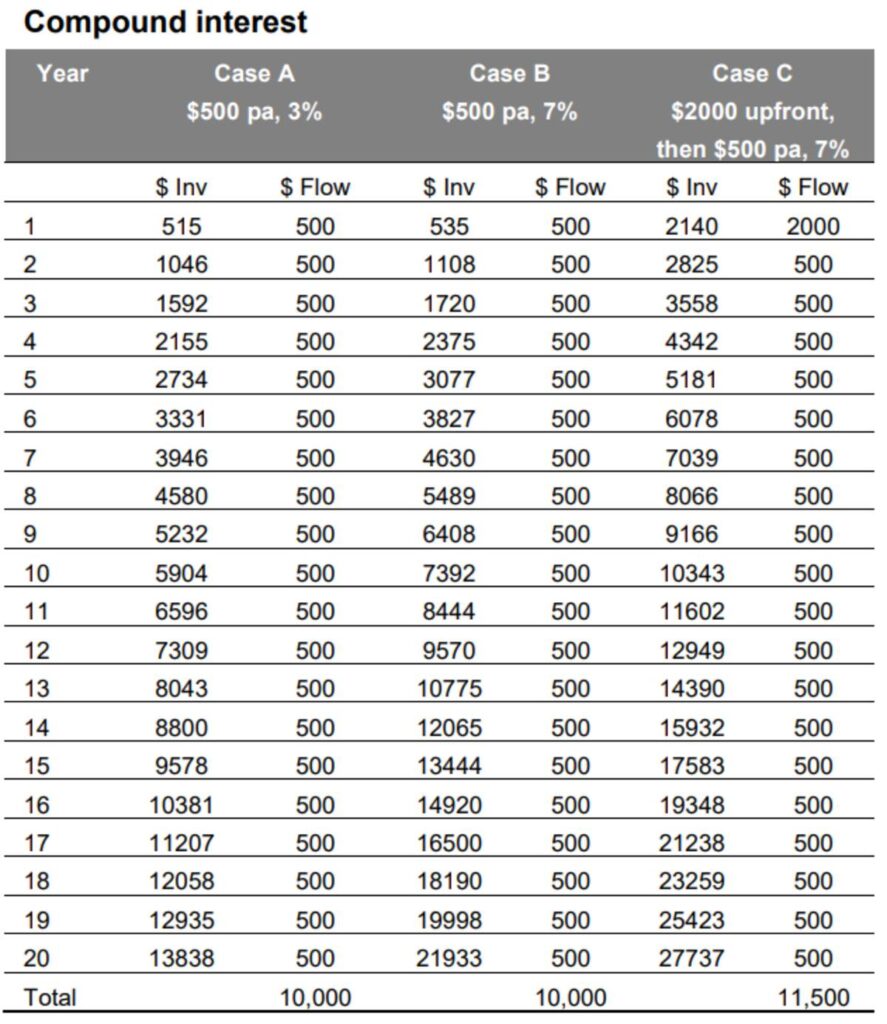
Source: AMP Capital
However, the power of compound interest is clear. From these examples, it is evident that it has three key drivers:
- The rate of return – the higher the better.
- The contribution – the bigger the better as it means there is more to compound on. The $2,000 upfront contribution in Case C boosted the outcome after 20 years by $5804 versus Case B. Not bad for just an extra $1,500 investment.
- Time – the longer the better as it means the longer the compounding process of earning returns on returns has to run. Time also helps smooth out any year-to-year volatility in returns. After 40 years the investment strategy in Case A will have grown to $38,832 but Case B will have grown to $106,805 and Case C will have grown to $129,267.
The next chart illustrates how after about 15 to 20 years the value of the investment in the higher returning cases starts to rise exponentially as returns build on top of returns. This is why compound interest is often described as “magical”.
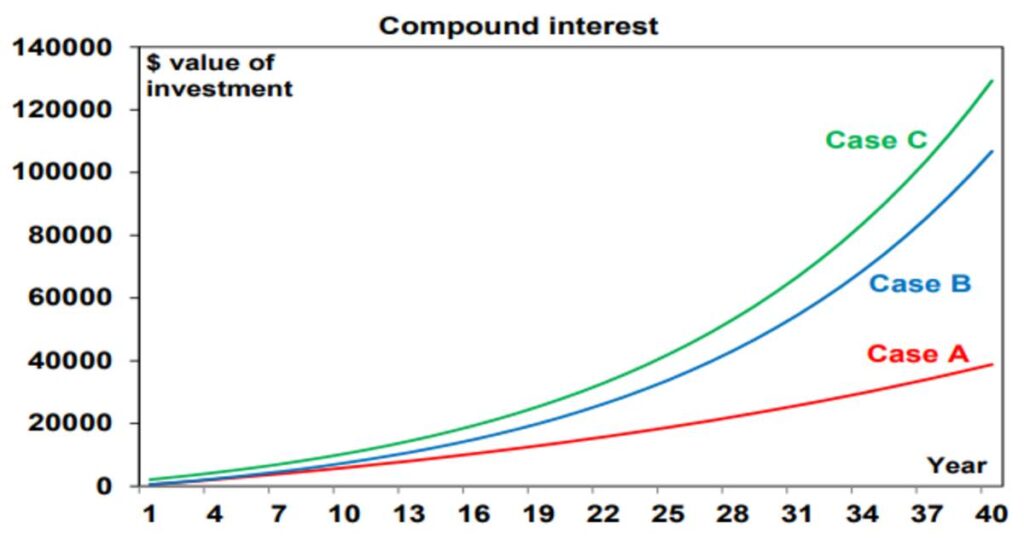
Source: AMP Capital
Compound interest in practice
Growth assets like shares and property provide higher returns than defensive assets like cash and bonds over long periods. This is because their growth potential drives higher returns over long periods of time compensating for their higher volatility. The next chart is my favourite demonstration of the power of compound interest in action. It shows the value of $1 invested in 1900 in Australian cash, bonds and shares with earnings on each asset reinvested along the way. Since 1900 cash has returned 4.8% pa, bonds returned 5.8% pa & shares 11.8% pa.
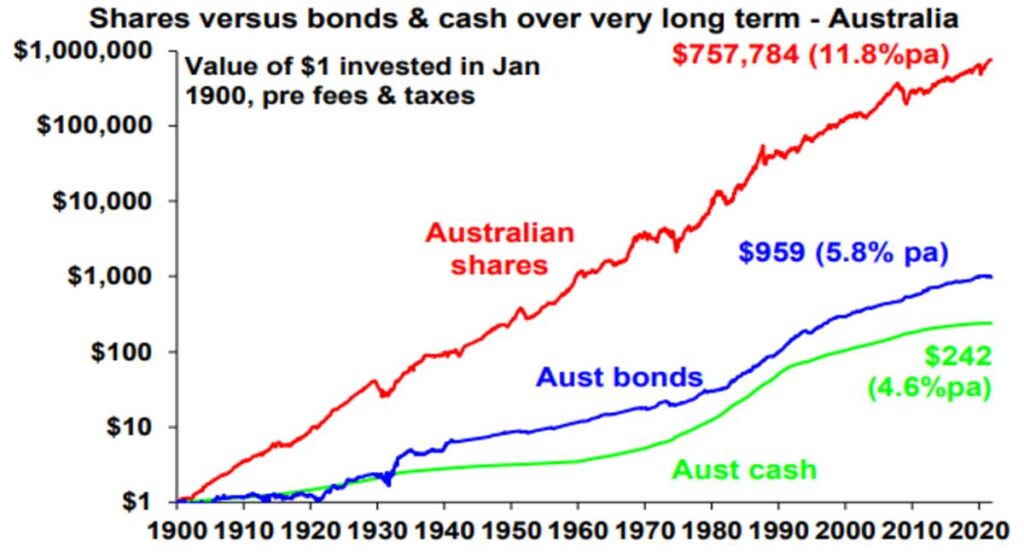
Source: Global Financial Data, AMP Capital
Shares are more volatile than cash and bonds. However, the compounding effect of their higher returns over time results in much higher wealth accumulation from them. Although the return from shares is only double that of bonds, over 121 years the $1 invested in 1900 will have grown to $757,784 today, whereas the $1 investment in bonds will only be worth $959 and that in cash just $242. Of course, investors don’t have 121 years. But the next chart shows rolling 20 year returns from Australian shares, bonds and cash and its evident shares have invariably outperformed cash and bonds over such a period.
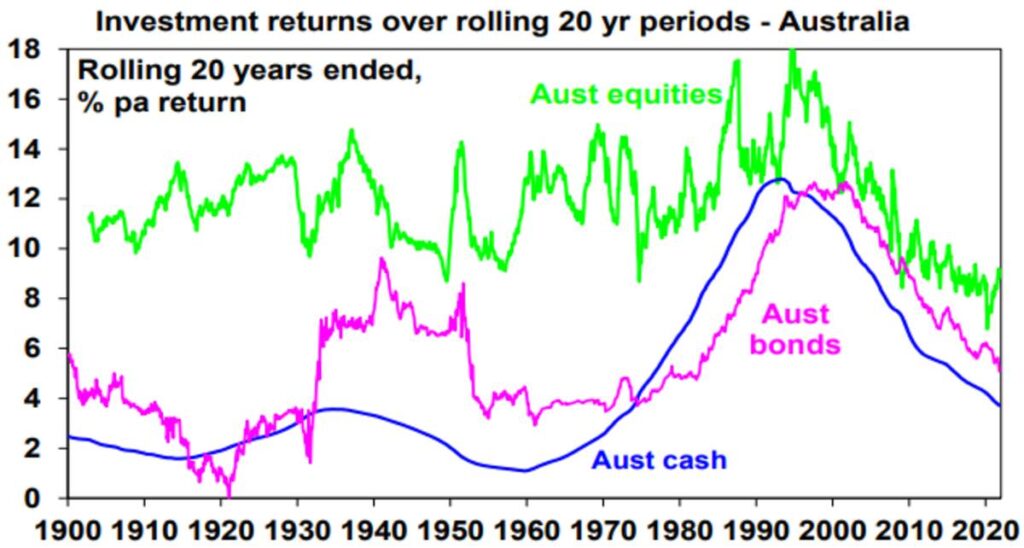
Source: Bloomberg, AMP Capital
While the return gap between shares on the one hand and bonds and cash on the other narrowed over the last 30 years this reflects the high interest rates and bond yields of 20-30 years ago, which drove relatively high returns from these assets. With bond yields and interest rates now very low such returns are very unlikely to be repeated from these assets.
Some issues
What about property? Over long periods of time Australian residential property has generated similar total returns (i.e. capital growth plus income) as Australian equities. For example, since 1926 Australian residential property has returned 10.7% pa, which is similar to the 11.3% pa return from shares.
What about fees? Fees on managed investment products will reduce returns over time, but less so for cash and fixed income products and for equities the impact will be offset by franking credits in the case of Australian shares (which are around 1.2% pa) and which have not been allowed for in the last two charts.
Are these returns sustainable? This is a separate issue, but the historical returns from the four assets likely all exaggerate their future medium term (say 10 year) return potential. Cash rates and bank term deposit rates are currently below 1% and may only average 1 to 3% over the medium term, current 10-year bond yields around 1.7% suggest pretty low bond returns for the decade ahead (in fact just 1.7% for an investor who buys and holds a 10-year bond). And the Australian equity return may be closer to 8% pa, reflecting a grossed up for franking credits dividend yield around 5% and capital growth around 3%. But for shares this sort of return is not bad and still leaves in place significant potential for investors to reap rewards from the power of compounding over the long term.
But why do investors often miss out?
But what can cause investors to miss out on the power of compound interest if it’s so obvious? There are several reasons:
- First investors may be too conservative in their investment strategy, opting for lower returning defensive assets like cash or bank deposits. This may avoid short term volatility but won’t build wealth over the long term.
- Second, they leave it too late to start investing or don’t contribute much initially. This makes it difficult to catch up in later life & leaves them more at the whim of financial market swings. Fortunately, the superannuation system forces Australian’s to start early in life, albeit last year’s pandemic related early withdrawals may have thrown this off for some.
- Third, they attempt to “beat” the market by either trying to time market moves up or down or buying and selling particular stocks. Getting this right is easier said than done and investors often end up getting it wrong – buying at the top and selling at the bottom which destroys wealth.
- Fourth, they are not diversified enough.
- Finally, some are sucked in over the years into investment opportunities seeming to promise a free lunch, which then fail. The key is to check the asset is producing fundamental value and not just dependent on the crowd pushing it higher.
Implications for investors
There are several implications for investors looking to take advantage of the power of compound interest.
First, if you can take a long-term approach, focus on growth assets like shares and property with a long-term track record.
Second, start contributing to your investment portfolio as much as you can as early as possible.
Third, find a way to manage cyclical swings. For example, invest a bit of time in understanding that the investment cycle is a normal part of investment markets and partly explains why growth assets have a higher return in the first place.
Finally, if an investment sounds too good to be true – implying a free lunch – or you can’t understand it, then stay away.
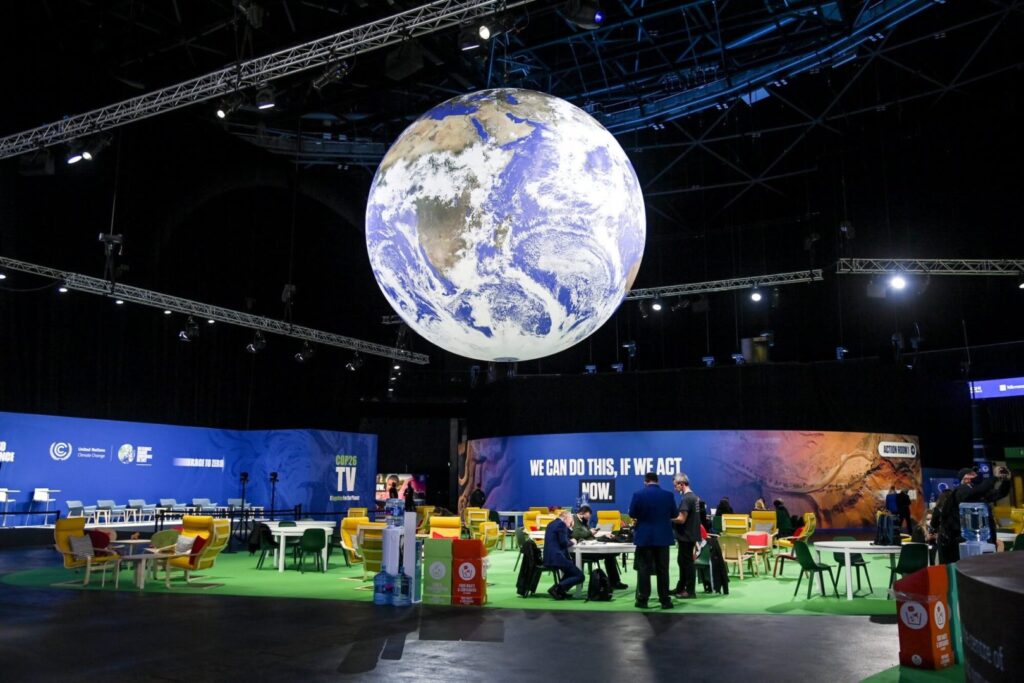
COP26 KEEPS 1.5C ALIVE AND FINALISES PARIS AGREEMENT
13.11.2021
- COP26 ends with global agreement to accelerate action on climate this decade
- Two weeks of intense negotiations finally complete the Paris Rulebook
- For the first time COP agrees position on phasing down unabated coal power
- The Glasgow Climate Pact caps two years of diplomacy and ambition raising
COP26 has today concluded in Glasgow with nearly 200 countries agreeing the Glasgow Climate Pact to keep 1.5C alive and finalise the outstanding elements of the Paris Agreement.
Climate negotiators ended two weeks of intense talks on Saturday with consensus on urgently accelerating climate action.
The Glasgow Climate Pact, combined with increased ambition and action from countries, means that 1.5C remains in sight, but it will only be delivered with concerted and immediate global efforts.
The Glasgow Climate Pact will speed up the pace of climate action. All countries agreed to revisit and strengthen their current emissions targets to 2030, known as Nationally Determined Contributions (NDCs), in 2022. This will be combined with a yearly political roundtable to consider a global progress report and a Leaders summit in 2023.
The Paris Rulebook, the guidelines for how the Paris Agreement is delivered, was also completed today after six years of discussions. This will allow for the full delivery of the landmark accord, after agreement on a transparency process which will hold countries to account as they deliver on their targets. This includes Article 6, which establishes a robust framework for countries to exchange carbon credits through the UNFCCC.
And for the first time, heeding calls from civil society and countries most vulnerable to climate impacts, the COP agreed action on phasing down fossil fuels.
COP decisions went further than ever before in recognising and addressing loss and damage from the existing impacts of climate change.
There were also commitments to significantly increase financial support through the Adaptation Fund as developed countries were urged to double their support to developing countries by 2025.
The final COP26 text follows two years of intense diplomacy and campaigning undertaken by the UK Presidency to raise ambition and secure action from almost 200 countries.
Work focussed on driving short term reduction of emissions to limit temperature rises to 1.5C, mobilising both public and private finance, and supporting communities to adapt to climate impacts.
When the UK took on the COP26 mantle, in partnership with Italy, nearly two years ago, only 30% of the world was covered by net zero targets. This figure is now at around 90%. Over the same period, 154 Parties have submitted new national targets, representing 80% of global emissions.
The UK Presidency has also been focused on driving action to deliver emissions reductions. We have seen a huge shift in coal, with many more countries committing to phase out unabated coal power and ending international coal financing.
Alongside this, we have seen a marked commitment to protect precious natural habitats, with 90% of the world’s forests covered by a pledge from 130 countries to end deforestation by 2030.
While on the world’s roads, the transition to zero emissions vehicles is gathering pace, with some of the largest car manufacturers working together to make all new car sales zero emission by 2040 and by 2035 in leading markets. Countries and cities are following suit with ambitious petrol and diesel car phaseout dates.
Current policies would leave us on a path to a devastating temperature rise. But work done by independent experts Climate Action Tracker show that with the full implementation of the fresh collective commitments could hold temperature rise to 1.8C.
Even with the action committed both during and before COP26, communities around the world will continue to feel the impact of our changing planet.
Reflecting on the task ahead, COP26 President Alok Sharma said:
We can now say with credibility that we have kept 1.5 degrees alive. But, its pulse is weak and it will only survive if we keep our promises and translate commitments into rapid action. I am grateful to the UNFCCC for working with us to deliver a successful COP26.
From here, we must now move forward together and deliver on the expectations set out in the Glasgow Climate Pact, and close the vast gap which remains. Because as Prime Minister Mia Mottley told us at the start of this conference, for Barbados and other small island states, ‘two degrees is a death sentence’.
It is up to all of us to sustain our lodestar of keeping 1.5 degrees within reach and to continue our efforts to get finance flowing and boost adaptation. After the collective dedication which has delivered the Glasgow Climate Pact, our work here cannot be wasted.
Read the full texts on the UNFCCC website.
Miners could need to double CAPEX to meet decarbonization goals by 2050 – Bank of America
(Kitco News) – Renewed focus on global decarbonization as the United Nations Climate Change Conference (COP26) wraps up will lead to more demand for critical industrial metals, according to commodity analysts at Bank of America.
In a report published Monday, the U.S. bank said that the global goal for a sustainable low-carbon future would put more pressure on demand for metals that are already seeing significant supply and demand imbalances.
“Decarbonisation effectively means an electrification of the global economy through renewables, power storage and EVs,” the analysts said in the report. “Working some of the IEA’s Net Zero assumptions into our metals demand models, we calculate CAGR in consumption of 3.6%, 24.6%, 7.6%, 18%, 2.5% and 3.3% for copper, lithium, nickel, cobalt, silver and platinum respectively.”
Bank of America used lithium, a hot commodity through 2021, as an example of how demand is expected to grow as more battery storage and electric vehicles come online.
The analysts noted that the total lithium supply in 2020 was 387,000 tonnes; demand is forecasted to rise to 3 million tonnes and 5 million tonnes by 2030 and 2050, respectively.
Lithium has the most significant growth potential as the world decarbonizes; however, it is not alone. Bank of America sees copper demand growing 3.5% by 2030; nickel demand is expected to grow 7.6% in the next 10 years; among precious metals, silver demand is expected to grow 2.5% by 2030 and platinum demand is projected to rise 3.3%.
“What does this mean for the mining industry? To facilitate that demand growth, miners need to boost CAPEX. True, recycling can help, but ultimately, some primary capacity is also needed.,” the analysts said. “We estimate that the industry needs to spend $72B annually out to 2030 just to prevent bottlenecks towards achieving Net-Zero. To put this number into context, global mining CAPEX averaged around $99.5B in the past decade,” the analysts said.
To reach the targets set for 2050, Bank of America added that CAPEX might need to double.
Looking at precious metals, the analysts said that solar power will drive silver demand in the coming years.
Platinum is also a metal that is attracting some attention as the green revolution moves forward.
“The hydrogen economy could potentially have profound implications for the global economy. Indeed, electrolysis can be used to store power generated from renewables as hydrogen, before the gas is being re-converted into electricity as the needs arise,” the analysts said.
Bank of America said that platinum demand from the hydrogen economy is expected to rise to more than 1.1 million tonnes within the next ten years. By 2050 demand could increase to 1.7 million tonnes.
The analysts also noted that hydrogen fuel-cell vehicles will also increase demand for platinum.
CONTAINER PREMIUMS: Respite in trans-Pacific premium rates could be short-lived
Greg Holt, Parisha Tyagi, George Griffiths
Asia-to-North America rates under pressure as the flow of export cargoes slows
Demand could pick up again in Dec-Jan loading window on inventory restocking
All-inclusive container shipping rates held steady in the week to Nov. 12 as carriers were reluctant to offer further discounts as demand remained strong and there were growing concerns about the supply of capacity and equipment in the December-January loading period.
Rates including premium service fees for the North Asia-to-West Coast North America route were heard in the $10,000-$12,000/FEU range, while premium rates from North Asia to East Coast North America were mostly in the $14,000-$16,000/FEU range.
But Freight All Kinds base rates without premiums from North Asia at $8,500/FEU to the West Coast and around $10,000/FEU to the East Coast were sometimes available for advance bookings this week. There were reports of a lull in demand for space on ships leaving China, while the Port of Los Angeles is forecasting import volumes in the week of Nov. 21-27 to fall 16% on a year-on-year basis.
“We have space nowadays. It seems some shippers can’t get their cargoes ready in time for export due to power shortages [in China] and a lack of [raw materials],” a Mexico-based freight forwarder said.
But omissions in calling on West Coast ports due to severe congestion rather than a lack of demand could again tighten carrying capacity for Asian exports to North America. Taiwan-based Wan Hai Lines announced this week it would withdraw capacity from its services to the US West Coast due to Los Angeles-Long Beach port congestion and reassign those ships to its core intra-Asia business, while shipping firms MSC, Maersk and Zim said previously they would omit calls at Seattle-Tacoma as terminals there have run out of space to unload cargoes.
“We’re seeing the worst traffic jam in history at LA-Long Beach,” a US-based freight forwarder said. “It’s only a matter of time now until we see the impact of those vessels not getting back to Asia and more blank sailings.”
There are also strong indications that major retailers are preparing to make a strong push to replenish their inventories in the December-January loading window, the freight forwarder added.
Southeast Asia still lacking ships and equipment
Although more carrying capacity from China was open for spot bookings, equipment availability was still a significant challenge around most of Southeast Asia and South Asia.
All-inclusive premium rates from Southeast Asia to East Coast North America were heard at $17,000-$19,000/FEU, down by around $1,000-$2,000/FEU from last week, while rates to West Coast North America were stable in the $15,000-$17,000/FEU range.
“On China-US, there is definitely a slowdown, it’s very evident in the price quotations we get,” a logistics provider based in Vietnam said. “Earlier there was a severe shortage and nobody was offering bookings, but now we keep getting low quotes. Even from Vietnam, some forwarders quote $15,000, in some cases even $12,000 per FEU for the US West Coast. There are a lot of sub-brokers in the market, who buy space from carriers and then sell it to other brokers and so on.”
A shipper based in Singapore said demand was easing because most exporters already placed bookings for the Christmas season.
“The congestion at Singapore port has eased off, mostly because vessels are stuck either in China or the US,” he said.
But demand is expected to pick up again over the next few weeks from a rush in cargoes ahead of the Lunar New Year holidays beginning Feb. 1. Power rationing in China is likely to continue throughout the northern winters, which raises the possibility of heavy cargo backlogs from February onwards.
“Even if prices start rising again, they will be lower than the pre-Golden Week levels because the supply chain situation is somewhat better now,” a trader based in Singapore said. The resolution of congestion at North American ports is the key to any recovery in the supply chain, he added.
Asia-to-Europe rates slide as demand cools
Container rates from Asia to Europe saw some downside over the course of the week, edging lower in what was a largely anticipated move following lower demand as the pre-Christmas demand spike eased.
Despite some slight cooling of rates, which have been at or near all-time high levels for much of 2021, delays for European bound cargo have continued to mount, with issues in the hinterland around truck and rail availability continuing to cause further congestion at ports.
“Falling rates doesn’t mean easing issues at this stage,” said a freight forwarder. “Delays are still rising.”
But unlike the trans-Pacific market, the outlook for Asia to Europe container rates in the December-January loading window remains bearish with further erosion of freight rates expected towards the end of the year.
Platts Container Rate 1 – North Asia-to-North Continent – fell $500 on the week to $16,500/FEU on Nov. 12.
We hope you have a few takeaways and have enjoyed this week’s read.
Have an awesome week,
Chris Hagan,Head, Fixed Interest and Superannuation
JMP Securities
Level 1, Harbourside West, Stanley Esplanade
Port Moresby, Papua New Guinea
Mobile (PNG):+675 72319913
Mobile (Int): +61 414529814