11 April, 2022
Welcome to this week’s JMP Weekly Report
Trading on the local bourse last week was active with trades in four stocks. BSP traded 2,705 shares closing unchanged at K12.05 along with KAM trading 2,499 shares closing unchanged at K1.00. KSL saw 41,970 shares change hands closing down 5 toea to close at K2.95. CCP saw 300,000 shares change hands closing up 0.10t to finish the week at K1.70 per share.
WEEKLY MARKET REPORT | 4 April, 2022 – 8 April, 2022
| STOCK | QUANTITY | CLOSING PRICE | CHANGE | % CHANGE | 2021 FINAL DIV | 2021 INTERIM | YIELD % | EX-DATE | RECORD DATE | PAYMENT DATE | DRP |
| BSP | 2,705 | 12.05 | – | – | K1.3400 | – | 11.61 | THU 10 MAR | FRI 11 MAR | FRI 22 APR | NO |
| KSL | 41,970 | 2.95 | -0.05 | -1.67 | K0.1850 | – | 7.74 | THU 3 MAR | FRI 4 MAR | FRI 8 APR | NO |
| STO | – | 18.50 | – | – | K0.2993 | – | – | MON 21 FEB | TUE 22 FEB | THU 24 MAR | – |
| KAM | 2,499 | 1.00 | – | – | – | – | 10.00 | – | – | – | YES |
| NCM | – | 75.00 | – | – | USD$0.075 | – | – | FRI 25 FEB | MON 28 FEB | THU 31 MAR | – |
| NGP | – | 0.70 | – | – | – | – | – | – | – | – | – |
| CCP | 300,000 | 1.70 | 0.10 | 6.25 | – | – | 6.19 | – | – | – | YES |
| CPL | – | 0.95 | – | – | – | – |
– | – | – | – | – |
Dual listed ASX and PNGX Stocks
BFL – $5 down 3c
KSL – .86c up .015c
NCM – $27.92 up 75c
STO – $8.07 up 15c
My order book this week has us a nett buyer of BSP, CCP and sellers of CPL. Please contact me if you wish to place on order.
In the Gentleman’s Market (interest rates of course) we saw an aggressive auction with the 364day TBills averaging 5.0%. Fincorp leads the 1yr money at 5.10%.
The Market is yet to receive any feedback on the rescheduled GIS auction, we will of course keep you posted.
Download | Low Carbon Pulse - April 2022
What we’ve been reading this week
5 Great charts on investing that are particularly useful in times of uncertainty like the present
Dr Shane Oliver
Key Points
This makes it all the more important to stay focused on the basic principles of successful investing.
These five great charts help illuminate key aspects of investing: the power of compound interest; the investment cycle; the roller coaster of investor emotion; the wall of worry; and time is on your side.
Successful investing can be very difficult in times like the present with immense uncertainty around inflation, interest rates, war in Ukraine & continuing covid waves.
Introduction
Investing is often seen as complicated. This has been made worse over the years by: the increasing complexity in terms of investment products and choices; regulations and rules around investing; the role of the information revolution and social media in amplifying the noise around investment markets; and the expanding ways available to access and transact in various investments. But at its core, the basic principles of successful investing are simple & timeless. One way to demonstrate that is in charts or pictures. So, this note updates five charts I find useful in understanding investing. Of course, there are more than five, so I’ll put out part 2 in a few weeks. These charts are useful in times like the present where the noise has reached fever pitch with the pandemic, rising inflation, rising interest rates & war in Ukraine making the short-term outlook uncertain.
Chart #1 The power of compound interest.
This chart is my absolute favourite and became ingrained in my thinking after many years of hearing my good friend, the well-known economist Dr Don Stammer, expound on the magic of compounding. He is right – compound interest which sees returns compound on top of past returns is like magic!
Data shown is prior to any fees and taxes. Source: Bloomberg, ASX, RBA, AMP
The chart shows the value of $1 invested in various Australian assets in 1900 allowing for the reinvestment of dividends and interest along the way. That $1 would have grown to $242 if invested in cash, to $922 if invested in bonds and to $788,013 if invested in shares. While the average return since 1900 is only double that in shares relative to bonds, the huge difference between the two at the end owes to the impact of compounding or earning returns on top of returns. So, any interest or return earned in one period is added to the original investment so that it all earns a return in the next period. And so on.
The “Law of 72” is a useful tool to understanding how long it takes an investment to double in value using compounding. Just divide the rate of return into 72 and that’s the answer (roughly). For example, if the rate of return is 1% pa (eg, the interest rate on a bank term deposit if you’re lucky), it will take 72 years to double in value (= 72 divided by 1). But if it’s, say, 8% pa (eg, the expected return from Australian shares including dividends), then it will take just 9 years (= 72 divided by 8).
Key message: if we want to grow our wealth, we must have exposure to growth assets like shares and property.
Chart #2 The cycle
Of course, shares can have lots of setbacks along the way as is particularly evident during the periods highlighted by the arrows on the share market line. And they are vulnerable to the uncertainties around inflation and the war in Ukraine at present. In fact, the higher returns shares generate over time relative to cash and bonds is compensation for the periodic short-term setbacks they suffer from. But understanding those periodic setbacks – that there will always be a cycle – is important in not getting thrown off the higher returns that shares and other growth assets provide over the longer term. The next chart shows a very stylised version of the investment cycle.
The investment cycle
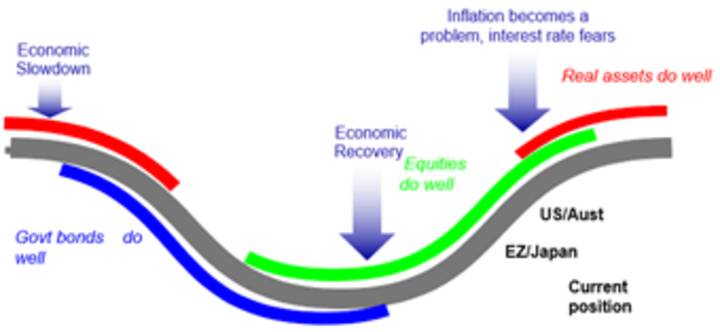
Source: AMP
The grey line shows the economic cycle from “boom” to “bust” to “boom” again. Prior to the low point in the economic cycle, shares invariably find a bottom thanks to attractive valuations and easy monetary policy and as smart investors look forward to an economic recovery. This phase is usually characterised by scepticism. Shares then move higher, eventually supported by stronger earnings on the back of economic recovery, which eventually gives way to a blow off phase or euphoria as investors pile in. This is ultimately brought to an end as rising inflation flowing from strong economic conditions results in ever-tightening monetary policy, which combines with smart investors anticipating an economic downturn and results in shares coming under pressure. Usually around the top of the cycle real assets – like property and infrastructure – are a better bet than shares as they benefit from strong real economic conditions. But once the downturn hits, bonds are usually the place to be as slowing growth eventually gives way to falling inflation, all of which sees bond yields decline, producing capital gains for investors. At some point, of course, easing monetary conditions and attractive valuations see shares bottom out and the whole cycle repeats. Of course, the details of each cycle are different and sometimes “external” events like the coronavirus pandemic or wars can drive downturns even when we are not seeing the sort of cyclical excess usually seen at market tops.
Key message: cycles are a fact of life and while they don’t repeat precisely, they rhyme. It’s invariably the case that the share market leads the economic cycle (bottoming out before economic recovery is clear and topping out before an economic downturn has really hit and vice versa at tops) and that different assets perform relatively best at different phases in the cycle.
Chart #3 The roller coaster of investor emotion
The swings we see in investment markets are far greater than can be justified by movements in investment fundamentals alone – ie profits, dividends, rents, interest rates, etc. In fact, investor emotion plays a huge part. The next chart shows the roller coaster that investor emotion traces through the course of an investment cycle. A bull market runs through optimism, excitement, thrill and ultimately euphoria by which point the asset class is over loved (and usually overvalued too) – everyone who is going to buy has – and it becomes vulnerable to bad news. This is the point of maximum risk. Once the cycle starts to turn down in a bear market, euphoria gives way to anxiety, denial, fear, capitulation and ultimately depression at which point the asset class is under loved (and usually undervalued) – everyone who is going to sell has – and it becomes susceptible to good (or less bad) news. This is the point of maximum opportunity. Once the cycle turns up again, depression gives way to hope, relief and optimism before eventually moving on to euphoria again.
The roller coaster of investor emotion
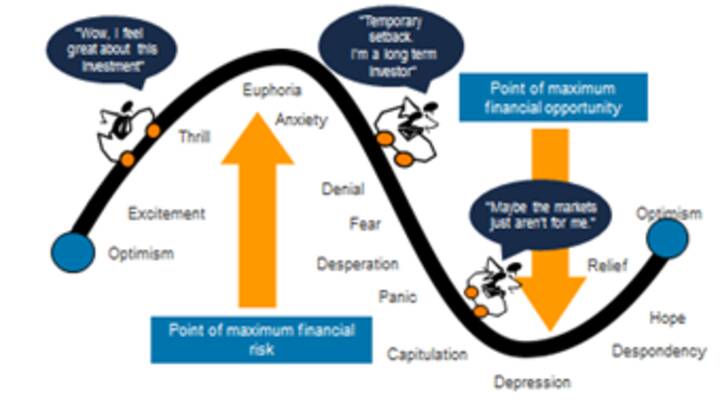
Source: Russell Investments, AMP
Key message: investor emotion plays a huge roll in amplifying the investment cycle. The key for investors is not to get sucked into this emotional roller coaster: avoid assets where the crowd is euphoric and convinced it’s a sure thing, and favour assets where the crowd is depressed and the asset is under loved. Of course, doing this is often easier said than done.
Chart #4 The wall of worry
It seems that these days there is always something for investors to worry about. This year it’s particularly the case with surging inflation, supply shortages, central banks tightening monetary policy, rising bond yields, concerns that inverting yield curves may be signalling recession, war in Ukraine and all against the backdrop of periodic coronavirus waves. But while this is real and adds to uncertainty, in a long-term context its mostly noise. The global and Australian economies have had plenty of worries over the last century, but it got over them with Australian shares returning 11.8% per annum since 1900, with a broad rising trend in the All Ords price index as can be seen in the next chart, and US shares returning 9.8% pa. (Note, this chart shows the All Ords share price index, whereas the first chart shows the value of $1 invested in an accumulation index, which allows for changes in share prices and dividends.)
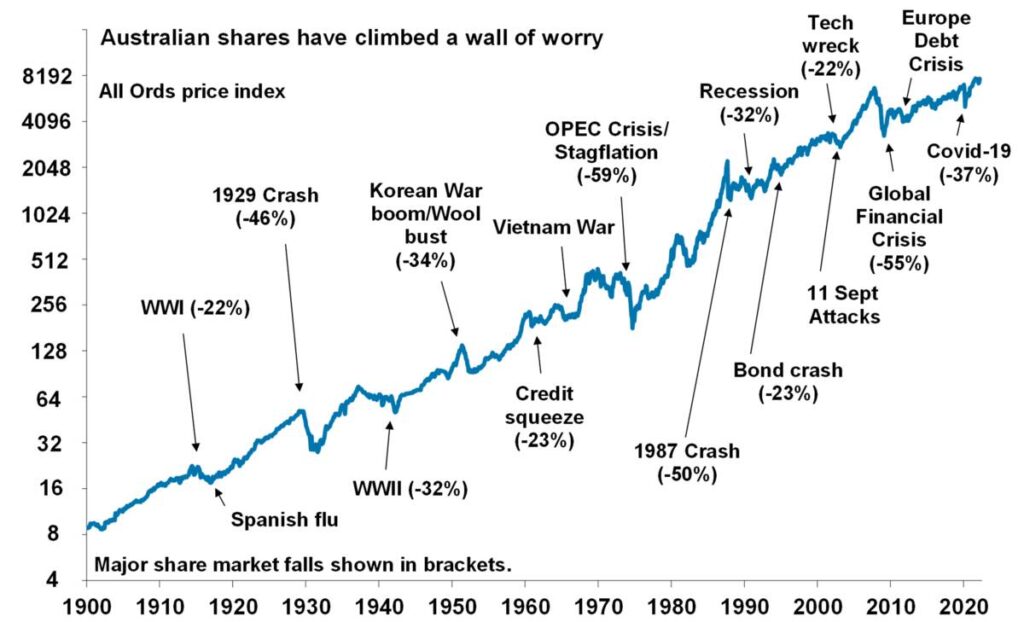
Source: ASX, AMP
Key message: worries are normal around the economy and investment markets but most of them turn out to be no more than short term noise.
Chart #5 Time is on your side
Investment markets bounce all over the place in the short term. As can be seen in the next chart even annual returns in the share market are highly volatile, but longer-term returns tend to be solid and relatively smooth. Since 1900 for Australian shares roughly two years out of ten have had negative returns but there are no negative returns over rolling 20-year periods. (It’s roughly two & a half years out of 10 for US shares since 1900.)
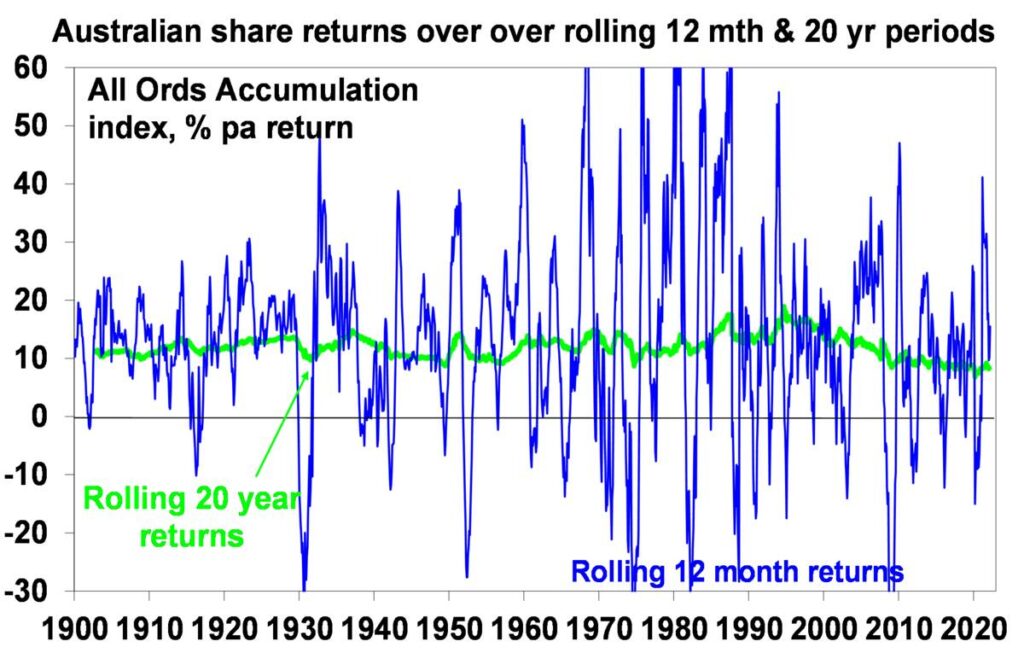
Data is shown prior to any fees and taxes. Source: Bloomberg, ASX, RBA, AMP
Key message: short term share returns can sometimes see violent swings, but the longer the time horizon the greater the chance your investments will meet their goals. It’s also extremely hard to time these short-term swings. So in investing, time is on your side and its best to invest for the long-term.
Why we should listen to Bill Gates on Nuclear Energy

In his 2018 year-in-review blog post, Gates said: “Nuclear is ideal for dealing with climate change, because it is the only carbon-free, scalable energy source that’s available 24 hours a day.” But to Bill Gates, nuclear energy is not just a technology that can help us meet climate change goals; it also can be used to reduce global poverty. Gates believes that if we are able to expand access to affordable and clean electricity, it would drastically improve living conditions for millions and would ultimately be a huge step in lifting those people out of poverty.
Gates has done more than just write about the benefits of nuclear energy. In 2006, he helped launch TerraPower LLC, a nuclear reactor design company that aims “to improve the world through nuclear energy and science.” In Gates’s view, investing in advanced nuclear technology can help America regain its position as the global leader on nuclear energy while fighting poverty and driving worldwide decarbonization.
As important as Bill Gates’ voice is to the cause of promoting nuclear energy as a critical solution to solving complex global problems, he is hardly alone among technology entrepreneurs. The late Paul Allen, who was co-founder of Microsoft Corp. with Bill Gates, also championed the benefits of nuclear energy. And Peter Thiel, the co-founder of PayPal, Palantir Technologies and Founders Fund, wrote a New York Times op-ed arguing for adapting U.S. energy policy to support a new atomic age.
Thiel wrote: “If we are serious about replacing fossil fuels, we are going to need nuclear power, so the choice is stark: We can keep on merely talking about a carbon-free world, or we can go ahead and create one.”
Gates, Allen and Thiel are just a few names of our nation’s most technologically savvy business leaders who have invested in promoting the value of nuclear energy. And as more and more organizations and environmental groups stand behind carbon-free nuclear energy, the support for nuclear has never been so vast and varied.
Some of the smartest thinkers of our time are calling on us to see nuclear energy for its potential to change the world.
It’s time we listen.
World Gold Council Q1 wrap
By Ainslie Bullion
The World Gold Council just released their figures for both the month of March and also Q1 of 2022. Unsurprisingly given the global geopolitical events and inflation issues before us gold demand was the highest seen in years.
“Global gold ETFs had net inflows of 187.3t (US$11.8bn, 5.3% of AUM) in March, with assets just below the record of US$240.3bn, set in August 2020. March inflows were the strongest since February 2016, despite a significant rebound in equities and a strong US dollar performance. There were positive flows across all regions during the month, but most came from North American and European gold ETFs. March demand brought Q1 inflows to 269t (US$17bn) –the highest quarterly inflows since Q3 2020, as global equities had their worst quarterly performance since Q1 2020.”
You can see the scale of this from the following charts in tonne and dollars:
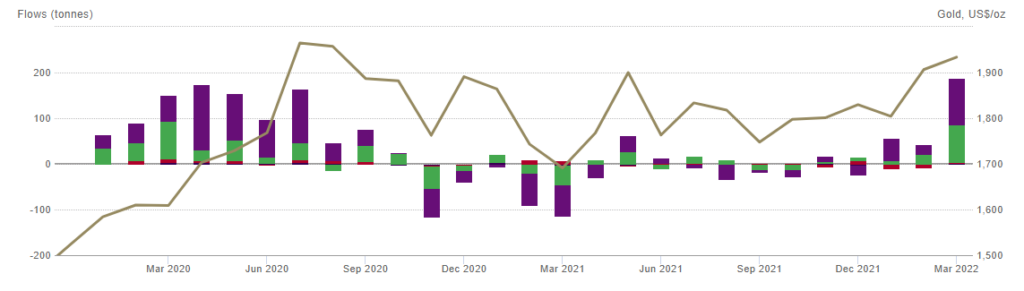
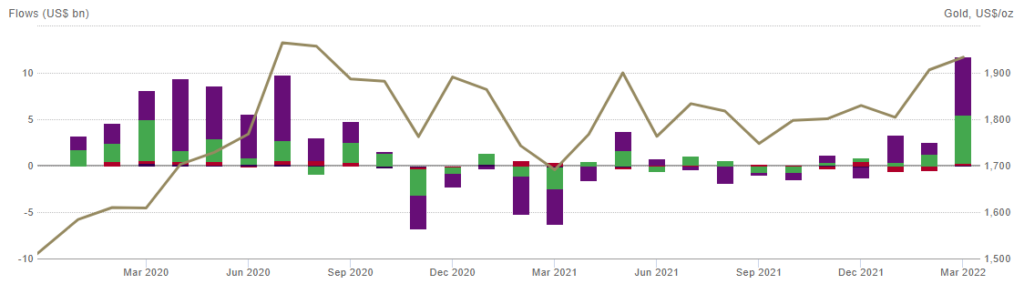
“Gold rose for the second consecutive quarter in Q1, ending 8% higher at US$1,942/oz – its best quarterly performance since Q2 2020. It was among the best performing assets amid significant weakness in both equity and bond markets. In a period marked by economic uncertainty and increased volatility, gold proved a reliable source of diversification and wealth preservation.
Gold’s Q1 performance was primarily driven by:
- rapidly rising inflation
- higher interest rates
- unexpected geopolitical risk.”
“The geopolitical situation remains an important driver for gold. A prolonged conflict in Ukraine will likely result in sustained investment demand. In contrast, a swift resolution, something which we all hope for, may see some tactical positions in gold unwind, but much like in 2020 we believe significant strategic positions will remain.
However, we believe that the opposing forces of inflation and rising rates will likely be the strongest influences on gold in Q2.
The post-COVID economic recovery and supply-side disruptions, which have been exacerbated by the Russia–Ukraine war, will likely keep inflation higher for longer.
Central banks have shown they are prepared to act. The Fed has begun to raise rates, following the Bank of England (BoE) which has now raised rates in the last three meetings. Even the European Central Bank (ECB), which has resisted growing calls to action, indicated a more hawkish stance at its most recent meeting. While our historical analysis shows that gold has typically performed well following the first rate hike in a tightening cycle, we believe gold may come under renewed pressure around the forthcoming Fed and ECB meetings.
But the war is also affecting the global economic recovery. This has recently prompted a number of ratings agencies – such as Fitch – to downgrade their 2022 growth forecasts. Widespread rising inflation expectations, low growth, and falling consumer confidence may further complicate central bankers’ policy decisions.
They have also reignited the fear of stagflation, an environment in which gold has historically performed well.”
Finally they noted “US Mint data shows that gold coin sales (American Eagle and Buffalo) totalled US$427mn (220,000oz) in March. This pushed Q1 total US gold coin sales to over US$1bn (518,000oz), the second highest Q1 sales total in volume terms since 1999 (Chart 4). This performance clearly shows that the strong retail interest in physical gold investment products from last year has continued into 2022.”
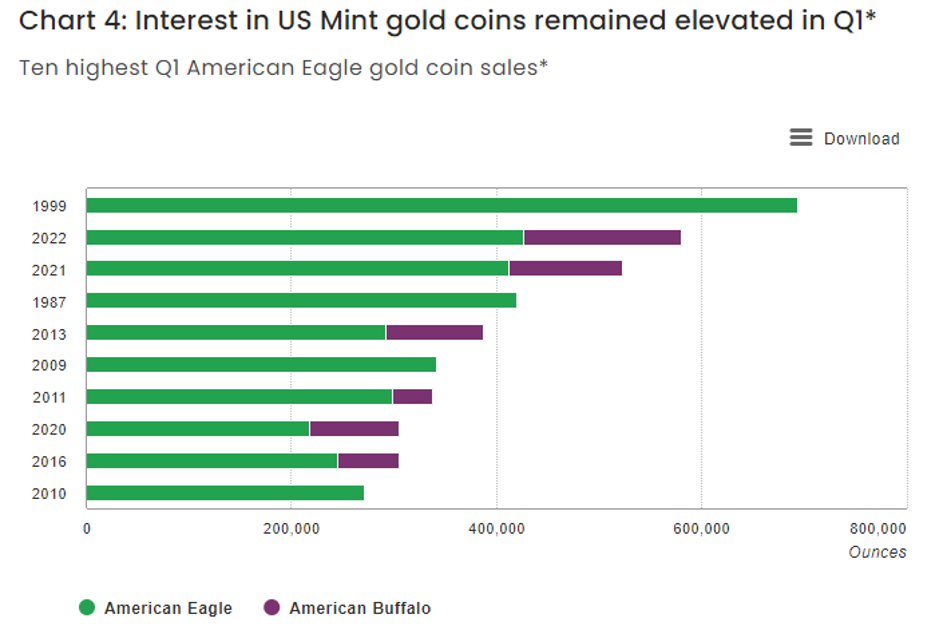
Because American Eagles are not pure they attract GST in Australia (10% extra you’ll never get back) and hence the Buffalos are the more popular here. Ainslie has the Buffalo for sale here…

I hope you have enjoyed this week’s report. If you would like to discuss investing through the share market or purchasing interest rate products, please do not hesitate to contact me.
Thank you to our friends at Ashurst for their April edition of Low Carbon Pulse.
Chris Hagan,
Head, Fixed Interest and Superannuation
JMP Securities
Level 1, Harbourside West, Stanley Esplanade
Port Moresby, Papua New Guinea
Mobile (PNG):+675 72319913
Mobile (Int): +61 414529814