26 April, 2022
Welcome to this week’s JMP Weekly Report
Hi and welcome to the JMP Report
Trading in the local bourse last week was very quiet mainly due to a short week with trades in three stocks only. BSP traded 8,143 shares closing at K12.10 along with STO trading 1,313 shares closing unchanged at K18.50. KSL on the other hand, traded 6,365 shares closing up 5 toea to K3.00. All other stocks reported nil trades.
WEEKLY MARKET REPORT | 19 April, 2022 – 22 April, 2022
| STOCK | QUANTITY | CLOSING PRICE | CHANGE | % CHANGE | 2021 FINAL DIV | 2021 INTERIM | YIELD % | EX-DATE | RECORD DATE | PAYMENT DATE | DRP |
| BSP | 8,143 | 12.10 | – | – | K1.3400 | – | 11.61 | THU 10 MAR | FRI 11 MAR | FRI 22 APR | NO |
| KSL | 6,365 | 3.00 | 0.05 | 1.69 | K0.1850 | – | 7.74 | THU 3 MAR | FRI 4 MAR | FRI 8 APR | NO |
| STO | 1,313 | 18.50 | – | – | K0.2993 | – | – | MON 21 FEB | TUE 22 FEB | THU 24 MAR | – |
| KAM | – | 1.00 | – | – | – | – | 10.00 | – | – | – | YES |
| NCM | – | 75.00 | – | – | USD$0.075 | – | – | FRI 25 FEB | MON 28 FEB | THU 31 MAR | – |
| NGP | – | 0.70 | – | – | – | – | – | – | – | – | – |
| CCP | – | 1.70 | – | – | – | – | 6.19 | – | – | – | YES |
| CPL | – | 0.95 | – | – | – | – |
– | – | – | – | – |
Dual listed stocks – close April 22, 2022
BFL – $4.85
KSL – $0.90
NCM – $28.29
STO – $8.15
Announcements – please feel free to contact me if you would like a copy of the announcement
BSP CEO Robyn Fleming’s – End of Contract
BSP Q1 results
BSP AGM Notice
KSL 2021 Annual Report
Santos Share Buy Back
STO Q1 Report
GIS auction 19th April
Interest Rates
The TBill market continued its downward spiral with very little stock on offer and aggressive bidding. The 364 rate average was 4.78%
Finance company money is also reflecting the lower rates with FIFL offering to buy 180day money at 1.80% and 12 month money at 4%.
And finally, the market saw both an announcement and successful holding of a GIS auction which was bid very aggressively. Less stock was issued than originally offered with the entire yield curve very aggressively bid The average for the 2yr was 6.50% and the 10yr at 7.90%.
What we’ve been reading this week
The 2022 Australian Federal Election and investors
Dr Shane Oliver, AMP Capital
Key points
Australian election campaigns tend to result in a period of uncertainty which have seen weak gains on average for shares followed by a bounce once it’s out of the way.
Labor is not offering a significantly different economic policy agenda than the Coalition. With the exception of climate policies, it’s hard to see a significant impact on investment markets from a change in government. A bigger risk would come from a hung parliament.
To return to decent and sustained real wage gains requires a productivity enhancing reform agenda. This election is unlikely to deliver much on this front.
The Australian Federal Election
The Federal political landscape has become somewhat less stable since the 2007 election with six changes in PM, “minority government” at times and a rise in the importance of independents. This has made sensible visionary long-term policy making harder. The last three and a half years have seen a bit more stability though with Scott Morrison being the longest servicing prime minister since John Howard. Policy uncertainty going into the 21 May election is lower than in 2019 as Labor is not offering starkly different policies to the Coalition this time.
Polls and betting markets
Polls give Labor a two-party preferred lead of around 54% to 46%, although the ALP’s primary support appears to have softened a bit since the election was called. Of course, overall polling needs to be interpreted cautiously as the ALP was ahead going into the 2019 election only to see the Coalition win. As my Canberra based colleague Al Kinloch points out, around 20% of people decide on election day and they often stick to what they know. It’s also less clear in the marginal seats which is what counts. Betting markets give roughly equal odds to both.
Elections, the economy & markets in the short term
There is anecdotal evidence that uncertainty around elections causes households and businesses to put some spending on hold. However, hard evidence of this is mixed and there is no clear evidence that election uncertainty effects economic growth in election years. In fact, since 1980 economic growth through election years averaged 3.5% which is greater than average growth of 3% over the whole period.
In terms of the share market, there is some evidence of it tracking sideways in the run up to elections, which may be because of uncertainty. The next chart shows Australian share prices around federal elections since 1983. This is shown as an average for all elections (but excluding the 1987 and 2007 elections given the 1987 global share crash and the start of the GFC in 2007), and the periods around the 1983 and 2007 elections, which saw a change of government to Labor, and the 1996 and 2013 elections, which saw a change to the Coalition. The chart suggests some evidence of a period of flat lining in the run up to elections followed by a relief rally.
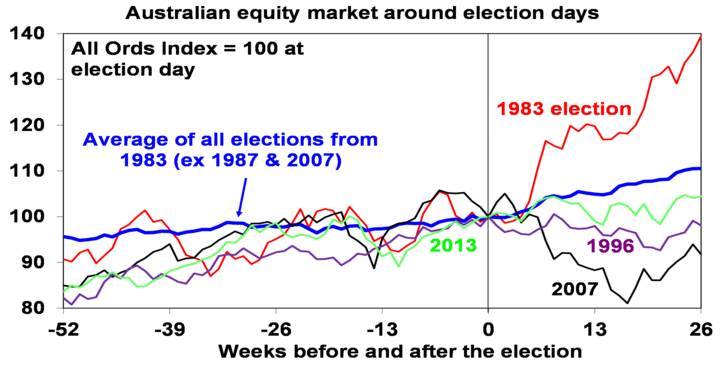
Source: Reuters, Bloomberg, AMP
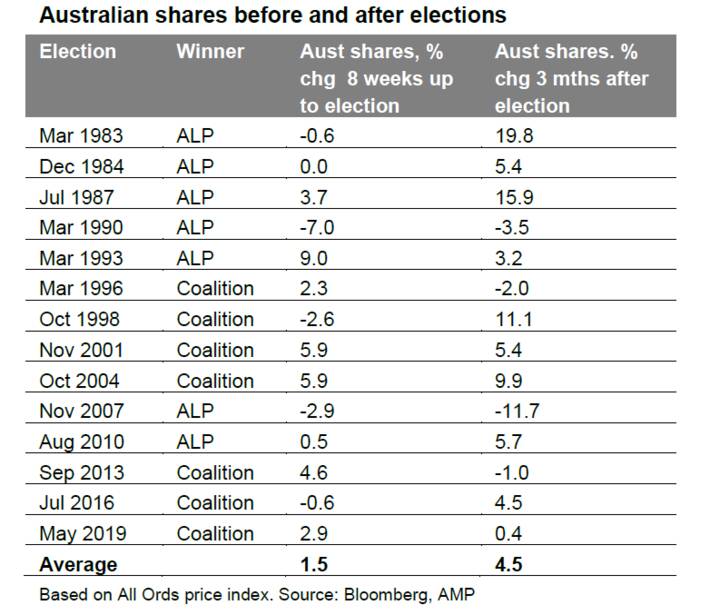
However, the elections resulting in a change of government have seen a mixed picture. Shares rose sharply after the 1983 Labor victory but fell sharply after their 2007 win, with global developments playing a role in both. After the 1996 and 2013 Coalition victories shares were flat to down. So based on history it’s not obvious that a victory by any one party is best for shares in the immediate aftermath, and historically moves in global shares played a bigger role than the election outcome. The next table shows that 10 out of the 14 elections since 1983 saw shares up 3 months later with an average 4.5% gain.
The next chart shows the same analysis for the Australian dollar. In the six months prior to Federal elections there is some evidence the $A experiences a period of softness and choppiness, which is consistent with policy uncertainty, but the magnitude of change is small. On average, the $A has drifted sideways to down slightly after elections, but it’s very messy.
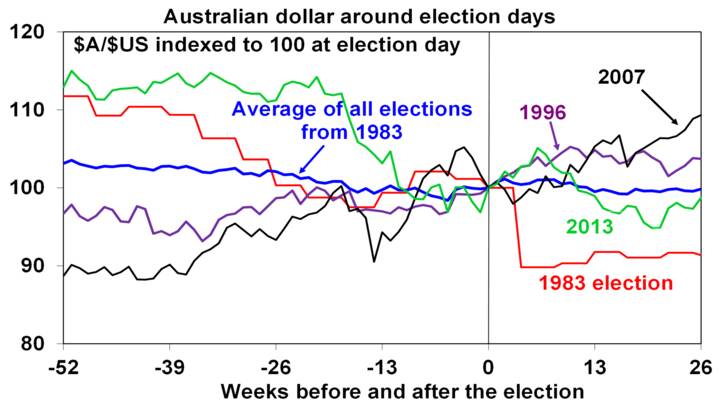
Source: Reuters, Bloomberg, AMP
Shares & property under Coalition & ALP governments
Over the post-war period shares have returned (capital growth plus dividends) 13% pa under Coalition governments and 10% pa under Labor governments. It may be argued that the Labor governments led by Whitlam in the 1970s and Rudd and Gillard had the misfortune of severe global bear markets. And the economic rationalist and reformist Hawke/Keating government defied conventional perceptions that conservative governments are better for shares. Over the Hawke/Keating period from 1983 to 1996 Australian shares returned 17.2% pa.
Looking at the Australian residential property market, using CoreLogic data since 1980, capital city property prices have risen 6.6% pa under Coalition governments and 5.2% pa under Labor. That said, policies with respect to housing have not been particularly different under both sides of politics.
Once in government, political parties are usually forced to adopt sensible policies if they wish to ensure rising living standards and arguably there has been broad consensus in recent decades regarding key macro-economic fundamentals – eg, low inflation and free markets. So ultimately economic and interest rate cycles have a dominant impact on investment markets rather than specific policies under each government.
Economic policy differences in this election
The policy differences this time around are a non-event compared to the more left-wing reconstruction Labor proposed in the 2019 election, which offered the starkest choice seen since the 1970s. In the 2019 election, the ALP offered a radically different policy agenda focussed on a significant increase in the size of government (particularly via more spending on health and education) financed by a significant increase in taxation. The latter included a 2% tax increase for high income earners, restricting negative gearing to new residential property, halving the capital gains tax discount, stopping cash refunds for excess franking credits and a 30% tax on distributions from discretionary trusts. Following its defeat at that election, with the tax agenda taking much of the blame, the ALP has adopted a less left leaning agenda going into this election.
Oddly enough we have ended up with bigger government anyway with a huge surge on the back of pandemic spending and the March Budget projecting that Federal spending will settle at around 26.5% of GDP from 2025 onwards due to higher spending on health, the NDIS, the aged and defence. This is well above the pre-covid average of 24.8%. In the meantime, the budget deficit is much higher, even after pandemic spending is wound down.
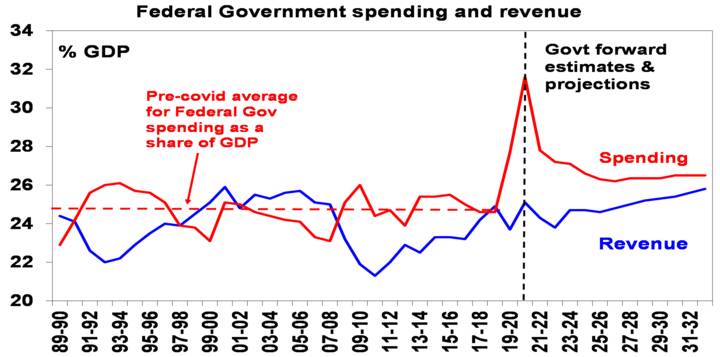
Source: Australian Treasury, AMP
There are some economic policy differences. Labor is likely to:
- Be more interventionist in the economy.
- Boost public services including childcare and the aged.
- Introduce “portable” entitlements for workers in insecure jobs funded by a levy on employers, whereas the Coalition remains committed to its blocked industrial relations reform bill from last year aimed at revitalising enterprise bargaining.
- Allow the tax to GDP ratio to rise above the Coalition’s self-imposed 23.9% limit and to rely even more on this to reduce the budget deficit, even though it’s committed not to increase taxes or introduce new taxes other than increased tax on multinationals. By contrast, once the cap is reached the Coalition would have to focus more on spending cuts.
- Tighten decarbonisation commitments with a faster reduction in emissions by 2030 – with a 43% cut below 2005 levels compared to a 26-28% cut under the Coalition.
However, these differences are relatively minor compared to the policy platform offered by Labor in 2019. The similarities are more noticeable. Like the Coalition, the ALP is largely seeking to repair the budget through economic growth rather than austerity and its priority areas of energy, skills, the digital economy, childcare & manufacturing have a significant overlap with the Coalition. So, while there may be a little more nervousness in investment markets about Labor, it’s hard to see a big impact on markets if there is a change in government.
Challenges for the next government
The main economic challenges the winner will face include:
- Getting the budget deficit back under control – the Budget does not see a return to surplus for the next decade at least. At some point, tough decisions will be needed to either reduce spending or raise taxes as a share of GDP.
- Boosting productivity growth – this has been flagging as the payoff from the 1980s to early 2000s reforms wane. Without productivity enhancing reforms, it’s hard to see it averaging the 1.5% pa implied in longer-term Budget assumptions. This will mean waning growth in living standards, possibly even higher inflation and weak real wages growth. Neither side is proposing significant productivity enhancing reforms in key areas like tax, education, industrial relations and competition.
- Housing affordability – this has been deteriorating for two decades, impacting productivity and intergenerational & income equity. But serious reforms to address it are lacking.
Concluding comment
The relatively modest difference in economic policies between the Coalition and Labor suggests minimal impact on investment markets if there is a change of government. The main risk for investment markets may come if neither the Coalition or Labor win enough seats to govern, forcing a reliance on minor parties or independents, which could force a new government down a less business friendly path (such as the Greens demanding an ALP led minority government implement their proposed super profits taxes) – although the Senate may act as a brake on this.
Global decarbonization is a more than $50 trillion opportunity for private capital: Blackstone

Robert Walton Reporter
Fotolia
Dive Brief:
- Global decarbonization efforts over the next three decades will require a $100 trillion investment, generating a massive opportunity for private equity to deploy capital and drive the energy transition, according to Rob Horn, a senior managing director and global head of the sustainable resources group at Blackstone Credit.
- “Frankly, every kind of capital is going to be needed,” Horn said Wednesday at the BNEF Summit. “But credit is going to be required for well-north of half of that capital.”
- Private investment will play a vital role, along with public funds and good tax policies, said John Morton, climate counselor to the U.S. Department of the Treasury. In some markets where clean energy options are cost-competitive “it’s no longer a case that public funds or public development finance institutions need to be funding the renewable buildout,” he said.
Dive Insight:
The International Energy Agency last year estimated that reaching global net-zero emissions by 2050 will require an annual investment of around $4 trillion by 2030. The capital-intensive nature of the energy sector opens the door for private equity to make long-term investments with predictable payoffs, said Horn.
“We’re investing in really capital intensive industries that have historically consumed credit,” Horn said, including the natural resources needed for battery production, commercial and residential solar, and energy efficiency.
Blackstone, a global investment business, has deployed roughly $15 billion in energy transition investments over the last couple of years, he said, and expects to deploy at least $100 billion more over the next decade.
“There is really a distinct advantage in the private markets when you are thinking about outcomes that you’re trying to drive, such as decarbonization,” said Jean Rogers, a senior managing director who oversees Blackstone’s corporate environmental, social and governance team.
Rogers contrasted private investment strategies — which can peg loans to decabonization, efficiency, renewable energy or equity outcomes — with ESG-focused public market vehicles like exchange-traded funds.
Those public market products “are not actually decarbonizing the world. They might be decarbonizing your portfolio, but that’s a big difference,” Rogers said. Companies are beginning to realize that to actually manage the systemic risk of climate change “we need to decarbonize, which means we don’t need the passive strategies that just track a benchmark. We need active concentrated private market strategies where you can actually bring that carbon down.”
About 90% of the world’s gross domestic product and 40% of global assets under management are now covered by net-zero commitments by mid-century, said Morton, the Treasury Department’s climate advisor. And a lot of those must be met through energy sector transition, he said.
“We now see that in many markets — not all, but in many markets — private capital can drive the renewable energy deployment,” Morton said. “It’s often a case of getting the regulations and the policy right, and then the markets can take over.”
As clean energy solutions are becoming more economical, “we are seeing [an] alignment of policy and private capital commitments that would have been unfathomable just a couple of years ago,” Morton said.
That means the government can consider turning public funds towards “some of these thornier, hairier issues related to expedited closure of assets,” Morton said. “Oftentimes, you will find that taking something offline gets you as high, if not higher, bang for the buck than building something new.”
The U.S. government is now working, alongside the U.K., France, Germany and other nations on a financing package to help South Africa decarbonize, said Morton. That country’s energy system is bankrupt and will need help transitioning away from coal, and the nations hope to have something finalized in the next few months.
Similar models could also be used in countries like Indonesia, Vietnam and India, Morton added. “We’ve been working with all of those countries.”
For South Africa, Morton said the initial funding package is expected to be around $8.5 billion, “and that does not speak to the private capital that would be mobilized on the back of the structures that we hope to put in place.”
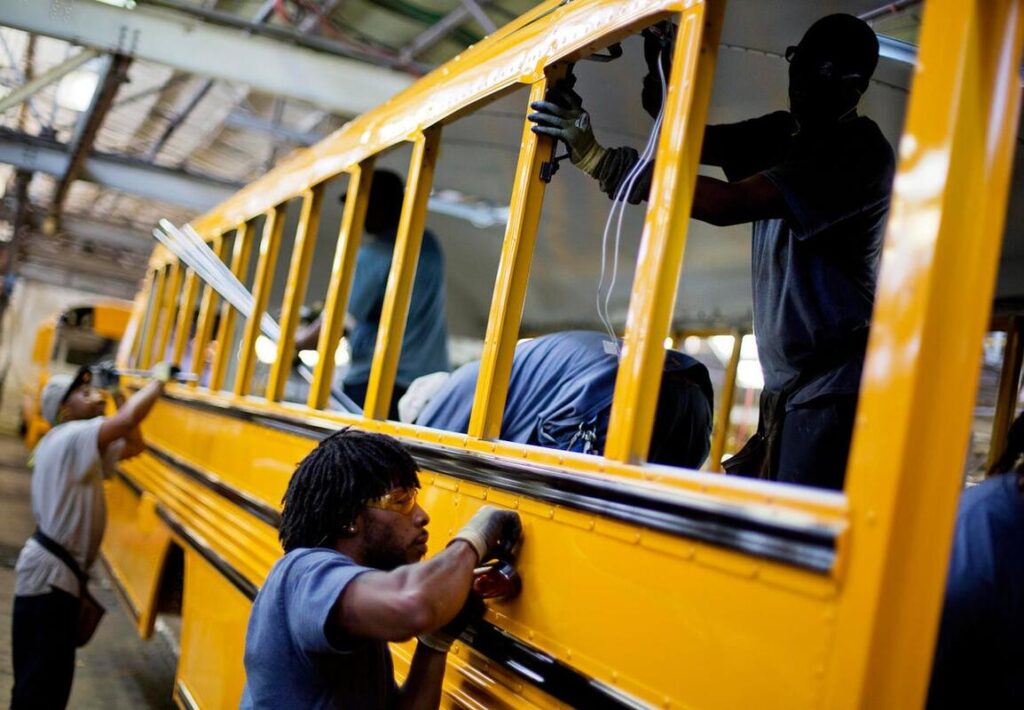
The $150 Billion Road Electric School Buses Can Ride to Create American Jobs
Israel Hurtado is an Influencer
The $150 Billion Road Electric School Buses Can Ride To Create American Jobs And Protect Kids’ Health
“Anyone who has gone to school in the United States remembers the smell of diesel exhaust from riding the iconic yellow school bus, but few realize the danger of breathing those fumes.
Thankfully, our children can ride pollution-free, all-electric buses that don’t cause asthma or harm brain development – and electrifying our school bus fleet is worth billions to American manufacturing. The electric school bus transition is accelerating across the country.
California’s Modesto City Schools recently placed the largest electric bus order in history, Boston is switching its 700 school buses to electric, and New York just passed a bill to electrify its statewide school bus fleet by 2035.
And more schools can plug in thanks to the bipartisan Infrastructure Investment and Jobs Act’s (IIJA) $5 billion for clean school buses.
The school bus is a uniquely North American phenomenon, spurring home-grown manufacturing and new jobs. New manufacturing plants are opening this year in Illinois, adding 1,400 jobs, and in West Virginia’s coal country, adding 900 jobs. But just 1% of existing school buses are electric, and U.S.-based school bus manufacturer Blue Bird estimates transitioning the entire American fleet represents a $150 billion dollar manufacturing opportunity.
Meanwhile, school districts are spending just 14 cents per mile on their electric buses compared to 49 cents per mile for diesel buses. We have the technology to electrify America’s school buses, but delivering all the health and economic benefits of electric buses requires bolder state goals, dedicated funding, and smart planning” Protecting our kids is a no brainer Every morning, nearly half a million school buses transport about 20 million children to school, traveling about 3.4 billion miles per year.
Most of these buses run on diesel, exposing children to toxic air pollution inside the bus for the ride’s duration. Diesel-powered vehicles like school buses emit high levels of dangerous particulate matter, which impedes brain development and is associated with lower academic achievement in children.
Ironically, children’s ability to process and remember information may be harmed on the way to school if traveling on a diesel bus” Diesel engines also emit greater amounts of nitrogen oxides (NOx) at slower speeds, like school buses do when driving through neighborhoods.
Regular NOx exposure causes asthma in children, while short-term exposure can trigger asthma attacks, a leading cause of missed school days for children that disproportionately impacts children of color. Columbia University found a single electric bus reduces human health costs by $150,000 per year, while the American Lung Association estimates transitioning all of New York’s buses to clean vehicles would generate $68.2 billion in public health benefits”
I hope you have enjoyed the read this week, I apologise that there was no report for last week, comms issues and new devices made it difficult to push out the report in a timely manner. As noted earlier in the report, if you would like a copy of the market announcements, please feel free to inbox me.
Have an awesome week,
Chris Hagan.
Head, Fixed Interest and Superannuation
JMP Securities
Level 1, Harbourside West, Stanley Esplanade
Port Moresby, Papua New Guinea
Mobile (PNG):+675 72319913
Mobile (Int): +61 414529814