09 May, 2022
Welcome to this week’s JMP Weekly Report
Trading in the local bourse last week saw trades in BSP, CCP and KSL. BSP traded 3,410,000 shares closing up by 0.10 to close at K12.40 on Friday last week along with CCP trading a total of 15,195 shares closing up 0.10 toea to close at K1.70 per share. KSL exchanged small volume of 891 shares closing unchanged at K3.00 per share.
WEEKLY MARKET REPORT | 02 May, 2022 – 06 May, 2022
| STOCK | QUANTITY | CLOSING PRICE | CHANGE | % CHANGE | 2021 FINAL DIV | 2021 INTERIM | YIELD % | EX-DATE | RECORD DATE | PAYMENT DATE | DRP | MARKET CAP |
| BSP | 3,410,000 | 12.40 | 0.10 | 0.81 | K1.3400 | – | 11.61 | THU 10 MAR | FRI 11 MAR | FRI 22 APR | NO | 5,270,833,466 |
| KSL | 891 | 3.00 | – | – | K0.1850 | – | 7.74 | THU 3 MAR | FRI 4 MAR | FRI 8 APR | NO | 67,052,337 |
| STO | 0 | 18.50 | – | – | K0.2993 | – | – | MON 21 FEB | TUE 22 FEB | THU 24 MAR | – | – |
| KAM | 0 | 1.00 | – | – | – | – | 10.00 | – | – | – | YES | 49,891,306 |
| NCM | 0 | 75.00 | – | – | USD$0.075 | – | – | FRI 25 FEB | MON 28 FEB | THU 31 MAR | – | 33,774,150 |
| NGP | 0 | 0.70 | – | – | – | – | – | – | – | – | – | 32,123,490 |
| CCP | 15,195 | 1.70 | 0.10 | 6.25 | – | – | 6.19 | – | – | – | YES | 492,690,131 |
| CPL | 0 | 0.95 | – | – | – | – |
– | – | – | – | – | 195,964,015 |
Our order book this week has us net buyers of stock but we do have orders on both sides so please feel free to give me a call on our equity book and if you wish to purchase Tap Bonds Tap Bills or TBills.
Interest rates
Given the aggressive bidding on interest rate products, one needs to seriously look at their current weighting to equities. When we are looking at dividends far higher than interest rates, a review of the portfolio would be advisable.
Dual listed stocks
BFL – $4.90 steady
KSL – $0.88 +.05
NCM – $26.27 -.37c
STO – $8.13 – .12c
PNGX announcments
STO AGM – Santos AGM Results Announcement
Interest Rates
On the interest rate front, Treasury Bills continue to be bid down aggressively with the 364day TBill auction average last week was 4.36% down from an average of 4.60% last week. There were no indications on the next GIS auction.
You may also be interested in;
Gold Standard $US60.46 ( Down $0.07 / 0.13%) $AU84.85 ( Up $1.28 / 1.53%)
Silver Standard $US0.72 ( Down $0.01 / 1.36%) $AU1.01 ( Up $0.01 / 1.00%)
Bitcoin $US36,318 ( Down $3385 / 8.52%) $AU50,972 ( Down $3836 / 6.99%)
Ethereum $US2738 ( Down $185 / 6.32%) $AU3842 ( Down $193 / 4.78%)
Litecoin $US97.61 ( Down $8.15 / 7.70%) $AU136.99 ( Down $9 / 6.16%)
Ripple $US0.59 ( Down $0.05 / 7.81%) $AU0.828 ( Down $0.055 / 6.22%)
Bitcoin Cash $US277 ( Down $18 / 6.10%) $AU388 ( Down $19 / 4.66%)
Theta $US2.26 ( Down $0.3 / 11.71%) $AU3.171 ( Down $0.362 / 10.24%)
Tron $US0.07 ( Down $0.01 / 12.50%) $AU0.098 ( Down $0.012 / 10.90%)
Cardano $US0.78 ( Down $0.11 / 12.35%) $AU1.094 ( Down $0.134 / 10.91%)
Stellar $US0.17 ( Down $0.01 / 5.55%) $AU0.238 ( Down $0.01 / 4.03%)
Chainlink $US10 ( Down $2 / 16.66%) $AU14 ( Down $2 / 12.50%)
Matic $US1.05 ( Down $0.11 / 9.48%) $AU1.47 ( Down $0.13 / 8.12%)
Attachments
Thank you to our friends at ashurst for their latest edition of Low Carbon Pulse
What we’ve been reading this week
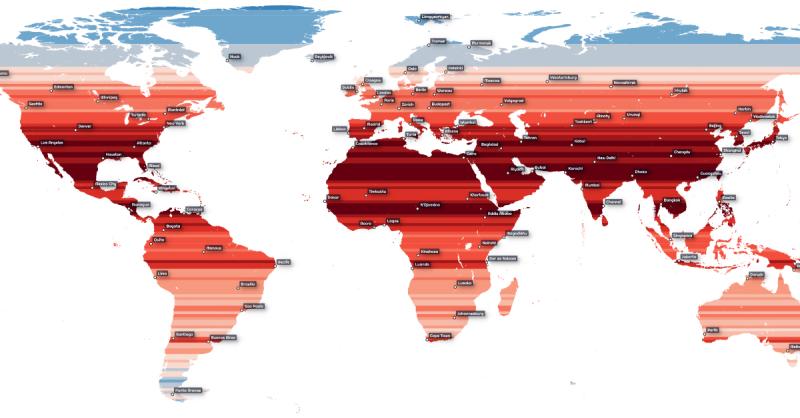
The World’s Population Density by Latitude
When you think about areas with high population densities, certain regions spring to mind. This could be a populous part of Asia or a cluster of cities in North America or Europe.
Usually, density comparisons are made using cities or countries, but this map from Alasdair Rae provides another perspective. This world map depicts population density by latitude, going from the densest populated coordinates in deep red to the sparsest in light blue.
Why Certain Latitudes (and Regions) Are More Densely Populated
Numerous factors affect an area’s population density. These can range from topography, or the physical terrain characteristics of the place, to more direct factors like an area’s climate, which can impact both the survivability and agricultural potential.
Political, economic, and social factors are also at play—for example, there is a natural lack of livelihood opportunities in sparse areas such as the Amazon rainforest or the Himalayas.
High-resolution version
Breaking down the population by latitude, we see the population becomes more concentrated near the equator. In particular, the 25th and 26th parallel north are the most densely populated latitude circles. Around 279 million people reside in these latitude lines, which run through large countries like India, Pakistan, Bangladesh, China, the United States, Mexico, and others.
Despite their large landmasses, many of these countries do not themselves have very high population densities. Since density measures the ratio of people to physical space, countries with vast but sparse regions like China and India are less dense than imagined.
Out of the top 10 most densely populated countries in the world, only a couple can be found on the 25th and 26th parallel north—Bangladesh and Bahrain. For a size comparison, Bangladesh is 1.55% the size of China, and Bahrain is only 0.01%.
The Future of Population Density Near the Equator
Looking ahead to 2100, the UN projects that the global population will rise to almost 11 billion. This would increase global population density from 59.11 people per square kilometre in 2022 to 80.82 per square kilometre in 2010.
However, the projections show that Asia will not be the biggest contributor to this growth. Instead, the most considerable jump in population is predicted for Africa, set to grow by almost 200% from almost 1.5 billion people today to 4.3 billion in 2100.
The equator runs right through the middle of Africa and criss-crosses countries like the Congo (both the Republic and DRC), Kenya, Gabon, Uganda, and Somalia.
As Africa’s population expands, this means that at latitudes near the equator, there could be even higher population densities coming. Or course, this largely depends on how the world’s fastest growing cities—most of which are in Africa—shape up over the coming decades.”
#populationdensity #latitude
Mapped: The World’s Population Density by Latitude
Mining Impacts Across the Ok Tedi & Fly River Floodplains
HOWARD ROGERS & BEGA INAHO
BY ROY · MARCH 11, 2022
The flood plains of the Ok Tedi and Fly River extend over approximately 3,500 km2 and from the air appear to be an uninhabited wilderness of intact forests, woodlands and swamps. However, natural resources of the riverine landscape support several small, but remote, subsistence communities that are dependent upon the landscape for their livelihoods and wellbeing. The forests, woodlands and swamps provide numerous essential materials for house construction, trees to make dugout canoes, medicinal and food plants, household items, hunting tools and fibres to weave traditional bags and mats.
The extensive lagoons and waterways provide an abundance of food for communities including native barramundi, black bass, catfish, freshwater prawns, an overwhelming abundance of the introduced tilapia and freshwater and saltwater crocodiles. Grasslands support substantial populations of game including bandicoots, wallabies and the invasive rusa deer that have spread from West Papua. The game provides an important source of local protein and income with deer meat and fish being traded across the border.
The Fly River system provides for an important transport route throughout the floodplain. In addition to the daily movements of dugout canoes, the main channel provides an essential transport route for copper concentrate from the giant Ok Tedi mine and general freight to Kiunga, the main river port of Western Province, located approximately 550 km inland.
The Ok Tedi mine is located in the Star Mountains at the head waters of the Ok Tedi, a major tributary that joins the Fly River thirty-two km downstream of Kiunga. The mine has been a success for the nation in generating revenue and employment of skilled Papua New Guineans, however, ongoing operations since the 1980s have progressively increased its footprint on the environment across the lower Ok Tedi and middle Fly River floodplains. This has impacted over 1,150 km2 of forests and woodlands.
The open-cut copper mine produces an average of 60,000 tonnes per day of ore and a peak of 240,000 tonnes a day of overburden. Associated with this has been an increase in sediment load in the Ok Tedi rising from a natural load of 3–5 megatons per year to a mine impacted load of 45 megatons per year from 1985 to 2000. Riverine waste rock and tailing disposal was approved in 1994 by the PNG government after the failure of the foundations of a proposed tailings storage facility. Between the commencement of riverine waste disposal in 1984, and the end of 2019, 754 megatons of tailings and 1,275 megatons of waste rock have been discharged to the river system.

Melaleuca dieback
Much of this waste is retained in the upper reaches of the Ok Tedi however the finer particles are transported down the river and, if unmitigated, into the Fly River. Over the same period the ongoing tailings disposal and losses from the erodible dumps resulted in considerable riverbed aggradation and associated overbank flooding of the lower Ok Tedi and Fly River floodplains. This change to the natural flood regime resulted in higher frequency duration of flooding and subsequent forest dieback that was first observed at Iogi in the lower of Ok Tedi in 1992 and progressed downstream into the middle Fly from 1996 and continues today.
The decline in forest and woodland health is attributed to flooded anaerobic soils, depleting oxygen uptake by roots and microorganisms resulting in root death followed by canopy dieback and eventually tree mortality. This process is exacerbated by increases in the duration of flooding due to the deposition of sediment at the mouth of the tie-channels and on levee banks, which prevents floodplain water from draining out.
As a major mitigation project for riverbed aggradation and forest dieback a dredging operation was commissioned in the lower Ok Tedi in 1998 to reduce sediment loads reaching the lower Ok Tedi and the Fly River systems. The dredge removes ten million cubic metres of sand annually which comprises approximately 60% of the sediment load while the remaining 40% of silt material which cannot be captured by the dredge enters the lower Ok Tedi and Fly.
After two decades of dredging costing over US$55 million per annum the riverbed levels have reduced by two to four metres in the lower Ok Tedi and have stabilised throughout the middle Fly.
Riverbank flooding and the associated first die back have decreased compared to the 1996/97 period and recovery of some forest species has been observed in the lower Ok Tedi and upper Fly River. Forest and woodland dieback are expected to continue at a slower rate. Dredged sand is stored in engineered stockpiles on the east and west banks at Bige covering 1000 ha of land that had been impacted by the dieback. Completed sections of the stockpile are being progressively rehabilitated to forest with native species and early monitoring results have indicated a positive trajectory towards a self- sustaining vegetation.
Dieback monitoring across the floodplain was implemented in the 1990s using satellite imagery. However, it was not until 2017 that widespread, detailed field studies were undertaken to understand the impact of changes in the flood regime on the forests and woodlands. From 2017 to 2019 an extensive monitoring system was established incorporating the use of transect and unbounded plots to monitor stressed and healthy forests and woodlands. Transect establishment included the permanent tagging of all live trees for re-measurement to monitor changes to stand structure and tree health. Unbounded plots were established to monitor species changes in all plant life forms from ground layer to emergent trees including epiphytes and climbers. Of the 1,150 km2 of the impacted forests and woodlands that were mapped in 2018, 70% is alluvial forest and over 12% is inundated, low lying hill forest, 8% is swamp woodland 5% is low lying seasonal forest and the remaining 5% is mostly successional forest and mixed swamp woodland swamp/grass land.
Field work in such a remote area is logistically and physically challenging. A dedicated liveaboard research vessel, the Fly Explorer, motorised dinghies and sea kayaks are used to conduct the studies. All work is undertaken with prior agreement of local landowners who are often engaged to assist with navigation and transect establishment. Frequently, transects were established and measured from sea kayaks by the field team that have been trained in basic sea kayak skills and rescue procedures. The use of sea kayaks to survey and establish vegetation monitoring transects in the flood plains is probably a first in PNG.
In some areas, impacts have been severe with the conversion of tall and diverse alluvial forest to lagoons and swamps grasslands, evidenced by the presence of trees stumps near the surface. Alluvial forest, although subject to a natural flooding cycle in the wet season, appears to be the most susceptible to the increased frequency and duration of flooding. Approximately 1000 km2 of alluvial forest have succumbed to dieback with only occasional stands remaining in a highly stressed dieback condition. The main exception to this is in the lower Ok Tedi where alluvial forest had been subject to severe dieback but is now partly recovering to form a secondary forest, currently dominated by pioneer species and Pandanus.
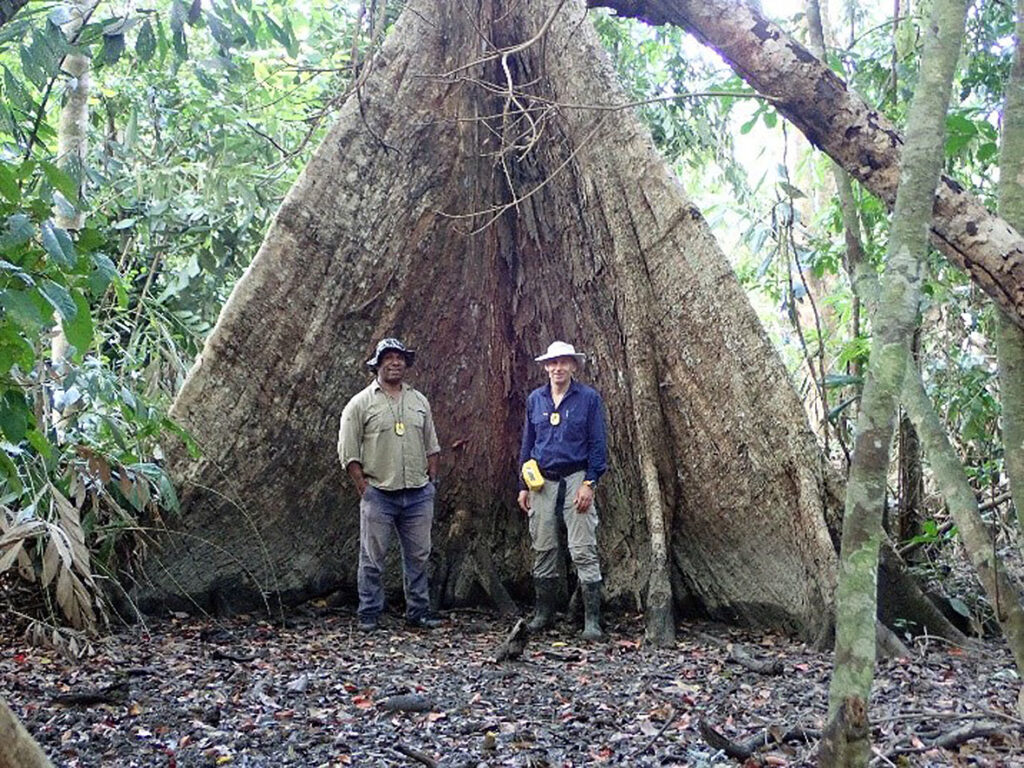
Benjamin Kelambua, botanist, and Howard Rogers in lower Fly non-impact area
Recovery is occurring as a result of the dredging operation. Impacts are also evident in the Melaleuca dominated swamps woodlands which occur in low-lying basins and at the fringes of seasonal forest. Melaleuca woodlands are adapted to seasonal flood cycles but are still susceptible to prolonged flooding. When stressed numerous trees show dieback in the crowns or have died but species diversity is less impacted. At the fringes of the Melaleuca stands extensive lowlying plains of tall, large-diameter Leptospermum suaveolens occur before seasonal forest dominates. The expansion of the flood impacted area is currently causing uproots of the largest Leptospermum with increased waterlogging. Low lying seasonal forests have also been impacted where previous flooding events were not part of the natural disturbance regime. Emergent and canopy trees do not survive, however, understory species respond with extensive adventitious roots reflecting long duration of flood levels.
The extent of forest decline is expected to continue with the ongoing operations of the mine. The affected communities and the government are aware of, and receive, compensation for these impacts. Ok Tedi Mining Limited (OTML) has established compensation agreements with 158 affected communities under its Community Mine Continuation Agreement (CMCA).
In 2020 OTML paid 44 million kina in compensation and 816 million kina since the start of CMCA in 2001. The company engages the Ok Tedi Development Foundation, a subsidiary of the mine, and works closely with the Fly River Provincial Government to support community livelihood and wellbeing through sustainable development programs.
OTML is committed to maintaining the monitoring program in the flood plains and to extend the study to incorporate hyper-spectral data from satellites to classify vegetation types to better understand the important terrestrial flora and fauna resources for river dependent villages. This will help understand the dynamics of forests and woodlands and changes that the availability of associated key flora/fauna resources are having on community wellbeing and livelihoods.
Editor’s Note: This story was first published in Commonwealth Forestry Association Newsletter, No. 94, September 2021. The photos were generously provided by Howard Rogers and Bega Inaho.
ADB Annual Report
In 2021, ADB committed $22.8 billion in loans, grants, equity investments, guarantees, and technical assistance to governments and the private sector. This was enabled by our second-largest borrowing program ever which raised $35.8 billion through capital markets. We sold a record volume of thematic bonds, issuing education bonds and blue bonds for ocean health for the first time. Through our strong partnerships we mobilized an additional $12.9 billion in co-financing.
Of ADB’s commitments, $13.5 billion was for COVID-19 response, including $4.1 billion to help DMCs procure and deliver safe and effective vaccines. We also provided substantial support to ease the budgetary constraints faced by governments, and invested heavily in education, public health, and social protection throughout the region.
In 2021, ADB took big steps toward realizing its aspiration to be Asia and the Pacific’s climate bank.
We elevated our climate financing target to $100 billion in cumulative financing by 2030 and announced a series of financing partnerships, such as the Energy Transition Mechanism, to help achieve this target.
Learn more about how ADB is battling climate change in our #ADBAnnualReport: http://ow.ly/mQkW50IT7UK
I hope you enjoy the read, have an awesome week and I look forward to assisting you on your investment journey.
Regards,Chris Hagan.
Head, Fixed Interest and Superannuation
JMP Securities
Level 1, Harbourside West, Stanley Esplanade
Port Moresby, Papua New Guinea
Mobile (PNG):+675 72319913
Mobile (Int): +61 414529814