16 May, 2022
Welcome to this week’s JMP Weekly Report
Trading in the local bourse was quite active last week. KSL traded 13,607 shares closing unchanged at K3.00 on Friday, KAM traded 3,595 shares closing unchanged at K1, NCM traded 74 shares closing unchanged at K75 along with CPL trading 5,373 shares closing unchanged at K0.95. CCP traded 10,000 shares closing up 0.12 toea to close at K1.82 per share on Friday whilst BSP traded 3,535 shares closing down 0.10 toea to close at K12.30.
WEEKLY MARKET REPORT | 09 May, 2022 – 13 May, 2022
| STOCK | QUANTITY | CLOSING PRICE | CHANGE | % CHANGE | 2021 FINAL DIV | 2021 INTERIM | YIELD % | EX-DATE | RECORD DATE | PAYMENT DATE | DRP | MARKET CAP |
| BSP | 3,535 | 12.30 | -0.10 | -0.81 | K1.3400 | – | 11.61 | THU 10 MAR | FRI 11 MAR | FRI 22 APR | NO | 5,270,833,466 |
| KSL | 13,607 | 3.00 | – | – | K0.1850 | – | 7.74 | THU 3 MAR | FRI 4 MAR | FRI 8 APR | NO | 67,052,337 |
| STO | 0 | 18.50 | – | – | K0.2993 | – | – | MON 21 FEB | TUE 22 FEB | THU 24 MAR | – | – |
| KAM | 3,595 | 1.00 | – | – | – | – | 10.00 | – | – | – | YES | 49,891,306 |
| NCM | 74 | 75.00 | – | – | USD$0.075 | – | – | FRI 25 FEB | MON 28 FEB | THU 31 MAR | – | 33,774,150 |
| NGP | 0 | 0.70 | – | – | – | – | – | – | – | – | – | 32,123,490 |
| CCP | 10,000 | 1.82 | 0.12 | 7.06 | – | – | 6.19 | – | – | – | YES | 492,690,131 |
| CPL | 5,373 | 0.95 | – | – | – | – |
– | – | – | – | – | 195,964,015 |
BFL $4.96 +.06
KSL $.86 0.2
NCM – $24.58 $1.85
STO – $8.05 steady
Interest Rates
On the interest rate front, Treasury Bills continue to be bid down aggressively with the 364day TBill auction average last week was 4.00% down from an average of 4.36% last week. There were no indications on the next GIS auction.
Our order book this week has us net buyers of stock but we do have good buy orders for BSP. Please feel free to give me a call on our equity book and if you wish to purchase Tap Bonds Tap Bills or TBills.
You may also be interested in
AUD/USD 0.6861
Gold Standard $US58.47 ( Down $1.14 / 1.91%) $AU85.22 ( Down $0.64 / 0.74%)
Silver Standard $US0.66 ( Down $0.03 / 4.34%) $AU0.96 ( Down $0.03 / 3.03%)
Bitcoin $US28,370 ( Down $455 / 1.57%) $AU41,349 ( Down $173 / 0.41%)
Ethereum $US1893 ( Down $187 / 8.99%) $AU2759 ( Down $237 / 7.91%)
Litecoin $US61.92 ( Down $5.45 / 8.08%) $AU90.24 ( Down $6.8 / 7.00%)
Ripple $US0.37 ( Down $0.04 / 9.75%) $AU0.539 ( Down $0.051 / 8.64%)
Bitcoin Cash $US190 ( Down $3 / 1.55%) $AU276 ( Down $2 / 0.71%)
Theta $US1.16 ( Down $0.18 / 13.43%) $AU1.690 ( Down $0.24 / 12.43%)
Tron $US0.06 ( Down $0.01 / 14.28%) $AU0.087 ( Down $0.013 / 13.00%)
Cardano $US0.45 ( Down $0.06 / 11.76%) $AU0.655 ( Down $0.079 / 10.76%)
Stellar $US0.11 ( Down $0.01 / 8.33%) $AU0.160 ( Down $0.012 / 6.97%)
Chainlink $US6 ( Up $0 / 0.00%) $AU8 ( Up $0 / 0.00%)
Matic $US0.57 ( Down $0.09 / 13.63%) $AU0.83 ( Down $0.12 / 12.63%)
What we’ve been reading this week
Another five great charts on investing that are very useful in times of uncertainty like the present
Dr Shane Oliver
Successful investing can be difficult in times of uncertainty like now making it important to stay
Here are another five great charts to help illuminate those basic principles: the importance of time in the market versus timing; the case to look less at your investments; the relationship between risk and return; the value of diversification; & the role of property.
Introduction
Successful investing can be hard in times like the present when share markets are down sharply & very volatile on the back of uncertainty around inflation, rising interest rates and the war in Ukraine. I will be the first to admit that my crystal ball is even hazier than normal in times like the present. As the US economist JK Galbraith once said “there are two types of economists – those that don’t know and those that don’t know they don’t know.” And this is certainly an environment where much is unknown. But the basic principles of investing are simple and timeless and can be particularly useful to bear in mind in times like this. This note continues our updated series that began with “Five great charts on investing”.
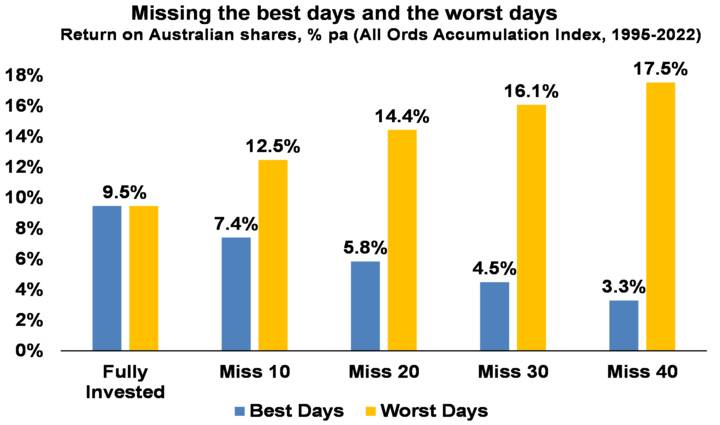
Chart #1 Time in versus timing
In times of uncertainty its temping to try and time the market, ie to sell ahead of falls & buy in anticipation of gains. But without a proven asset allocation or stock picking process, trying to time the market is very difficult. A good way to demonstrate this is with a comparison of returns if an investor is fully invested in shares versus missing out on the best (or worst) days. The next chart shows that if you were fully invested in Australian shares from January 1995, you would have returned 9.5%pa (including dividends but not allowing for franking credits, tax and fees).
Source: Bloomberg, AMP
If by trying to time the market you avoided the 10 worst days (yellow bars), you would have boosted your return to 12.5% pa. If you avoided the 40 worst days, it would have been boosted to 17.5% pa. But this is very hard to do, and many investors only get out after the bad returns have occurred, just in time to miss some of the best days and so end up damaging their longer term returns. For example, if by trying to time the market you miss the 10 best days (blue bars), the return falls to 7.4% pa. If you miss the 40 best days, it drops to just 3.3% pa. Hence the old cliché that “it’s time in that matters, not timing”.
Key message: market timing is great if you can get it right, but without a process the risk of getting it wrong is very high and, if so, it can destroy your longer-term returns.
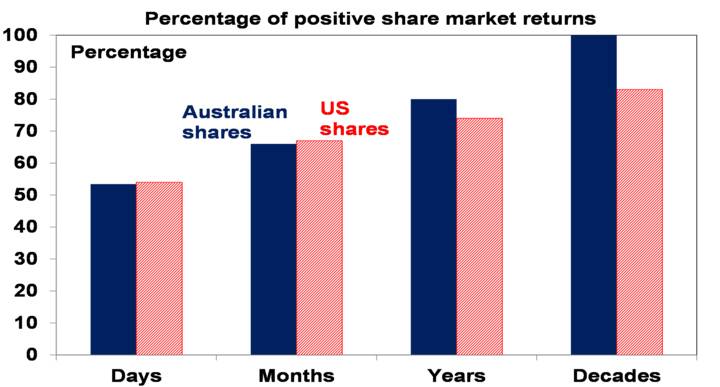
Chart #2 Look less
If you look at the daily movements in the share market, they are down almost as much as they are up, with only just over 50% of days seeing positive gains. See the next chart for Australian and US shares. So day by day, it’s pretty much a coin toss as to whether you will get good news or bad news. But if you only look monthly and allow for dividends, the historical experience tells us you will only get bad news around a third of the time. Looking only on a calendar year basis, data back to 1900 indicates the probability of a loss slides to just 20% in Australian shares and 26% for US shares. And if you go all the way out to once a decade, since 1900 positive returns have been seen 100% of the time for Australian shares and 82% for US shares.
Daily and monthly data from 1995, data for years and decades from 1900. Source: Bloomberg, RBA, ASX, AMP
Key message: the less you look at your investments, the less you will be disappointed. This matters as the more you are disappointed, the greater the risk of selling at the wrong time.
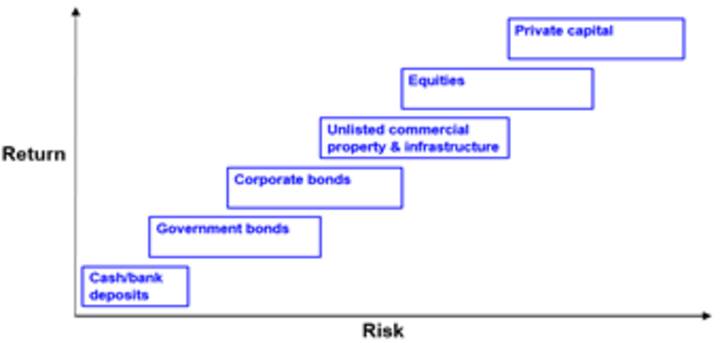
Chart #3 Risk and return
This chart is basic to investing. Each asset class has its own risk (in terms of volatility and risk of loss) and return characteristics. Put simply: the higher the risk of an asset, the higher the return you will likely achieve over the long term and vice versa. The next chart shows a stylised version of this. Starting with cash, it’s well known that its very low risk but so is its return potential. Government bonds usually offer higher returns but their value can move around a bit in the short term (although major developed countries have not defaulted on their bonds). Corporate debt has a higher return potential again but a higher risk of default. Unlisted or directly held commercial property and infrastructure offer a higher return again but they come with higher risk and are less liquid and can be less able to be diversified (except via say a managed fund). Equities can offer another step up in return, but this is because they come with higher risk as they are subject to share market volatility and individual companies can go bankrupt wiping out share holder capital. Beyond this, private equity entails more risk again & so tends to command an even higher return premium. Each step up involves more risk, and this is compensated for with more long-term return. Of course, this neat relationship may not hold in the short-term – eg, government bonds have had worse returns over the last 12 months than shares. And its hard to place “crypto currencies” on the chart – they are very volatile but have not been around long enough to have confidence their long-term returns will compensate for this.
Risk and return across major asset classes
Source: AMP
Key message: Investors need to allow for the risk (and liquidity) and return characteristics of each asset. Those who don’t mind short-term risk (and illiquidity in the case of unlisted assets) can take advantage of the higher returns growth assets offer over long periods. The key is that there is no free lunch.
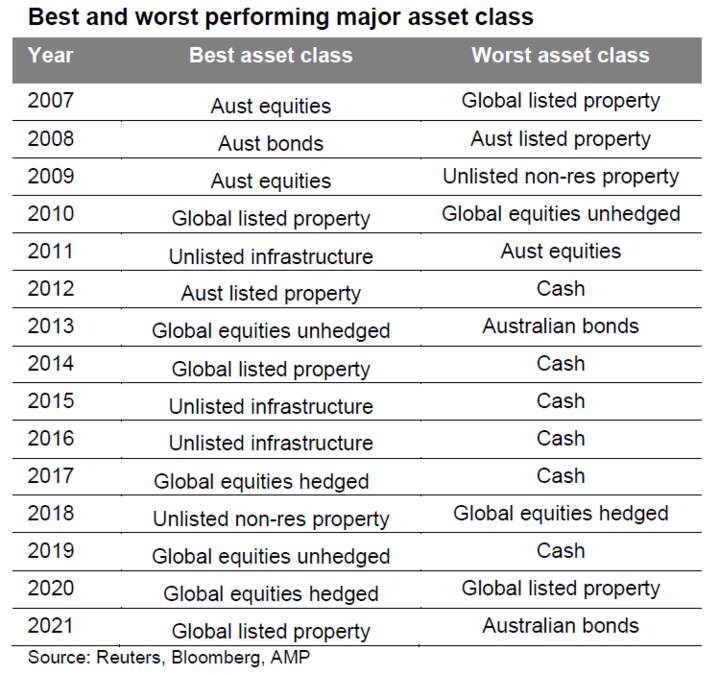
Chart #4 Diversification
But this not the end of the story. The next table shows the best and worst performing asset class in each year over the last 15.
Source: Reuters, Bloomberg, AMP
It can be seen that the best performing asset each year can vary dramatically, and that last year’s top performer is no guide to the year ahead. So, it makes sense to have a combination of asset classes in your portfolio. This particularly applies to assets that are lowly correlated, ie that don’t just move in lock step with each other. For example, global and Australian shares tend to move together during extreme events. But bonds and shares tend to diverge when crises hit threatening recession – as we saw in the GFC when shares fell but bonds rallied. So there is a case to have bonds in a portfolio to help stabilise returns. Of course, this doesn’t always work, eg like now when inflation is the key danger, highlighting the case for cash & real assets like unlisted commercial property and infrastructure too.
Key message: diversification is also a bit like the magic of compound interest. Having a well-diversified exposure means your portfolio won’t be as volatile.
Chart #5 Residential property has a role
Chart #1 in the first edition in this Five Charts series highlighted the power of compound interest, with a comparison showing the value of $1 invested in various Australian asset classes back in 1900 and what it would be worth today. Unfortunately, I do not have monthly data for Australian residential property returns back that far but I do have them on an annual basis back to 1926 and this is shown in the next chart starting with a $100 investment.
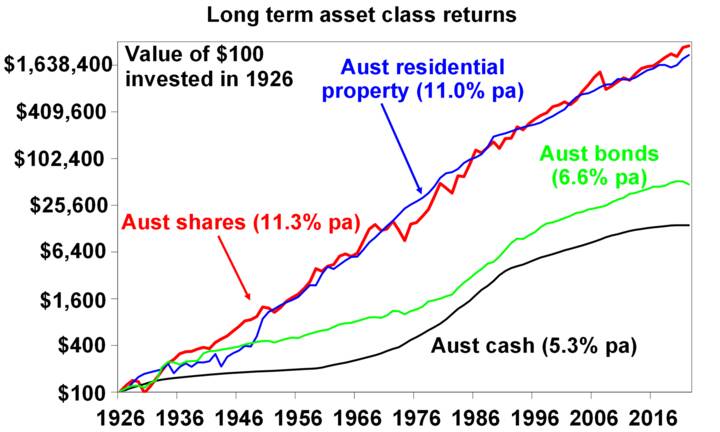
Source: ABS, REIA, RBA, ASX, AMP
Again it can be seen that over very long periods the power of compounding works wonders for shares compared to bonds and cash. But it can also be seen to work well for Australian residential property with an average total return (capital growth plus net rental income) of 11% pa, which is similar to that for shares. All of which highlights, along with the diversification benefits of a real asset like property, the case to have it in a well-diversified portfolio along with listed assets like shares, bonds and cash. The key is to allow for the different “risks” experienced by property versus shares. Property prices are less volatile than share prices as they are not traded on share markets and so are not as subject to the whims of investors and movements in their values tend to relate more to movements in the real economy. But residential property takes longer to buy and sell and it’s harder to diversify as you can’t easily have exposure to hundreds or thousands of properties exposed to different sectors and countries like you can with shares. So, there are trade-offs between residential property and shares.
Key message: given their long-term returns and diversification benefits, there is a key role for residential property in your investment portfolio – putting aside the current threat to the housing market from poor affordability and rising interest rates.
5 Signs the Green Hydrogen Economy is Just Getting Started
Words by Tina Casey
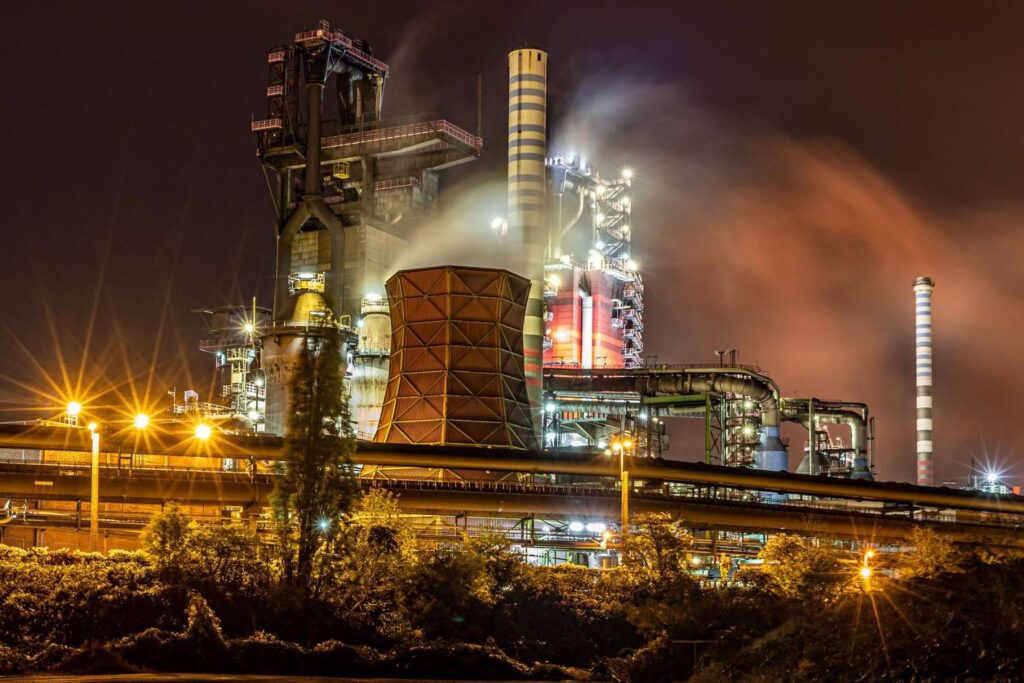
A steel plant in Duisburg, Germany
The dream of a global hydrogen economy has tantalized policymakers ever since the 1970s when researchers began to discuss how the ubiquitous, clean-burning fuel could replace coal, oil and natural gas. Skeptics have had 50 years to scoff at the notion, but it looks like hydrogen fans are getting the last laugh — and that could open up new pathways for scaling up green hydrogen and, in the bigger picture, decarbonization across multiple commercial sectors.
The renewable energy difference
Hydrogen is the most common element in the universe, but it does not exist independently. It must be extracted from something. The primary source of hydrogen today is natural gas, along with coal to a lesser extent.
Hydrogen is also abundant in renewable resources, including water as well as biogas and biomass. The problem is how to extract hydrogen from renewable hosts without adding excessive costs and greenhouse gas emissions to the global economy.
Both of those problems appeared insurmountable until recent years, when the cost of wind and solar energy began dropping. That sea change in the global energy profile has provided low cost, zero emission electricity to power electrolyzer systems, which deploy an electrical current to push so-named green hydrogen gas out of water.
Though much of the media attention has focused on the use of hydrogen in fuel cell electric cars, recent developments indicate that green hydrogen is only beginning to flex its muscles on the global scene.
Here are five key developments that have been sailing under the media radar.
Electrofuels
Fuel cell and battery-powered electric vehicles will eventually dominate the passenger car market, but that will take many years. In the meantime, biofuels can help neutralize greenhouse gas emissions to some extent.
However, the biofuel supply chain cannot scale up indefinitely. It is already running into food supply and and habitat conservation issues. An alternative pathway is needed, and that’s where electrofuels come in.
During the Obama administration, researchers began to focus on electrofuels as drop-in replacements for both conventional biofuels and fossil fuels. The initial concept was to produce fuel from solar energy and bacteria in a process that mimics photosynthesis.
More recently, researchers have begun deploying low-cost renewable energy and green hydrogen to skip the bacteria and go straight to a synthetic process that deploys captured carbon dioxide, yielding a drop-in replacement for conventional fuel.
Porsche appears to be the first automaker to invest in the new electrofuels. The automaker has been investing in electric vehicles, but apparently the company also plans to lean on electrofuels to neutralize emissions from its profitable 911 line of sports cars.
Another leading firm to enter the field is Maersk. Last year Maersk invested in the Silicon Valley electrofuel startup Prometheus Fuels, which is developing a process that deploys direct-air carbon capture. BMW also has an interest in the project, along with American Airlines and other stakeholders.
Green steel
Heavy industry is one area that has resisted decarbonization, but that is beginning to change. In Europe, the steel industry is depending on the new HYBRIT project to demonstrate the use of green hydrogen to replace fossil energy in iron and steelmaking.
Closer to home, the global steel maker ArcelorMittal recently announced a successful test of green hydrogen in the direct reduced iron process at its steelmaking facility Canada. The process normally deploys natural gas to extract oxygen from iron oxide pellets, yielding metallic iron for steel production.
The somewhat modest test involved replacing only 6.8 percent of natural gas at the Canadian plant with green hydrogen, but apparently that was good enough to convince ArcelorMittal to continue pursuing that pathway.
“This test is an important milestone in the Company’s journey to produce zero carbon emissions steel via the DRI-based steelmaking route using green hydrogen as an input,” ArcelorMittal stated.
The company is also working on a hydrogen demonstration project at its plant in Hamburg, Germany. The plans involve sourcing the hydrogen from waste gas at the facility at the beginning, then transitioning to green hydrogen as supplies become available.
Power generation and energy infrastructure
The design of systems that can transition from gas to green hydrogen is also taking hold in the power generation industry, where existing gas storage facilities, pipelines and other infrastructure can also be called into play.
The field has attracted the interest of leading global engineering firms, including Mitsubishi. The company is a stakeholder in the multi-level Advanced Clean Energy Storage project in Utah. The project includes converting an 840-megawatt coal power plant to a mix of green hydrogen and natural gas initially, with a goal of 100 percent green hydrogen in later years.
ACES is said to be the largest project of its kind, and it is not the only one. The idea of a “green hydrogen hub” that combines production, storage and deployment is already catching on among other U.S. states, including a newly announced, massive tri-state project that partners New York with neighboring Connecticut and New Jersey.
The green hydrogen-green ammonia connection
Aside from its use as a fuel, hydrogen is also entangled in other key global industries including agriculture and food processing as well as toiletries and medicines.
In particular, green hydrogen provides a pathway for decarbonizing the ammonia industry. As indicated by the chemical formula NH3, the industry currently relies heavily on fossil inputs to obtain hydrogen for ammonia production (the “N” is nitrogen, which can be drawn from the air).
Aside from its direct use in agriculture and other fields, ammonia can also serve as a low-cost, easily transportable carrier for hydrogen. Once the ammonia arrives at its destination, the hydrogen can be extracted for other uses.
The cost of extracting hydrogen from ammonia has been an obstacle, but the firm Hydrofuel Canada is among those working on solutions.
Last month, Hydrofuel licensed the patent-pending, low cost “MAPS” green ammonia system from Georgia Tech, which involves generating ammonia directly from electrolyzed water and airborne nitrogen. Hydrofuel plans to leverage the ammonia has a hydrogen carrier.
“Green Hydrogen can be separated out from this ammonia to sell at about $1.50 a kg, compared to traditional green H2 which sells for up to $15 a kg. Even at $.08/kWh the production of green Ammonia and releasing Hydrogen from it will be lower cost than any hydrocarbon fuel,” Hydrofuel claims.
New electrolyzer technology
Green hydrogen can be extracted from various forms of biomass, but so far most investor dollars have gone to water electrolysis. That puts the focus on lowering the cost of electrolysis systems, and activity in that area is beginning to pick up steam.
Last month, Bosch joined a growing roster of legacy firms that have committed to improving electrolyzer systems, lowering costs, and ramping up production. The company aims to market and produce “smart” electrolyzer systems in high volume.
Lowering the cost of the membranes and catalysts used in electrolyzer systems is a particular area of focus for startups and legacy firms alike. For example, the startup H2U Technologies is developing a new catalyst-coated membrane that eliminates the use of platinum and other expensive metals in electrolyzer systems. Honeywell is also working along the same lines. Earlier this year, the company announced that it is anticipating a 25 percent drop in the cost of an electrolyzer stack once it commercializes its new catalyst-coated membrane.
Another cost-cutting approach is illustrated by the U.S. firm Advanced Ionics, which is marketing a steam-driven, energy-efficient electrolyzer system for use at industrial sites.
This is just a small sample of the activity under way. Energy stakeholders are also beginning to explore green hydrogen production as a valuable add-on for offshore wind farms, and the field of concentrating solar power could also help increase the supply and lower the cost of green hydrogen.
The window of opportunity to scoff at the global hydrogen economy of the future is beginning to close.
Rare earth element prices to remain strong as demand exceeds supply: Ionic
Author: Jacqueline Holman
EditorAnkit Ajmera
Not many alternatives to rare earth elements
EV producers must pay up to secure supply
SerenTech acquisition offers lifecycle ownership
Rare earth element, or REE, prices are likely to remain strong over the coming years, as demand is set increase faster than supply, Ionic Rare Earths Managing Director Tim Harrison told S&P Global Commodity Insights.
“Where REE pricing is now, it’s probably here for the long-term,” he said. “As for prices to drop there’d have to be a fundamental change in either the supply or demand scenario and I just can’t see where all the supply of rare earths is going to come from to change that dynamic.”
REEs are an essential ingredient for energy transition, as they are used in permanent magnets in electric vehicle motors and in wind turbines.
Global plug-in light duty electric vehicle sales are expected to total 9.1 million units in 2022, up from 6.3 million units in 2021, according to S&P Global analysts. The sales are expected to reach 13.7 million units in 2025 and 26.8 million units in 2030.
Increasing demand has boosted critical mineral prices in general, with the price of 30% Co cobalt hydroxide assessed at $31.70/lb CIF China May 13 for spot cargoes aligned with the Platts methodology from S&P Global, loading 15-60 days out, up 15% since the start of 2022.
Ionic is developing the Makuutu project in Uganda, where it plans to complete a feasibility study by October and start REE production by 2024.
The company completed a scoping study for the project in April 2021. Since then, REE spot prices have risen 35%, while Ionic’s forecast pricing for the end of the decade gained 50%, Harrison said.
“Beyond that, no one has a crystal ball to predict what REE prices are going to do, but just looking at demand and that supply relationship, there is a lot of [upward] pressure on rare earth prices,” he said.
REE substitute
High REE prices would probably drive automakers to potentially look for substitutes, but Harrison said that there were not many other options as REEs were still the most efficient form of material for EV motors.
“There is a lot of work at various EV makers trying to find an alternative solution, but the reality is that this capacity is being built now … I think it’s going to take a long time to develop alternatives that are going to be better than permanent magnets,” Harrison said.
While automakers are worried about high prices, he said permanent magnet motors provide substantial value relative to the cost of the whole EV and were still the most efficient way to get the right weight, range, and capacity.
If REEs become inaccessible, there’d have to be a trade-off between range and power intensity.
“The reality is there is only so much rare earth elements available, so if demand goes up and supply doesn’t increase, it’s logical that prices continue to increase,” Harrison said.
The REE market was around $10 billion-$15 billion/year globally, Harrison said, but it has enabled somewhere between $10 trillion and $15 trillion of the EV industry.
“The Japanese call it the seeds of technology and that’s a fitting analogy because if you don’t have the REEs, you don’t have the technology — you don’t need a lot of it, but without REEs you simply can’t develop the products,” Harrison said.
China
While China currently dominates mine production and processing of REEs and has significant global pricing influence, Harrison does not see a threat from Chinese producers undercutting the rest of the market.
“I think we’re entering a very interesting time where everyone has to work toward net-zero carbon and delivering on that ultimately means paying more,” Harrison said. “Nothing is free in this world, and I think the reality is that governments, populations are concerned about the environments, and they make conscious decisions to spend money to be part of the solution toward climate change and trying to do their part and preserve the environment for future generations.”
There was a “tremendous amount” of capability that needed to be built and investments required as governments mandate a move toward EVs, Harrison said.
SerenTech acquisition
Ionic recently acquired UK-based Seren Technologies, which focuses on REE separation and refining technology from waste permanent magnets.
The company will integrate SerenTech over the next 12 months.
Ionic will start a new pilot plant program at the Queen’s University and over the next six months build a new facility in Belfast, Northern Ireland that will upscale into a demonstration plant to separate and refine REEs, Harrison said.
The demo plant will process 30 mt/year of spent magnets and swarf to produce 10 mt/year of refined and separated magnet rare earths oxides, including neodymium, praseodymium, dysprosium, and terbium with purity exceeding 99.9%, Ionic said previously
I hope you have enjoyed this weeks read. Have a great week.
Regards,
Chris Hagan.
Head, Fixed Interest and Superannuation
JMP Securities
Level 1, Harbourside West, Stanley Esplanade
Port Moresby, Papua New Guinea
Mobile (PNG):+675 72319913
Mobile (Int): +61 414529814