29 August, 2022
Welcome to this week’s JMP Report
On the PNGX last week we saw BSP, KSL, KAM, and CPL trade. Prices for all stocks remained unchanged this week with BSP trading 1,002,519 shares at K12.41, KSL trading 21,446 shares at K3.00, KAM had 3,998 shares trade at K1.00 while CPL saw 6,282 shares close at K0.95. Refer to below for details.
WEEKLY MARKET REPORT | 22 August, 2022 – 26 August, 2022
| STOCK | QUANTITY | CLOSING PRICE | CHANGE | % CHANGE | 2021 FINAL DIV | 2021 INTERIM | YIELD % | EX-DATE | RECORD DATE | PAYMENT DATE | DRP | MARKET CAP |
| BSP | 1,301,199 | 12.41 | – | – | K1.3400 | – | 11.61 | THU 10 MAR | FRI 11 MAR | FRI 22 APR | NO | 5,317,971,001 |
| KSL | 158,698 | 2.90 | -0.1 | -3.45 | K0.1850 | – | 7.74 | THU 3 MAR | FRI 4 MAR | FRI 8 APR | NO | 64,817,259 |
| STO | 0 | 19.10 | – | – | K0.2993 | – | – | MON 21 FEB | TUE 22 FEB | THU 24 MAR | – | – |
| KAM | 0 | 1.00 | – | – | – | – | 10.00 | – | – | – | YES | 49,891,306 |
| NCM | 26 | 75.00 | – | – | USD$0.075 | – | – | FRI 25 FEB | MON 28 FEB | THU 31 MAR | – | 33,774,150 |
| NGP | 0 | 0.70 | – | – | – | – | – | – | – | – | – | 32,123,490 |
| CCP | 316,988 | 1.85 | – | – | K0.134 | – | 6.19 | THU 16 JUN | FRI 24 JUN | THU 28 JUL | YES | 569,672,964 |
| CPL | 0 | 0.95 | – | – | – | – |
– | – | – | – | – | 195,964,015 |
I have attached for you BSP’s half yearly results.
BSP | 2022 Half Yearly Financial Statements BSP | Appendix 3A Dividend NotificationAnd a link to STO’s announcement Click here to register and download.
We would also like to thank Ashurst for their latest Low Carbon Pulse.
Download | Ashurst Low Carbon PulseOn the dual listed stocks – PNGX/ASX
BFL – $4.90 +1c
KSL – 88c -1c
NCM – +24c
STO – +34c
On the interest rate front we saw a relatively flat 364 day bill auction with bidders picking up stock at 4.39%, but later in the week we saw BPNG announce another GIS auction for this week. The maturities range between 2yr and 10yr. I will bring you the results in next weeks JMP Report.
And something a little different;
|
Gold Standard $US56.52 ( Down $0.15 / 0.26%) $AU81.75 ( Up $0.04 / 0.04%) Silver Standard $US0.62 ( Down $0.01 / 1.58%) $AU0.89 ( Down $0.01 / 1.11% Platinum $US907 ( Down $16 / 1.73%) $AU1,312 ( Down $18 / 1.35%) Bitcoin $US23,364 ( Down $12 / 0.05%) $AU33,797 ( Up $90 / 0.26%) Ethereum $US1869 ( Up $40 / 2.18%) $AU2703 ( Up $66 / 2.50%) |
What we’ve been reading this week
Booms, busts and investor psychology – why investors need to be aware of the psychology of investing
Dr. Shane Oliver, Head of Investment, Strategy and Economics
Investment markets are driven by more than just fundamentals. Investor psychology plays a huge role and helps explain why asset prices go through periodic booms and busts.
The key for investors is to be aware of the role of investor psychology and its influence on their own thinking. The best defence is to be aware of past market cycles (so nothing comes as a surprise) and to avoid being sucked into booms and spat out during busts. If an investor is looking to trade they should do so on a contrarian basis. This means accumulating when the crowd is panicking, lightening off when it is euphoric.
Introduction
Up until the 1980s the dominant theory was that financial markets were efficient – in other words all relevant information was reflected in asset prices in a rational manner. While some think it was the Global Financial Crisis that caused faith in the so-called Efficient Markets Hypothesis (EMH) to begin unravelling, this actually occurred in the 1980s. In fact, it was the October 1987 crash that drove the nail in the coffin of the EMH as it was impossible to explain why US shares fell over 30% and Australian shares fell 50% in a two-month period when there was very little in the way of new information to justify such a move. It’s also hard to explain the 80% slump in the tech heavy Nasdaq index between 2000 and 2002 on the basis of just fundamentals. Study after study has shown share market volatility is too high to be explained by investment fundamentals alone. Something else is at play, & that is investor psychology.
Investor psychology
Several aspects of investor psychology interact in helping drive bull and bear phases in investment markets, including individual lapses of logic and crowd psychology.
Individuals are not rational
Numerous studies by psychologists have shown that – apart from me and you! – people are not always rational and tend to suffer from various lapses of logic. The most significant examples are as follows.
- Extrapolating the present into the future – people tend to downplay uncertainty and assume recent trends, whether good or bad, will continue.
- Giving more weight to recent spectacular or personal experiences in assessing the probability of events occurring. This results in an emotional involvement with an investment strategy – if an investor has experienced a winning investment lately he or she is likely to expect that it will remain so. Once a bubble gets underway, investors’ emotional commitment to it continuing steadily rises, thus helping to perpetuate it.
- Overconfidence – people tend to be overconfident in their own investment abilities.
- Too slow in adjusting expectations – people tend to be overly conservative in adjusting their expectations to new information and do so slowly over time. This partly reflects what is called “anchoring” where people latch on to the first piece of inflation they come across and regard it as the norm. This partly explains why bubbles and crashes in share markets normally unfold over long periods.
- Selective use of information – people tend to ignore information that conflicts with their views. In other words, they make their own reality and give more weight to information that confirms their views. This again helps to perpetuate a bubble once it gets underway.
- Wishful thinking – people tend to require less information to predict a desirable event than an undesirable one. Hence, asset price bubbles normally precede crashes.
- Myopic loss aversion – people tend to dislike losing money more than they like gaining it. Various experiments have found that a potential gain must be twice the potential loss before an investor will consider accepting the risk. An aversion to any loss probably explains why shares traditionally are able to provide a relatively high return (or risk premium) relative to “safer” assets like cash or bonds.
The madness of crowds
As if individual irrationality is not enough, it tends to get magnified and reinforced by “crowd psychology”. Investment markets have long been considered as providing examples of crowd psychology at work. Collective behaviour in investment markets requires the presence of several things: - a means where behaviour can be contagious – mass communication with the proliferation of electronic media are a perfect example of this. More than ever, investors are drawing their information from the same sources, which in turn results in an ever-increasing correlation of views amongst investors, thus reinforcing trends;
- pressure for conformity – interaction with friends, monthly performance comparisons, industry standards and benchmarking, can result in “herding” amongst investors;
- a precipitating event or displacement that gives rise to a general belief that motivates investors. The IT revolution of the late 1990s, the growth in China in the 2000s and crypto currencies more recently are classic examples of this on the positive side. The demise of Lehman Brothers and problems with some crypto currencies/markets are examples of displacements on the negative side; and
- a general belief which grows and spreads – eg, share prices can only go up – this helps reinforce the trend set off by the initial displacement.
Bubbles and busts
The combination of lapses of logic by individuals in making investment decisions being magnified by crowd psychology go a long way to explaining why speculative surges in asset prices develop (usually after some good news) and how they feed on themselves (as individuals project recent price gains into the future, exercise “wishful thinking” & get positive feedback via the media, their friends, etc). Of course, the whole process goes into reverse once buying is exhausted, often triggered by contrary news to that which drove the rise initially.
Investor psychology through a market cycle looks like what Russell Investments called the roller coaster of investor emotion. When times are good, investors move from optimism to excitement, and eventually euphoria as an investment’s price – be it shares, housing, gold, cryptos or whatever – moves higher and higher. So by the time the market tops out investors as group are maximum bullish and fully invested, often with no one left to buy. This ultimately sets the scene for a bit of bad news to push prices lower. As selling intensifies and prices fall further, investor emotion goes from anxiety to desperation, and eventually capitulation and depression. By the time the market bottoms out investors are maximum bearish and many are out of the market. This then sets the scene for the market to bottom as it only requires a bit of good news (or less bad news) to bring back buying, and then the cycle repeats.
The roller coaster of investor emotion through a mkt cycle
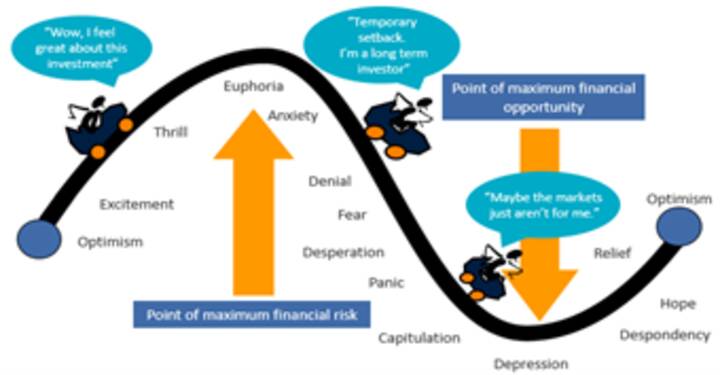
Source: Russell Investments, AMP
This pattern has been repeated time again over the years: in the early/mid 1990s with emerging markets; the late 1990s tech boom; late 2000s with the focus on credit, US housing; and arguably more recently with crypto currencies and yield plays.
Points to note
Firstly, confidence and investor psychology do not act in a vacuum. The move from depression at the bottom of a cycle to euphoria at the top is usually underpinned by fundamental developments, e.g., strong economic growth and easy money.
Second, at market extremes confidence is best read in a contrarian fashion – major bull markets do not start when investors are feeling euphoric and major bear markets do not start when they are depressed. By the time investor confidence has reached these extremes, all those who wish to buy (or sell) have done so meaning it only requires a small amount of bad news (or good news) to tip investors the other way. So extreme low points in confidence are often associated with market bottoms, and vice versa for extreme highs.
Third, ideally one needs to look at what investors are thinking (sentiment) and what they are actually doing (positioning).
Finally, negative crowd sentiment at market bottoms can tend to be associated fairly quickly with market bottoms reflecting the steep declines associated with panics as a market falls. But during bull markets positive sentiment or even euphoria can tend to persist for a while as it takes investors longer to build exposures to assets than to sell them.
So where are we now in relation to shares?
The next charts shows the US share markets and a measure of US investor sentiment that includes surveys of investment newsletter writers and individual investors and the ratio of puts (options to sell shares) to calls (options to buy). It shows that extreme levels of pessimism tend to be associated with major market bottoms (indicated by the green arrows) and extreme measures of optimism tend to be associated with market tops (red arrows) although, as noted above, sentiment can be less reliable at tops.
Currently, the high levels of optimism seen last year are long gone after the plunge in shares, which left sentiment very negative and now sentiment is still negative but not extreme. If anything, this is mildly bullish from a contrarian perspective but after the rally since June it’s not a strong signal either way.
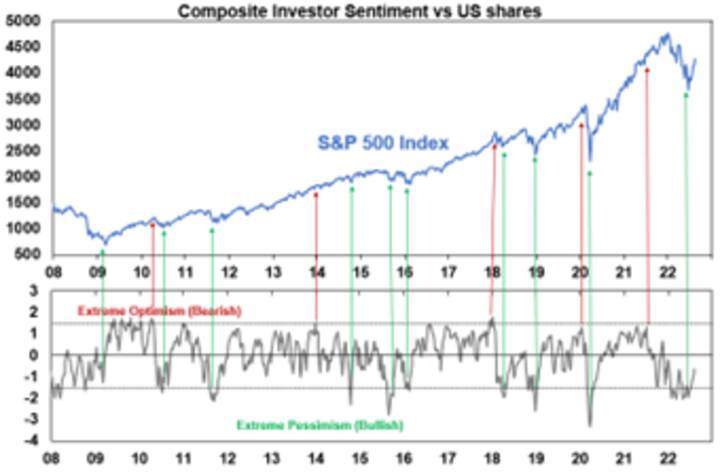
Source: Bloomberg, Sentimentrader, Investors Intelligence, AMP
What does this mean for investors?
There are several implications for investors.
- First, recognise that investment markets are not only driven by fundamentals, but also by the often-irrational and erratic behaviour of an unstable crowd of investors. The key here is to be aware of past market booms and busts, so that when they arise in the future you understand them and do not overreact (piling into unstable bubbles near the top or selling everything during busts and locking in a loss at the bottom).
- Second, try and recognise your own emotional responses. In other words, be aware of how you are influenced by lapses in your own logic and crowd influences like those noted above. For example, you could ask yourself: “am I highly affected by recent developments? Am I too confident in my expectations? Can I bear a paper loss?”
- Thirdly, to guard against emotional responses choose an investment strategy which can withstand inevitable crises whilst remaining consistent with your financial objectives and risk tolerance. Then stick to this even when surging share prices tempt you into a more aggressive approach, or when plunging values suck you into a defensive approach.
- Fourthly, if you are tempted to trade, do so on a contrarian basis. Buy when the crowd is bearish, sell when it is bullish. Extremes of bullishness often signal eventual market tops, and extremes of bearishness often signal bottoms. Successful investing requires going against the crowd at extremes. Various investor sentiment and positioning surveys can help. But also recognise contrarian investing is not fool-proof – just because the crowd looks irrationally bullish (or bearish) doesn’t mean it can’t get more so.
Tourism Boosts Pacific Economic Outlook, but COVID-19, Rising Prices Pose Risks

MANILA, PHILIPPINES (4 August 2022) — A revival in tourism is expected to boost economic growth in the Pacific in 2022 and 2023, but the COVID-19 pandemic, rising commodity prices, and climate change continue to pose risks, according to the Asian Development Bank.
After an average economic contraction of 0.6% in 2021, ADB’s Pacific Economic Monitor (PEM), released today, says the Pacific is expected to grow by 4.7% this year and 5.4% next year. The turnaround reflects rising visitor arrivals in the tourism-dependent economies of the Cook Islands, Fiji, and Palau, as well as expectations for Papua New Guinea’s minerals sector to benefit from the higher international commodity prices being driven by the Russian invasion of Ukraine.
But the PEM says the Russia–Ukraine war also poses a risk to the subregion through rising import and transport costs, accelerating inflation, and increasing trade and fiscal deficits across the Pacific. Other risks to the Pacific’s recovery include community transmission of COVID-19 and some challenges in vaccine rollouts, as well as the region’s vulnerability to climate change and disasters.
“This outlook for the Pacific is welcome after more than 2 years of negative growth caused by COVID-19, but significant risks to this recovery remain,” said ADB Director General for the Pacific Leah Gutierrez. “It is vital that development partners, stakeholders, and policy makers work closely together to ensure the continued recovery.”
The latest PEM forecast represents an improvement on that seen in the Asian Development Outlook (ADO) 2022 released in April, which projected the Pacific’s economic growth to be 3.9% in 2022.
The PEM identifies Pacific economies as among the most vulnerable in the world to climate change and disasters, and that the impact of these shocks—compounded by the fallout from COVID-19 and commodity price spikes—has been sizable. Ensuring sustainable growth will hinge on investing in climate and disaster resilience, the cost of which can exceed the governments’ own resources. The policy briefs in this issue of the PEM examine how the Pacific is pursuing climate financing from innovative sources, and how ADB is helping to respond to climate change and better manage disaster risk. Continuing efforts to strengthen public financial management will support fiscal sustainability, restore resource buffers, and re-establish a strong foundation for the next potential crisis.
The PEM also examines a wide range of issues affecting Pacific economies, including:
The role of climate finance in sustaining Fiji’s recovery amid rising inflation
The North Pacific’s preparedness for sustainable investing
Climate finance and water security in Kiribati and Tuvalu
Climate adaptation and budgeting amid volatile revenue in Nauru
Fiscal challenges of climate financing in Papua New Guinea
Promoting climate and fiscal resiliency in Solomon Islands
Counting the costs and preparing for the future of South Pacific economies
The challenge of financing a climate emergency in Vanuatu
ADB is committed to achieving a prosperous, inclusive, resilient, and sustainable Asia and the Pacific, while sustaining its efforts to eradicate extreme poverty. Established in 1966, it is owned by 68 members—49 from the region.
Thank you to Asian Development Bank for this article
World Bank backs carbon credit blockchain registry to attract crypto investors
The World Bank wants to direct the NFT craze towards projects that cut emissions and improve the transparency of carbon offset markets

The International Finance Corporation division of the World Bank is backing the project. (Pic: World Bank/Flickr)
By Joe Lo
The World Bank’s International Finance Corporation (IFC) division has launched a project to use blockchain to register carbon removal projects and to turn carbon credits into tokens for cryptocurrency investors to speculate with.
Following several instances of cryptocurrency enthusiasts buying carbon credits which don’t do much good for the climate, this project’s backers want to keep those buyers but steer them onto carbon credits which have been verified by organisations like Verra and Gold Standard.
Steve Glickman, an Obama-era White House official whose company Aspiration is part-funding the project, told Climate Home that “we haven’t seen nearly as much capital and nearly as many institutional investors… that we need to see to have the kind of impact on nature-based carbon removal and reduction strategies that are required for us to hit net zero”.
“Our analysis of why that’s slow,” he said, “is that there’s real questions in the marketplace around how you would do this type of carbon credits, investing in a highly credible, responsible way and so we want to build the mechanisms of methodology for doing that… and that’s where the blockchain comes in.”
Brazil election: Lula challenges Bolsonaro’s deforestation record, backs oil development
The blockchain is a computer-based system that use digital keys to prove and display who owns what. A blockchain combined with a central registry of carbon credits helps ensure that those who are carrying out green projects aren’t selling the credit for one tonne of emissions reductions to more than one buyer.
Gilles Dufrasne is the policy officer for a watchdog NGO called Carbon Market Watch. He said this kind of transparency was “useful”.
Rachel Kyte is a former CEO of Sustainable Energy for All and leads an initiative to promote integrity in carbon credits. She told Climate Home: “Blockchain offers opportunities to build high integrity voluntary carbon markets and it is good to see IFC looking for ways to bring high integrity to many developing countries who could benefit.”
But Dufrasne warned that the information provided must be understandable to be truly transparent. He said financial technology (fintech) companies often claim their projects are transparent because all the information is public. “It may be transparent, but it’s not accessible because nobody understands how it works apart from the fintech people,” he said.
China responds coolly to US climate bill, rejecting a call to resume cooperation
Blockchains can use lots of energy. But this project uses a blockchain run by a company called Chia which relies on a system called “proof of space and time” which uses far less energy than the “proof of work” system used to produce Bitcoin.
Catherine Flick, a computing academic at De Montfort University, told Climate Home this method “is less problematic but relies on the miners proving they have the space to store the data (so memory and hard drives) for a period of time. So instead of energy use there is demand for storage which is problematic in terms of electronic waste and demand for rare earth metals and chips required for the storage”.
Companies buy carbon credits and retire them to offset their emissions but investors also buy them and don’t retire them, in the hope that the price of carbon credits will rise and they can sell them for a profit. Or companies can snap up cheap carbon credits and retire them when the price is high, polluting for cheaper than they would otherwise have done.
Glickman said: “From our standpoint, it doesn’t really matter why you’re coming into this to invest, that capital is going to support the climate finance necessary to support those projects and we think it’s a good thing that there are more ways that these carbon credits can be liquid beyond just being retired against a carbon footprint.”
Why the US climate bill might struggle to deliver on carbon capture
Turning credits into “tokens” is an attempt to attract investors who have become caught up in the “non-fungible token” (NFT) craze where people have paid up to $69m to be recognised as the “owner” of digital art.
Dufrasne said that buying a carbon credit, whether it’s an NFT or not, doesn’t help the climate unless it is retired rather than being sold on. He said: “I’m not under the impression that so many actors in the in the cryptocurrency space are there to just buy these tokens and then make them disappear because then they don’t have anything else to sell.”
While blockchain can help avoid double-counting, it doesn’t help solve other problems with carbon credits like whether the emissions reductions claimed for wouldn’t have happened anyway and whether the emission-cutting projects will survive for as long as the credit sellers claim.
I hope you have enjoyed this weeks read, if you would like to find out more on how to start your investment journey, please do not hesitate to contact me
Have an awesome week,
Chris Hagan.
Head, Fixed Interest and Superannuation
JMP Securities
Level 1, Harbourside West, Stanley Esplanade
Port Moresby, Papua New Guinea
Mobile (PNG):+675 72319913
Mobile (Int): +61 414529814