15 August, 2022
Hello and Welcome to this week’s JMP Report
On the local bourse, we saw BSP, KSL and CCP trade. BSP traded 1,996 shares, closing at K12.41, KSL saw 33,056 shares trade, closing at K3.00 while CCP traded 186,148 shares closing unchanged at K1.85. Refer details below;
WEEKLY MARKET REPORT | 08 August, 2022 – 12 August, 2022
| STOCK | QUANTITY | CLOSING PRICE | CHANGE | % CHANGE | 2021 FINAL DIV | 2021 INTERIM | YIELD % | EX-DATE | RECORD DATE | PAYMENT DATE | DRP | MARKET CAP |
| BSP | 1,995 | 12.41 | – | – | K1.3400 | – | 11.61 | THU 10 MAR | FRI 11 MAR | FRI 22 APR | NO | 5,317,971,001 |
| KSL | 33,056 | 3.00 | 0.1 | 3.33 | K0.1850 | – | 7.74 | THU 3 MAR | FRI 4 MAR | FRI 8 APR | NO | 64,817,259 |
| STO | 0 | 19.10 | – | – | K0.2993 | – | – | MON 21 FEB | TUE 22 FEB | THU 24 MAR | – | – |
| KAM | 0 | 1.00 | – | – | – | – | 10.00 | – | – | – | YES | 49,891,306 |
| NCM | 0 | 75.00 | – | – | USD$0.075 | – | – | FRI 25 FEB | MON 28 FEB | THU 31 MAR | – | 33,774,150 |
| NGP | 0 | 0.70 | – | – | – | – | – | – | – | – | – | 32,123,490 |
| CCP | 186,148 | 1.85 | – | – | K0.134 | – | 6.19 | THU 16 JUN | FRI 24 JUN | THU 28 JUL | YES | 569,672,964 |
| CPL | 0 | 0.95 | – | – | – | – |
– | – | – | – | – | 195,964,015 |
On the dual listed stocks – PNGX/ASX
BFL – $4.89 -1c
KSL – $0.88 +1.5c
NCM -$19.11 -20
STO – $7.18 +13c
My order book has us as nett buyers of CCP and BSP
On the interest rate front we saw the 364 day bills drop to an average of 4.39%. The market was oversubscribed but the bids are not reflecting a “must bid aggressively to get set” attitude. The market is still awash with cash and no wonder, you can’t get fx for the love of money.
And something a little different;
|
Gold Standard $US57.63 ( Down $0.04 / 0.08%) $AU81.32 ( Down $1.54 / 1.85%) Silver Standard $US0.66 ( Up $0.00 / 0.00%) $AU0.93 ( Up $-0.00 / 1.06%) Bitcoin $US23,877 ( Up $674 / 2.90%) $AU33,696 ( Up $364 / 1.09%) Ethereum $US1852 ( Up $148 / 8.68%) $AU2613 ( Up $166 / 6.78%)
|
What we’ve been reading this week
GOLDILOCKS & THE 3 DEBT SOLUTIONS
Ainslie Bullion
The world is sitting on an unprecedented amount of debt. There are only 3 ways to reduce debt. You can to pay it off through increased ‘profits’ or productivity at a sovereign level, write it off (pretty much impossible at a sovereign level – particularly if you are the worlds reserve currency and need ‘faith’ preserved in said currency), or finally via inflation. In simple terms if you let inflation rip then relatively, your fixed amount of debt looks lower against everything else now ‘worth’ more. So the question begging now is – wouldn’t the Fed quietly like some Goldilocks ‘not too hot, not too cold’ inflation?
Respectfully, blind Freddy can see the US is in a recession whether you believe 2 consecutive quarters of negative growth defines one or not. The US NFP jobs report Friday, heralded by recession sceptics / spin doctors as proof of no recession, when looking under the hood, perversely confirms the recession is here as we discussed yesterday (article and discussed on GSS Insights). So let’s take a miraculous turn of growth to pay down all this debt firmly off the table. Let’s also remove an equally miraculous universally agreed debt jubilee off as well. The world, quite frankly, is too divided to agree on something that will disproportionately see winners and losers of an historically epic monetary scale. So we are stuck with inflation or an inevitable financial bust and economic reset that has ended every Fiat currency experiment in history.
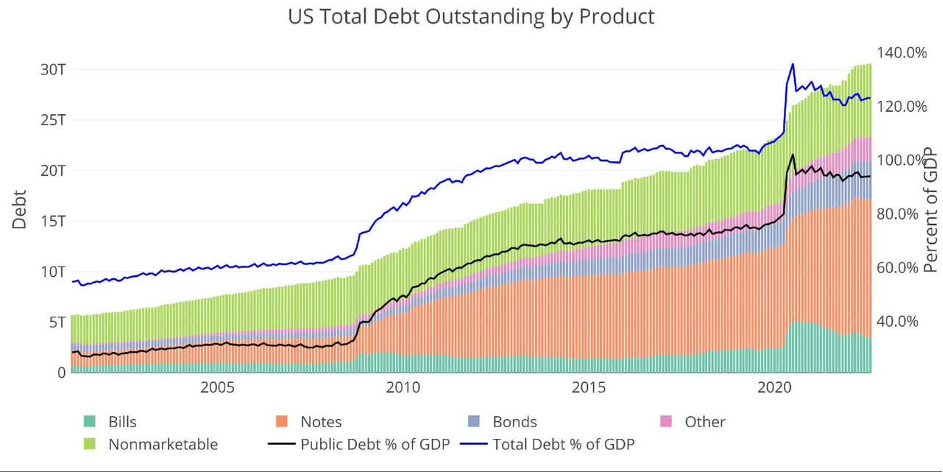
What is often missed in this fanciful theory of inflating away debt is our lack of political appetite for any kind of austerity or hardship. This week we saw the US Government pass yet another piece of big spending legislation via the Climate and Drugs Bills, another $437 billion in total on top of all the previous debt funded programs to ‘help’ the economy and, let’s face it, remain elected. Despite the supposed responsible slowdown in spending by the Biden administration, the US Treasury has added more than $1 trillion in debt in the first 7 months of this year! The US public debt is now $30.6 trillion and so the 23 bps weighted average increase in interest rates on that debt already this hiking cycle equates to an EXTRA $70 billion. Note in the graph below too that US debt still sits at over 120% and with the addition of more debt and the reduction of the GDP denominator, that looks set to rise yet again.
And so if you are still spending more than inflation you are doing absolutely nothing to reduce your debt in real terms. Many social benefits paid out are linked to CPI but the Fed chooses the always lower PCE deflator as it’s measure of achieving its ‘2% target’. Cynically that lower measure allows real CPI to run hotter for longer to try and fight that debt metric as well. You can see the conundrum here. Whilst the Fed might like some stickier real inflation to combat the debt levels, it is trapped into raising rates whilst headline inflation is hurting so many. That very rate rising tool is causing recessionary pressures, more interest payment burden and is still woefully less than inflation. Negative real interest rates, where the nominal interest rate less inflation is negative, essentially ‘forces’ people not to save (as you are literally going backwards in cash in the bank) and to spend or invest in risk. That helps growth but you can clearly see it doesn’t help keep down inflation. That’s why negative real interest rate environments are usually constructive for gold and silver. Whilst they don’t yield, they are the perfect hedge against the resulting inflation and financial instability that protracted periods of negative real interest rates inevitably end in.
There literally is NO Goldilocks solution to this mess.
The author of the graph above, SchiffGold, summarise nicely:
“What it means for Gold and Silver
While the market continues to see the current Fed as being “tough on inflation”, Powell is a far cry from Volcker, with real interest rates still very negative. Even though negative real rates will do little to combat raging inflation, they will do plenty to upend anyone sitting with a lot of short-term or adjustable-rate debt. Look no further than the US Treasury for the biggest party at risk.
A strong July jobs report has given the Fed more room to deny recession and take another aggressive rate hike in September. The Fed is moving very quickly and the math is just starting to catch up. The Treasury could quickly find itself paying more than $500B in annual interest payments. What then? What if inflation is still high? Can the Fed keep hiking and send the US government into a debt spiral while also destroying the value of their own balance sheet?
This seems unlikely at best. The Fed has to pivot because it mathematically has to! This is the same reason interest rates are not above the rate of inflation today. They can’t be! The US Treasury, along with every other over-stretched borrower, would go belly up. The Fed won’t let this happen.”
Investment Cycles – why investors need to be aware and wary of them
Dr Shane Oliver, Head of Investment Strategy and Economics and Chief Economist, AMP
Key points;
Cyclical fluctuations are a key aspect of investment markets. Most are driven by economic developments but are magnified by swings in investor sentiment.
Of particular importance are the long-term cycles which are often driven by waves of innovation and the 3-5 year business cycle. Right now, we are still in the downswing phase of the business cycle and may have entered a weaker and constrained phase of the long-term cycle.
Periods of poor returns invariably give way to periods of great returns and vice versa. The key for investors is to not get thrown off by cyclical fluctuations.
Like a circle in a spiral, like a wheel within a wheel,
Never ending or beginning, on an ever spinning wheel.
As the images unwind, like the circles that you find,
In the windmills of your mind.
A. Bergman, M.Bergman and M.Legrand, The Windmills of Your Mind
Introduction
Cycles are part of life. Whether it be the cycle of day and night, seasons, tides, weather cycles from the almost weekly cycles of cold fronts that regularly blow across southeast Australia to the longer La Nina and El Nino cycles, fertility cycles, birth and death, etc. And so, cycles are also endemic to economies and investment markets. Some are regular, some just rhyme. Despite attempts to end or subdue them via economic policy and regulation the cycle lives on. Usually when we declare investment cycles dead they come back to bite us. Sometimes they bring much joy to investors but they can also bring much angst. But what are they? What causes them? And why do investors need to be aware of them?
Cycles within (investment) cycles
Cycles in investment markets invariably refer to swings between good and bad returns. They usually take their lead from fundamental economic/financial developments but tend to be magnified by waves of investor optimism and pessimism. There are three cycles of particular relevance to investors.
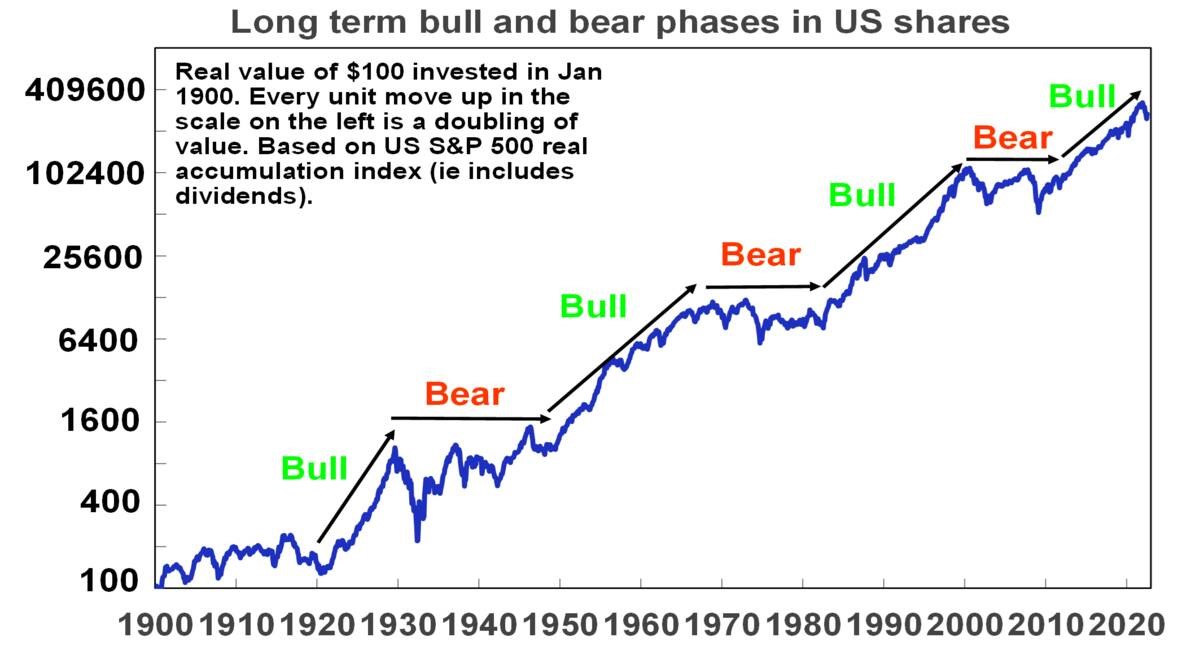
The long term or secular cycle – share markets go through long term or secular bull and bear phases, often lasting between 10 to 20 years. This is most clearly evident in the US share market and illustrated by the following chart. It shows the cumulative real value of $100 invested in 1900. Secular bull markets – or 10-20 year periods where the trend in shares is up – can be seen in the 1920s, 1950s and 60s, the 1980s and 90s and arguably over the past decade. In between in the 1930s and 1940s, 1970s and 2000s are secular bear markets – which are long periods where shares have poor and volatile returns.
Source: Bloomberg, R.Shiller, AMP
Secular bull and bear phases are often related to what is known as Kondratiev waves, named after Russian economist Nikolai Kondratiev who identified them and received the death penalty for his conclusions as they didn’t align with Stalin’s views. Kondratiev waves take their lead from waves of technological innovation. Starting in the 1780s, water power, textiles and iron drove the first industrial revolution; steam, rail and steel drove the second industrial revolution; electricity, chemicals and the internal combustion engine drove a third Kondratiev wave into the 1920s; petro chemicals, electronics and aviation drove a fourth wave in the 1950s & 1960s; the IT revolution helped drive a fifth wave in the 1990s and another spurt more recently. These were associated with secular bull markets in the 1920s, the 1950s & 60s, the 1980s & 90s and over the last decade, although the move to ever lower interest rates & the search for yield & speculation it drove also played big roles in the last two.
At the end of each long-term upswing, share markets reached overvalued extremes and investors had become excessively exposed as optimism that good times would roll on forever reached extremes. This left shares vulnerable as excesses such as too much debt (1930s and 2000s), excessive inflation (1970s) and excessive speculation in tech shares and then housing in the late 1990s and 2000s became overwhelming, giving way to economic weakness and secular bear markets.
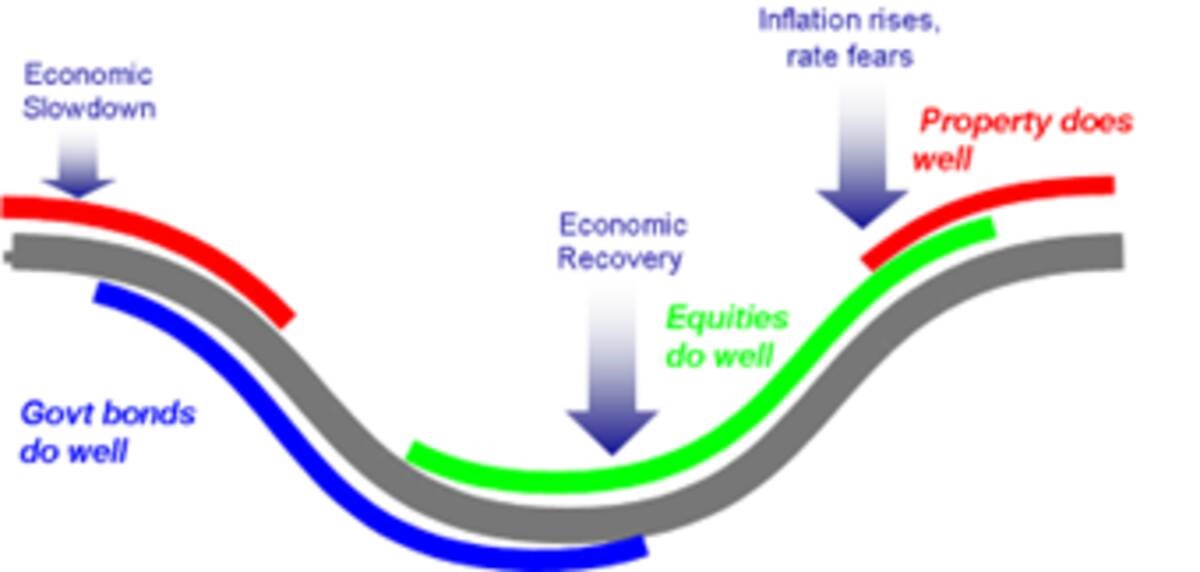
The business cycle – this is the best known economic cycle and has a duration of 3 to 5 years. It tends to relate to the standard economic cycle where after a few years of economic expansion, inflation or other imbalances build up which results in monetary tightening, which leads to a downturn or recession, then falling inflation and monetary easing, which then sets the scene for the next expansion. It tends to underpin a 3 to 5 year cycle in investment markets with the stylised link to share markets, property and government bonds shown in the next chart. Shares tend to lead the business cycle – bottoming several months before an economic trough and vice versa at the top. Property markets tend to be more coincident.
The standard 3 to 5 year investment cycle
Source: AMP
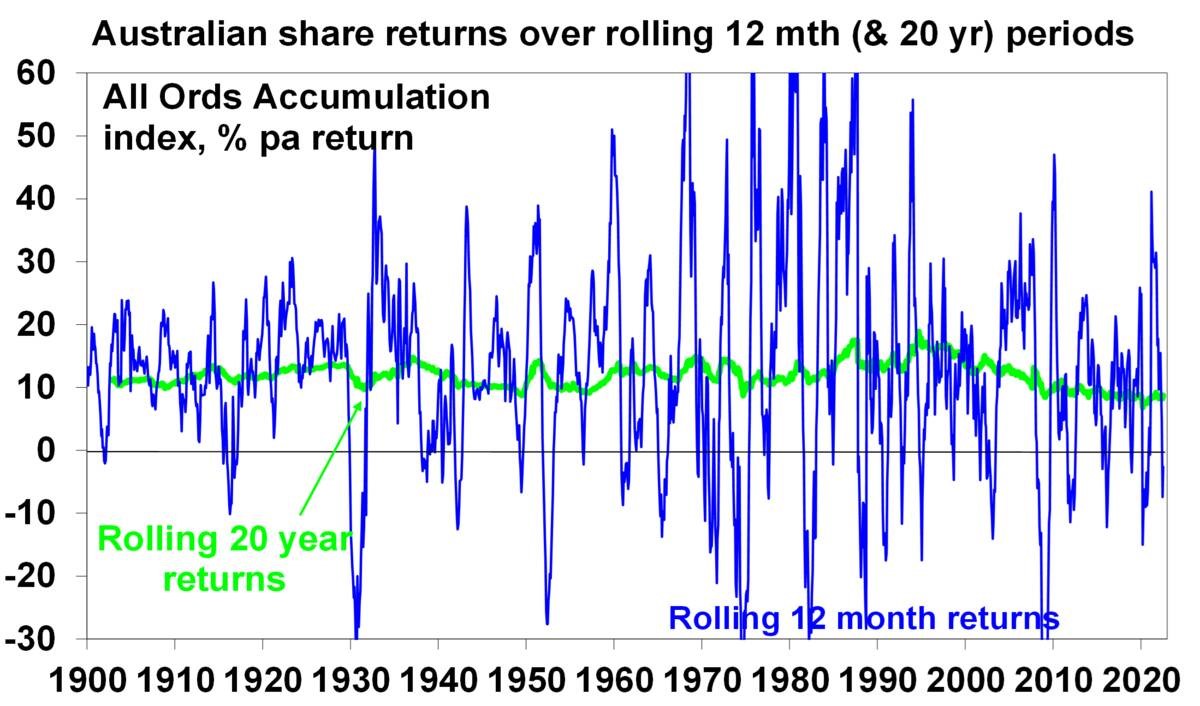
In terms of actual share market fluctuations, the 3-5 year investment cycle is evident in the swings in rolling 12 month changes in Australian share prices. Periods of poor returns are invariably followed by periods of strong returns (and vice versa) but trying to time this can be very hard. See the next chart.
Source: ASX, Bloomberg, AMP
Short term sentiment cycles – within the 3 to 5 year investment cycle there are also short-term swings (weekly, monthly) between overbought and oversold for things like shares and currencies driven by sentiment, but which can relate to the tendency for economic and profit data to run through hot and cold periods, particularly relative to market expectations. They often give rise to corrections in share markets.
Some observations
There are several points to note regarding investment cycles:
No two cycles are the same but they do have common features, usually being set off by economic or financial developments accentuated by swings in investor sentiment. As such, while history doesn’t repeat, it rhymes.
There are cycles within cycles. For example, even though US shares were in long-term secular bear markets in the 1970s and 2000s they still saw periodic investment cycle swings up and down in economies and share markets.
When several cycles combine the impact can be huge. For example, a business cycle downturn in 2000 coincided with an end to the secular boom of the 1980s & 1990s and saw 50% falls in global shares in 2000 to 2003.
Despite various attempts to smooth them out (via economic policies) or declare them dead, cycles live on.
Cycles can be self-limiting as economic downturns lead to lower inventories, pent up demand and lower interest rates, which sow the seeds of recoveries. Share slumps result in cheap shares which entice bargain hunters and sow the seeds of a new bull market.
Investment cycles provide opportunities for investors to vary their asset allocation through the cycle, eg, buying more shares into downturns and cutting exposure into upswings.
But timing investment cycles is difficult. No one rings the bell at the top or bottom. And given the natural psychological tendency of individual investors to project recent market moves into the future and find safety in what the crowd of other investors are doing, the main risk is that investors, in seeking to time investment cycles, end up wrong footed by selling after big falls & buying after big gains. So, for most investors its important to be aware of cycles and understand that they are normal, but then to take a long-term approach to investing that looks through them and makes the most of the compounding of returns over long periods.
Where are we now?
The surge in inflation and aggressive monetary tightening by major central banks have knocked us into the downturn phase of the investment cycle. Economic indicators have generally started to slow and recession is a high risk, with central banks continuing to raise interest rates. US and global shares have already seen greater than 20% falls into their lows in June (and Australian shares fell 16%) and have since recovered just over a third of their decline. It’s possible we have seen the low in shares (as they lead the economic cycle) but the risk of a resumption of the bear market is high given central banks are yet to stop raising rates and the risk of recession remains high, which would drive earnings downgrades.
The shift to higher inflation may see the US share market move into a weaker more volatile phase of its long-term investment cycle. Australian shares with their greater exposure to resources may be better placed in a longer-term context.
Other cycles of relevance
Political cycles – these are less relevant in countries with an irregular political cycle like Australia. However, the US has a precise four-year federal political cycle and this has given rise to a fairly regular pattern. This sees below average returns in the first two years after an election but well above average returns in the third year (as the President seeks to stimulate the economy to help his parties’ re-election), and to a lesser degree in the fourth year. Right now, we are in the second year which is known for sub-par returns – particularly prior to the mid-term elections. The US political cycle for share returns normally improves once the mid-terms are out of the way in November and as we move into the third year of the US presidential cycle.
Seasonal patterns – There is also a well-known seasonal pattern in shares that sees strength from November reflecting the ending of US tax loss selling, a wind down in new equity raisings, new year cheer and the reinvestment of bonuses – continue after a brief pause around February into mid-year, before weakness from around May to October. Right now, we are in a period of seasonal weakness that runs into October.
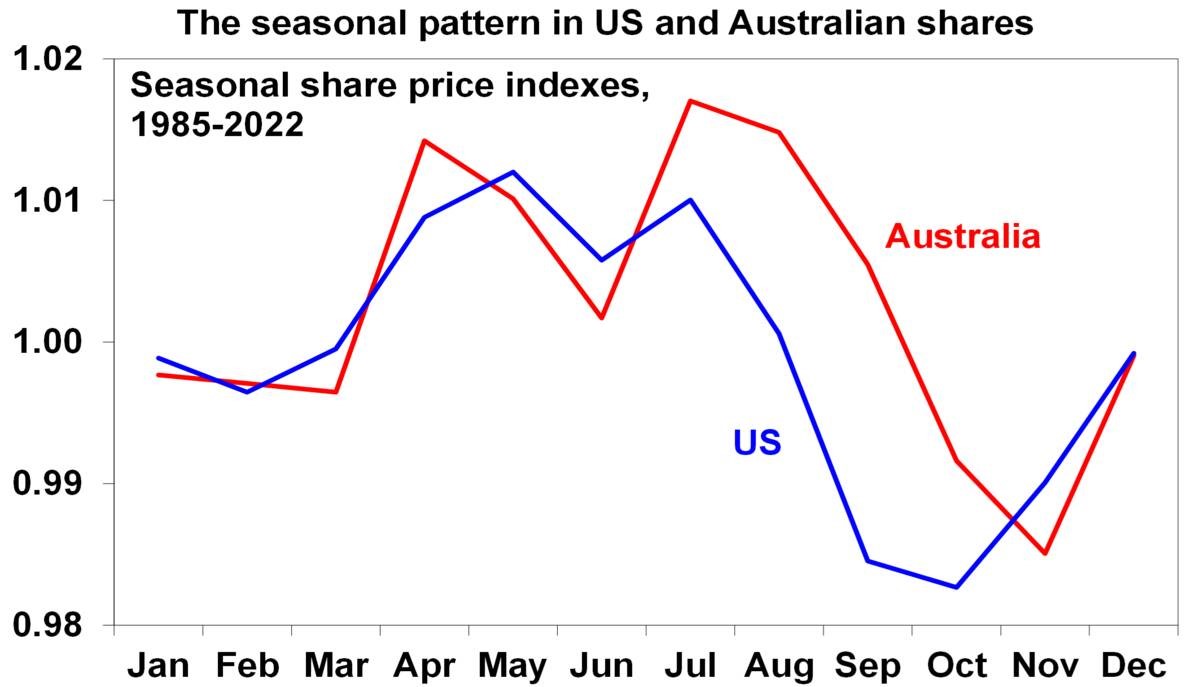
Source: Bloomberg, AMP
Concluding comment
Being aware of investment cycles, and how they influence ones’ investment psychology, is of critical importance for investors.
Hydrogen-powered train testing kicks off on external track

By Charlie Currieon Aug 11, 2022
NEWS TRAINS/RAIL/LOCOMOTIVE
Shell – Official Sponsors of H2 View’s Mobility Content
As part of the hydrogen-powered demonstrator train project, FCH2RAIL, member of the consortium, CAF, has announced it is beginning dynamic testing of the train on an external track.
Having performed successful static tests, CAF says the train is ready to start dynamic tests on an external track, allowing for an opportunity for the hydrogen-powered system to be optimised on specifically selected routes.
As a result, the tests will evaluate the competitiveness of the technology as a solution for the replacement of diesel trains in pursuit of decarbonising railways.
Based on one of Renfe’s commuter trains, the Civia, the demonstration locomotive has been had a power generation system utilising hydrogen fuel cells and batteries installed into the vehicle’s existing traction system.
H2 View understands the hybridised system will allow the train to run in electric mode on electrified infrastructure, while the hybrid mode will be used for operating on catenary-free sections.
The consortium of companies is comprised of CAF, DLR, Toyota, Renfe, ADIF, CNH2, IP and Stemman-Technik. Toyota in 2021 revealed it was supplying its hydrogen fuel cell modules for the project.
With a budget of €14m ($14.45m) the FCH2RAIL project has received €10m ($10.3m) in funding from the Clean Hydrogen Partnership, formerly known as FCH2 JU, a European Commission agency dedicated to promoting the development of hydrogen and fuel cells.
I hope you have enjoyed this weeks read. Please feel free to reach if you would like to discuss your investment journey.
Regards,
Chris Hagan.
Head, Fixed Interest and Superannuation
JMP Securities
Level 1, Harbourside West, Stanley Esplanade
Port Moresby, Papua New Guinea
Mobile (PNG):+675 72319913
Mobile (Int): +61 414529814