18 October 2021
Welcome to this week’s JMP Report.
On the equity front, BSP led the week trading 74,954 shares closing at K12.30. CCP traded 28,500 shares closing up 0.02t to K1.70.
NGP saw 845 shares trade, closing at K0.70 per share along with KSL trading 2,500 shares closing unchanged at K3.25 per share.
CPL saw 1,648 shares trade also closing unchanged at K1.00 together with NCM with 485 shares trading, closing unchanged at K75 per share whilst OSH had 423 shares trade closing down 0.01t to K10.60 per share.
Thanks to Ashurst and Diligent for the two reports attached below.
Low Carbon Pulse - Anniversary EditionDiligent - Modern Governance Checklist
|
WEEKLY MARKET REPORT 11.10.21 – 15.10.21 |
|||||||||||
| STOCK
|
QTY |
CLOSING |
CHANGE |
% CHANGE | 2020 Final Div | 2021 Interim | Yield % | Ex Date | Record Date | Payment Date | DRP |
|
BSP |
74,954 |
12.30 |
– |
-3.15 | K1.0500 | K0.39000 | 11.61% | Fri 24 Sept | Mon 27 Sept | Mon 18 Sept | No |
|
KSL |
2,500 |
3.25 |
– | 0.00 | K0.1690 | K0.08250 | 7.74% | Wed 01 Sept | Thurs 02 Sept | Fri 01 Oct | No |
|
OSH |
423 |
10.60 |
-0.01 | -0.09 | K0.0000 | – | 0.00% | Mon 30 Aug | Mon 20 Sept | Thur 20 Oct | |
|
KAM |
– |
1.00 |
– | 0.00 | K0.0400 | K0.06000 | 10.00% | Wed 15 Sept | Mon 20 Sept | Thurs 20 Oct | Yes |
|
NCM |
485 |
75.00 |
– |
0.00 | K0.0000 | – | 0.00% | Thu 26 Aug | Fri 24 Sept | Mon 01 Nov | |
| NGP | 8,345 | 0.70 | – | 0.00 | K0.0000 | – | 0.00% | Fri 17 Sept | Fri 24 Sept | Mon 01 Nov | |
|
CCP |
28,500 |
1.70 |
0.02 | 1.19 | K0.1800 | 0.04600 | 6.19% | Fri 1 Oct | Fri 8 Oct | Fri 26 Nov | Yes |
|
CPL |
1,648 |
1.00 |
– |
0.00 | K0.0000 | – | 0.00% | ||||
ASX Friday Oct 15 Close
- BFL $5.10
- KSL $0.89
- OSH $4.52
On the interest rate front, the yield curve remains steady with 364day TBill auction rates stagnant at 7.20%. In the longer end, Tap Bond rates are as follows
2 Year 8.00%
4 Year 8.85%
8 Year 9.40%
10 Year 9.40%
No indications on a GIS auction and is less likely now that we should see the 2022 budget in November.
What we have been reading this week
What are we reading
Economics and Markets
Dr Shane Oliver – AMP Capital
It’s still too early to say that the pull back in share markets is over. Some of the worries around US fiscal policy and politics, China, global supply constraints and central banks likely have further to run and could see the correction go further.
Historically the main driver of whether we see a correction or a mild bear market, as opposed to a major bear market, is whether we see a recession. While it may take time, ultimately, we see the current worries being resolved in a way that does not severely threaten global or Australian growth.
So, we continue to see the broader trend in global and Australian shares remaining up once the correction runs its course.
Introduction
September was a poor month for shares with global shares losing 3.7% in local currency terms and Australian shares losing 2.7%. It’s possible that following top to bottom falls of 5-6% in global and Australian shares we have now seen the low. But it’s impossible to be definitive, and with the worry list around US fiscal policy, China, energy, supply bottlenecks and inflation, central bank hawkishness and ongoing risks around coronavirus there could still be another leg down. The extent of the rally since March last year – US shares more than doubled and Australian shares rose 68% – has left them vulnerable to a deeper pullback. However, our view remains that recent turbulence in share markets is a correction rather than the start of a deep bear market. This note reviews the current worries.
The US debt ceiling
The US Government would have hit its debt limit sometime around 18th October after which if it wasn’t increased, it would have had to slash spending to be in line with revenue which would have meant a spending cut of around 12% of US GDP (ie, defaulting on some commitments). But following an offer by Senate Minority leader McConnell, the US debt ceiling has been pushed back into early December (with maybe a little bit of leeway – some say out to January). The move showed McConnell does not want a default and wants to make sure the Democrats increase the debt limit on their own. But this just means the issue will come up again in a few months (along with the need to avoid a Government shutdown where funding was also extended into December). Republican’s still don’t plan to vote for it as that will be seen as signing up to Democrat spending. This means the Democrats will most likely have to do it on their own via the budget reconciliation process for which they now have plenty of time, or with regular legislation if they suspend the ability for Republican’s to filibuster – both of which only require the votes of the 50 Democrat Senators plus VP Harris to pass. The Democrats don’t want to do either as they would prefer Republican cover and so there may still be brinkmanship involved to finally resolve the issue – to get enough Republican senators to support it such that 60 Senate votes are reached or as is more likely to get the support of moderate Democrat senators (like Manchin and Sinema) to pass with 50 votes plus VP Harris. Debt ceiling argy bargy contributed to a 19% pullback in US shares in 2011 and a 4.5% fall in 2013. But ultimately the Democrats (& Republicans) won’t allow the US to default (just as they didn’t in 2011 or 2013).
US fiscal policy and taxes
Progress in passing the Administration’s $550 billion infrastructure spending and $3.5 trillion Build Back Better social spending packages has been delayed. Tensions between moderate and progressive Democrats are high with the latter becoming the left-wing equivalent of the Tea Party. While the $4 trillion boost to spending is spread over eight years, it’s a big boost to government spending which partly explains moderate Democrats’ reluctance to agree to the full amount and raising the debt ceiling at the same time. So, to get moderate support for the package and the debt ceiling increase, the Build Back Better package will likely be cut from $3.5 trillion to $1.5-$2 trillion. Likewise, tax hikes to partly pay for Build Back Better (on profits, capital gains and dividends) are likely to be scaled back. The share market is not focussed on these, but failure to agree to anything on infrastructure and Build Back Better would be seen as policy gridlock and tax hikes could knock 5% of US earnings if they are not cut back – both of which could be a short-term negative for shares (albeit not much beyond that).
Fed Chair Powell’s renomination
The Fed’s trading controversies have damaged Powell and progressive Democrats are against him, but markets tend to prefer continuity. It’s either going to be Powell or someone more dovish (like Lael Brainard) who runs the Fed so I suspect this is not ultimately going to be a big issue for markets.
Evergrande and the Chinese slowdown
China Evergrande is yet to be resolved and other developers are having problems. But Evergrande is not “too big to fail” – it may account for 5% of China’s $US bonds (where investors may not be protected) but it’s only 0.1% of Chinese bank debt so a Lehman moment is looking unlikely. Evergrande shareholders and top management are unlikely to be protected, but the Chinese Government appears to be stepping up efforts to limit the fall out and protect healthy developers, home buyers and the property market (but maybe not global bondholders).
The broader slowdown in Chinese growth reflects the earlier removal of stimulus and coronavirus restrictions in August which have since been relaxed. It’s hard to see the Government allowing much of a slowdown given the risk of social unrest. So, some policy easing is likely to boost growth next year.
The European and Chinese energy crises
A surge in energy prices/cutbacks in power supply in China (owing to carbon emission controls and a shortage of coal) and Europe (where gas prices rose six-fold since early this year reflecting increased global gas demand with reopening, issues with the supply of alternative energy and Russia limiting gas exports) is now dragging oil prices up too. This is all adding to supply bottlenecks, depressing growth, and adding to prices which likely has further to go. But there is some light at the end of the tunnel on this issue: Russia has offered to increase gas supply to Europe (although it may come with some strings attached); the crisis will likely hasten the opening of the Nord Stream 2 gas pipeline thereby boosting gas supply to Europe; Australian, Qatari, US and possibly Iranian (if the nuclear deal is agreed to) gas production is increasing; and there are some signs China is easing restrictions on coal and electricity supply.
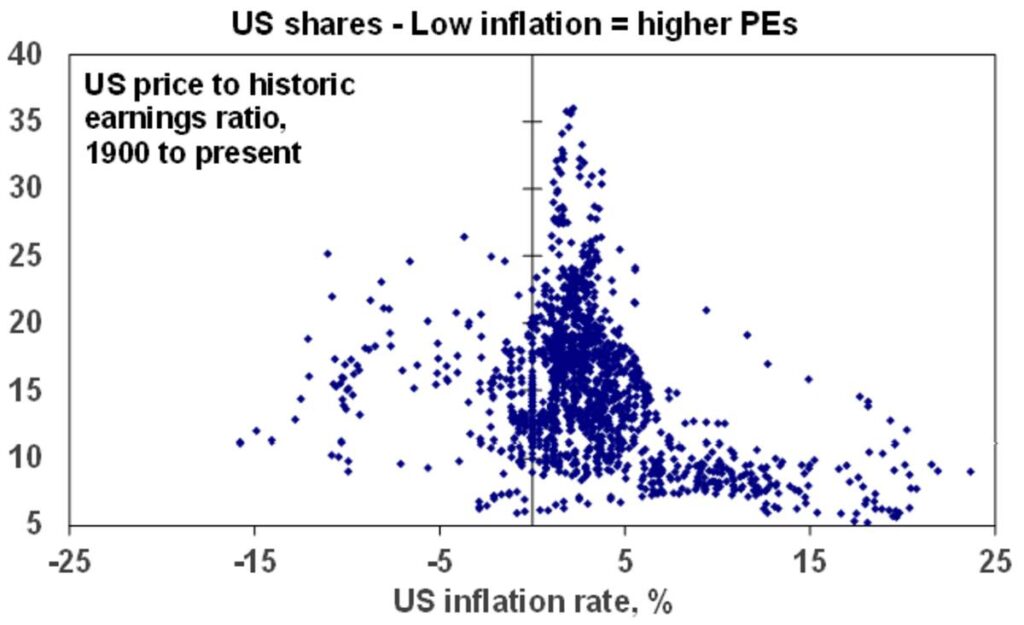
Supply constraints and inflation
This is the biggest issue because a permanent increase to significantly higher inflation will mean lower price to earnings multiples/higher required yields for assets. See Inflation – why it matters for investment markets.
Source: Bloomberg, AMP Capital
However, while the surge in global money and fiscal stimulus pose the longer-term risk of higher inflation, what we are seeing now looks mostly due to distortions to global supply and demand caused by the pandemic. In the pre-covid world, the global supply system was a very finely tuned and highly efficient machine. Coronavirus threw it off with outbreaks (people can’t go to work) and their response (eg, enhanced unemployment benefits encouraging people not to work) causing disruptions to production, and demand swinging to goods from services all of which is showing up in today’s problems and spikes in, particularly, goods price inflation. As can be seen in the next chart consumer goods spending in the US is 18% above its pre-coronavirus trend whereas spending on services is below trend.
But as the world goes back to work and consumer spending rotates away from goods back to services, the bottlenecks should start to resolve. This may take up to 12 mths to resolve risking more uncertainty and higher bond yields. But ultimately it should settle down. Key to watch for will be: increased goods production; reduced goods demand in favour of services (as per the arrows); and wages growth as this will determine whether one off price increases become entrenched as higher inflation.
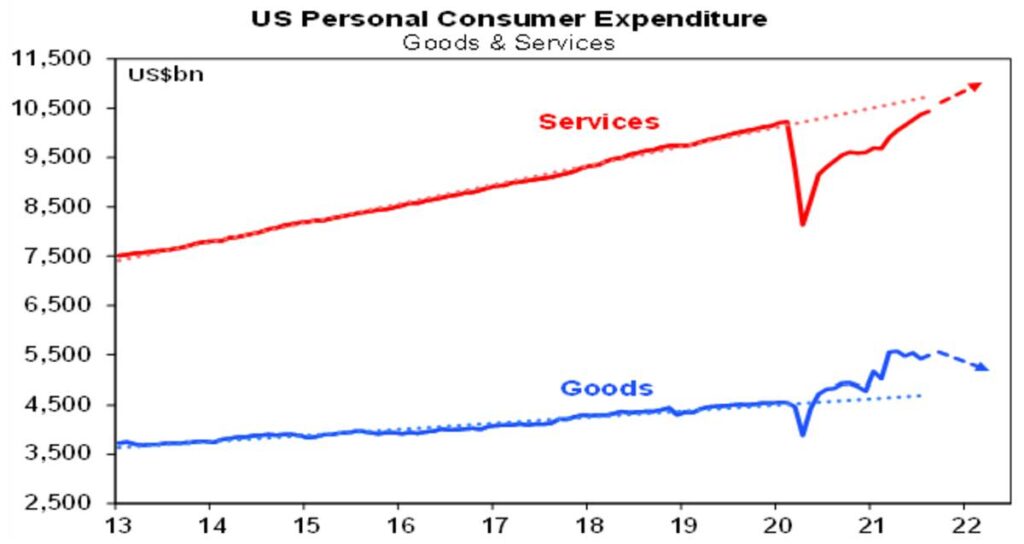
Source: Bloomberg, AMP Capital
Central banks becoming more hawkish
While central banks are heading towards the exits from ultra-easy money, with some moving faster than others, we are a long way from the sort of tight monetary policy that brings economic cycles and bull markets to an end. Some central banks have already started to raise rates, but those that have seen inflation below target in the post-GFC period are lagging as they are wary of jumping at shadows and ending up with inflation back below target again. This includes the Fed, RBA, ECB and the Bank of Japan. While the RBA has already slowed its bond buying and the Fed will likely do the same next month, “tapering” is not tightening as cash is still being pumped into the economy, it’s just at a slower rate
Covid still poses risks, science looks to be winning
The exit from the coronavirus pandemic is proving longer and messier than expected. But there is reason for optimism: new global cases are on the decline again; vaccines while not perfect and requiring booster shots are helping keep serious illness down; new Merck & AstraZeneca drugs looks likely to significantly improve treatment; and after a slow start vaccination rates have surged in Australia (with the help of “vaccination mandates”). Of course, humanity is not yet out of the woods and key risks to watch include: whether cases surge in the northern winter; low vaccination rates in poor countries; the possibility of more transmissible/more deadly mutations; and whether new cases overwhelm the hospital system following reopening in NSW, the ACT and Victoria.
Concluding comment
Some good news on some of these issues in the last week (the debt ceiling and the energy crisis) have helped shares stabilise a bit, but the risk is that the correction has further to run. Historically the main driver of whether we see a correction or even a mild bear market, as opposed to a major bear market (like that seen in the GFC or in March last year), is whether we see a recession. Right now, it remains doubtful that the worry list will be enough to drive a US, global or Australian recession. Ultimately, we see the issues being largely resolved in a way that does not severely threaten global growth and so with global monetary policy likely to remain relatively easy for some time, we continue to see the broader trend in global and Australian shares remaining up, once the correction runs its course.
The Top 100 Companies of the World: The U.S. vs Everyone Else
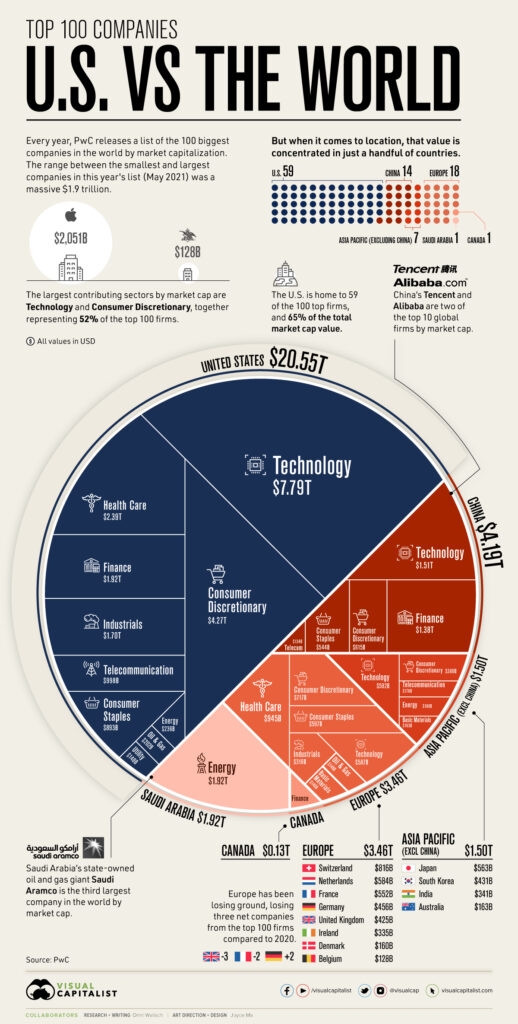
The Top 100 Companies of the World: U.S. vs Everyone
When it comes to breaking down the top 100 companies of the world, the United States still commands the largest slice of the pie.
Throughout the 20th century and before globalization reached its current peaks, American companies made the country an economic powerhouse and the source of a majority of global market value.
But even as countries like China have made headway with multi-billion dollar companies of their own, and the market’s most important sectors have shifted, the U.S. has managed to stay on top.
How do the top 100 companies of the world stack up? This visualization pulls from PwC’s annual ranking of the world’s largest companies, using market capitalization data from May 2021.
Where are the World’s Largest Companies Located?
The world’s top 100 companies account for a massive $31.7 trillion in market cap, but that wealth is not distributed evenly.
Between companies, there’s a wide range of market caps. For example, the difference between the world’s largest company (Apple) and the 100th largest (Anheuser-Busch) is $1.9 trillion.
And between countries, that divide becomes even more stark. Of the 16 countries with companies making the top 100 ranking, the U.S. accounts for 65% of the total market cap value.
|
Location |
# of Companies |
Market Capitalization (May 2021) |
|
United States |
59 |
$20.55T |
|
China |
14 |
$4.19T |
|
Saudi Arabia |
1 |
$1.92T |
|
Switzerland |
3 |
$0.82T |
|
Netherlands |
3 |
$0.58T |
|
Japan |
3 |
$0.56T |
Compared to the U.S., other once-prominent markets like Japan, France, and the UK have seen their share of the world’s top 100 companies falter over the years. In fact, all of Europe accounts for just $3.46 trillion or 11% of the total market cap value of the list.
A major reason for the U.S. dominance in market values is a shift in important industries and contributors. Of the world’s top 100 companies, 52% were based in either technology or consumer discretionary, and the current largest players like Apple, Alphabet, Tesla, and Walmart are all American-based.
The Top 100 Companies of the World: Competition From China
The biggest and most impressive competitor to the U.S. is China.
With 14 companies of its own in the world’s top 100, China accounted for $4.19 trillion or 13% of the top 100’s total market cap value. That includes two of the top 10 firms by market cap, Tencent and Alibaba.
|
|
Company |
Country |
Sector |
Market Cap (May 2021) |
|
#1 |
Apple |
United States |
Technology |
$2,051B |
|
#2 |
Saudi Aramco |
Saudi Arabia |
Energy |
$1,920B |
|
#3 |
Microsoft |
United States |
Technology |
$1,778B |
|
#4 |
Amazon |
United States |
Consumer Discretionary |
$1,558B |
|
#5 |
Alphabet |
United States |
Technology |
$1,393B |
|
#6 |
|
United States |
Technology |
$839B |
|
#7 |
Tencent |
China |
Technology |
$753B |
|
#8 |
Tesla |
United States |
Consumer Discretionary |
$641B |
|
#9 |
Alibaba |
China |
Consumer Discretionary |
$615B |
|
#10 |
Berkshire Hathway |
United States |
Financials |
$588B |
Impressively, China’s rise in market value isn’t limited to well-known tech and consumer companies. The country’s second biggest contributing industry to the top 100 firms was finance, once also the most valuable sector in the U.S. (currently 4th behind tech, consumer discretionary, and health care).
Other notable countries on the list include Saudi Arabia and its state-owned oil and gas giant Saudi Aramco, which is the third largest company in the world. Despite only having one company in the top 100, Saudi Arabia had the third-largest share of the top 100’s total market cap value.
As Europe continues to lose ground year-over-year and the rest of Asia struggles to keep up, the top 100 companies might become increasingly concentrated in just the U.S. and China. The question is, will the imbalance of global market value start to even out, or become even bigger?
China’s Economy Is Reeling From Successive Punches: Eco Week – Bloomberg
China is counting the cost of a multiple whammy of hits to its economy, from a crackdown on the property market and an energy crunch to stringent virus controls and soaring commodity prices.
The cumulative impact will show in gross domestic product for the third quarter due on Monday, with growth forecast to slow to 5% from 7.9% in the previous three months. Further illustrating that picture will be monthly industrial and investment data the same day, revealing the severity of electricity shortages last month.
China’s slowdown will ripple across Asia and the rest of the world, knocking commodity markets like steel and iron ore that are reliant on the country’s construction activity.
With Beijing tightening its grip on the property market as part of a broader effort to tackle financial risks, real-estate sales and prices are already falling.
Meanwhile, a power shortage last month curbed factory production, pushing the purchasing managers index down enough to signal a manufacturing contraction for the first time since the pandemic started — even if frontloaded export orders for Christmas could have offset some of that.
Beijing will likely still meet its modest full-year growth target of more than 6%, meaning authorities may be in no rush to pump in stimulus. The People’s Bank of China refrained from injecting liquidity into the financial system on Friday, while asking lenders to keep credit to the real estate sector “stable and orderly.”
Premier Li Keqiang sounded a confident note in a speech on Oct. 14, saying China has “risen up to the challenges” including severe flooding and a complex international environment.
“Growth levelled off a little bit” in the third quarter, he said. “But for the whole year, we have the confidence and the ability to meet our overall development targets.”
I hope you have enjoyed this week’s read, have a great week.
Regards,
Chris Hagan,
Head, Fixed Interest and Superannuation
JMP Securities
Level 1, Harbourside West, Stanley Esplanade
Port Moresby, Papua New Guinea
Mobile (PNG):+675 72319913
Mobile (Int): +61 414529814