25 July, 2022
Hello and welcome to this week’s JMP Report
Due to staff movement issues we are unable to provide you with our complete market coverage.
On the equity front, Fridays close was as follows
BSP 12.41
CCP 1.85
CPL .95
KAM 1.00
NCM 75.00
NGP .70
SST 35.46
STO 19.10
PNGX/ASX dual listed stock
BFL – $4.98 +13c
KSL $0.88 +2c
NCM – $19.26 18.67 +59c
STO – $7.03 +4c
In the interest rate market we have seen further softening in the short end with bids not meeting the stock on offer. It appears the excess liquidity has washed through the market and the uptick we are seeing in the yields is certainly indicating this. The 364 day auction average result was 4.14% and undersubscribed by 110mill.
And in the gentleman’s market, the results from last week’s GIS auction were a little mixed with bids in the 2yr to 10yr ranging from 5% to 6.8%. The market was undersubscribed by K7.5 mill.
And something a little different;
|
Gold Standard $US54.55 ( Down $0.53 / 0.96%) $AU79.18 ( Down $0.58 / 0.73%)
|
What we’ve been reading this week
Booming Carbon-Credits Market Took Hit as Stocks Sold Off
Rising interest rates upended bets that soaring demand would push prices higher
By Shane Shifflett

Money is a sticking point in climate-change negotiations around the world. As economists warn that limiting global warming to 1.5 degrees Celsius will cost many more trillions than anticipated, WSJ looks at how the funds could be spent, and who would pay.
When stocks started to tumble early this year, the booming market for carbon credits fell too, as speculators cashed out on bets that demand from companies looking to reduce their emissions would keep prices rising.
The average price for carbon credits peaked in early February at $13.10, according to the energy-data firm OPIS. But in March, as inflation rose and surging energy prices dimmed global economic prospects, prices fell to an average of $8.17, OPIS data shows.
Carbon credits are used by companies seeking to effectively offset their greenhouse-gas emissions. The credits fund projects that lower carbon in the atmosphere or avoid emitting additional carbon, such as preserving or planting trees or funding renewable- power projects. Thousands of companies have pledged to reduce their emissions, potentially creating huge demand for the credits.
“Lots of speculative money came in at a faster rate than end user demand, and a lot of hot hands either wanted to realize a profit or get out,” said Kevin McGeeney, chief executive officer of SCB Group, a commodities broker focused on the carbon markets.
There were reasons for the downturn other than rising interest rates. Oil and gas traders had bulked up their carbon-trading desks last year ahead of a United Nations climate conference at which world leaders agreed on broad guidelines on how countries and companies can trade credits internationally. Higher interest rates made their leveraged trades less profitable. A flood of new credits hit the market as prices rose.
The downturn was unexpected because the carbon market hasn’t historically moved with equities, Mr. McGeeney said. When it did move, the more-speculative or lower-quality credits fell the most, just as riskier stocks typically drop more when the overall market declines.
Credits have become a lucrative business, boosting supply. Most credits are ultimately bought by companies to offset their emissions. These are considered retired and stop trading. Credits can trade hands multiple times before being retired.
Purchases by corporations and others peaked in the fourth quarter of 2021 at 70 million carbon credits, according to data from Allied Offsets, a firm that tracks projects and credits on the voluntary carbon market. One carbon credit effectively offsets one ton of carbon emissions. Activity slowed in the first half of the year as prices fell, though purchases are on track to exceed 2021 levels, the data shows.
The selloff hit futures contracts for carbon credits the hardest while prices for credits delivered in over-the-counter trades typically used by large companies to help meet their climate pledges remained steady and in some cases appreciated, said Jennifer McIsaac, director of market analysis at ClearBlue Markets.
Vaughan Lindsay, CEO of Climate Impact Partners, a global developer of carbon-reduction projects and carbon credit broker, said: “There was a real surge in demand driven by consumer and investor pressure on corporates. Corporations woke up to the fact that consumers are making purchase decisions on climate credentials and also to investor pressure saying, ‘We think highly carbonized business models are risky.’”
More carbon credits will likely be needed in the coming decades. Over 1,200 companies set emissions-reductions targets approved by a third-party validator. Companies with the most ambitious goals are creating sustained demand for typically more expensive credits issued by forestry and other nature-based projects, said Guy Turner, CEO of Trove Research, a data-analysis and advisory firm focused on climate.
The voluntary carbon market, in which these companies buy credits, is separate from government-mandated markets in Europe, California and elsewhere where polluters such as utilities can buy credits if they exceed emissions limits.
The downdraft in prices this year caused the market to stratify as values for high-quality, nature-based credits such as those produced by projects that absorb carbon from the atmosphere continued to appreciate, while bargain credits such as those produced years ago by wind farms and other projects lost value, said Micah Macfarlane, commercialization lead at Carbon Direct, an investment, advisory and software firm focused on carbon management.
One company investing in pricier nature removals is Apple Inc. The tech company purchased 667,000 credits in May, according to a Wall Street Journal analysis of a registry that certifies carbon credits.
About 57% of those credits come from a project planting trees on barren hills in several of China’s southwestern provinces, according to the project’s description on that registry. The estimated price of a credit from this project bounced between $15 and $18 in March through June, according to Allied Offsets data, up from $3.68 last November.
By comparison, the average estimated price of a credit produced by projects encouraging low-carbon transportation alternatives traded for an average of $4.87 in the second quarter of 2022, down from $7 in the fourth quarter of 2021, a Journal analysis of Allied Offsets data shows.
”The world has decided corporate emitters will use offsets as a part of their path to carbon neutral and net zero, and we’re seeing demand can be reflected in retirements, and they are going up,” Mr. McGeeney said.
TOP 20 GOLD PRODUCING COUNTRIES AND GOLD OUTLOOK
London-based consulting group Metals Focus have released their 2022 Gold Focus report which assesses global gold production over the past year. 2021 saw a 3% overall increase in mining output from 2020 to 2021. The group is predicting only 1.7% increase in the present year. Present levels are still just below 2019 levels despite the spot price of gold rising significantly over the past three years. There is no talk (yet) of peak gold production, but it may well be just around the corner.
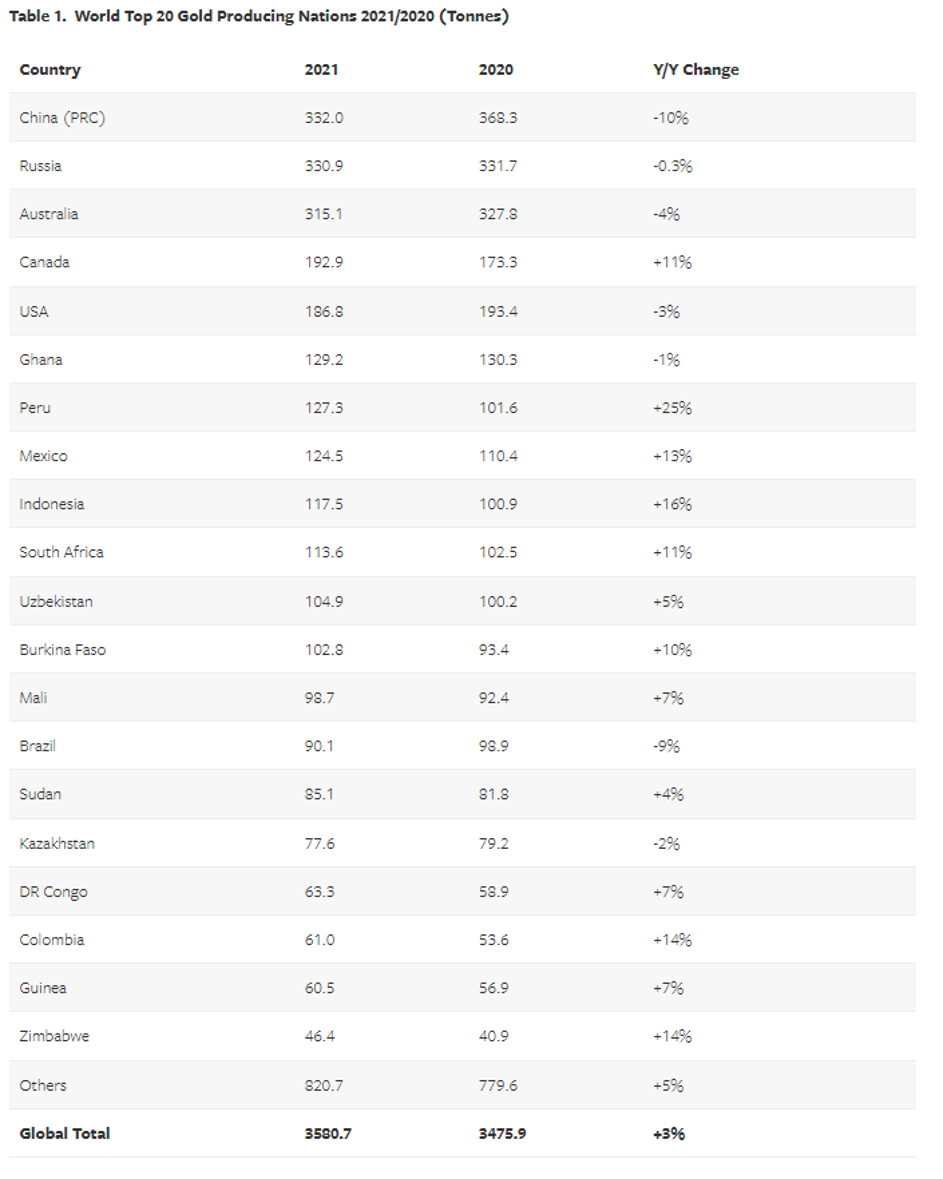
Source: Metals Focus
China, Russia and Australia are the three major global producers, all producing well over 300 tonnes in 2021. With reported Chinese gold production down, Russia may well overtake China for top spot with Australia well within striking distance. Australia’s production and reserves still in the ground may be one of the factors behind Australia’s lack of physically held gold bullion. According to the RBA, Australia has 80 tonnes located at the Bank of England which we covered earlier this month: Gold Rush 2.0 and Australia’s Reserves.
China’s reduced output would be the shutdowns of major mines in Shandong Province in 2021. While many of those mines have started work again, it still opens the door to Russia and Australia to catch up. It goes without saying that some of the most sensitive information a country can share is ‘how much gold do you have’, and ‘where is it?’ As a result any unverified statistics coming out of China need to be taken with a troy ounce of salt.
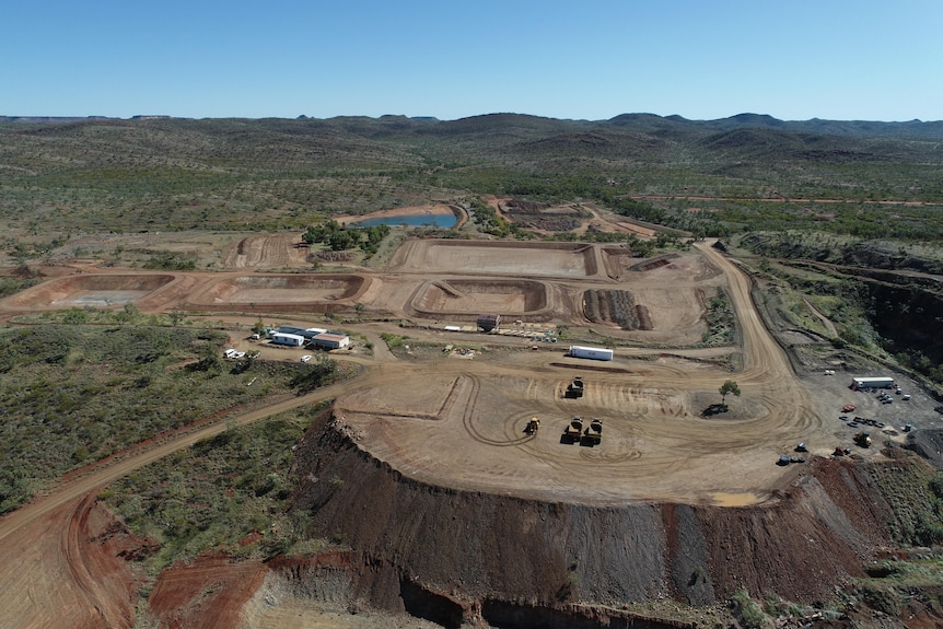
Australia with approximately 10% of global output is likely to get another boost with yet another major mining district getting a reboot: Mount Freda near Cloncurry. Known as ‘The Golden Mile’, the Cloncurry region is home to eight high grade gold mines that were deserted in 1991 when the gold price fell below $240 an ounce. The ounces in the ground are now well worth the mining costs with Mount Freda owned by Tombola gold set to reach first pour by the end of the year.
The gold mining industry is a major contributor to the nation’s GDP, but labour shortages are cited by companies as the major factor holding projects back
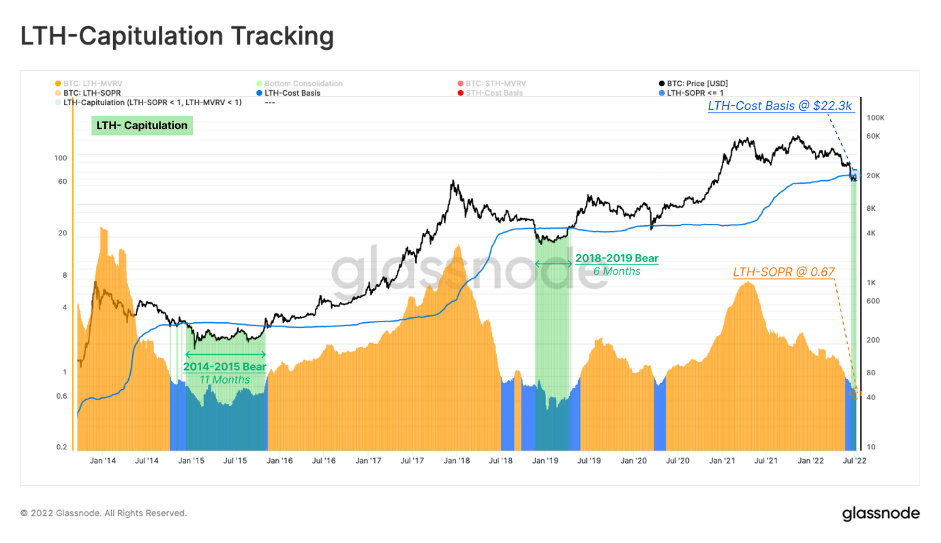
WILL LONG-TERM BTC HOLDERS SURRENDER?
Ainslie Bullion
Bitcoin prices continue to consolidate around the US$20k range this week, as the market digests the extreme downside volatility of June. Prices traded higher, opening at a weekly low of $18,971, and peaking at $22,230.
With the market now down over 75% from the all-time-high, even the strongest and longest-term Bitcoin holders are feeling the pressure. Long-Term Holders and Miners are in the spotlight this week, as the market attempts to find a bottom amidst persistent macroeconomic uncertainty.
With the loss of the $30k price level, miners and long-term holders (LTHs) have come under extreme stress. We can look at their profitability on two fronts; their actualised losses (spending) and unrealised losses (coins held below cost basis) to get an idea of their ongoing capitulation.
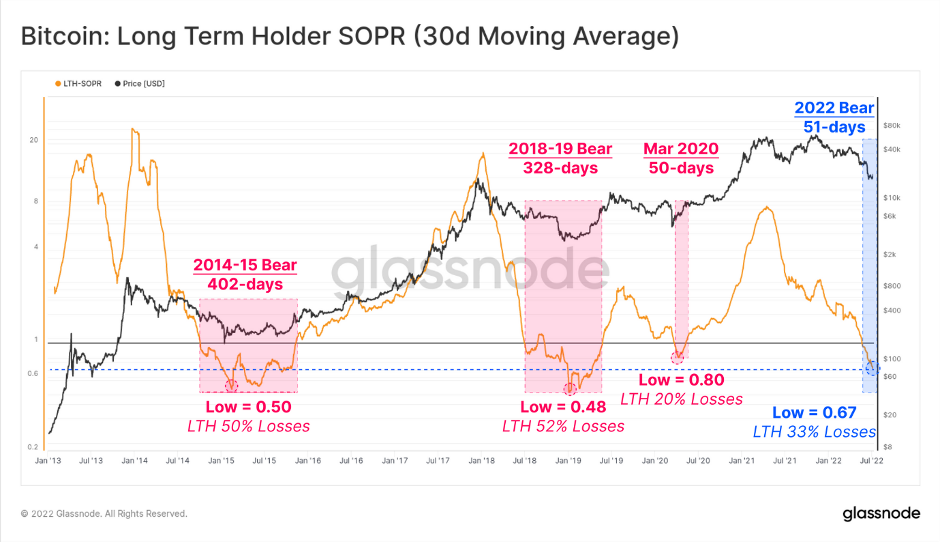
Long-Term Holder Spent Output Profit Ratio (LTH-SOPR) is a metric that indicates the profit ratio captured by LTHs (i.e. a value of 2.0 means LTHs are spending coins at a price that is 2x their cost basis). Therefore, when LTH-SOPR is less than one, these players realise losses or spend coins at a price below their cost basis.
LTH-SOPR is currently trading at 0.67, indicating the average LTH spending their coins is locking in a 33% loss.
Long-Term Holder Cost Basis estimates the average price long-term holders paid for their coins. Hence, as the market value falls below the LTH-Cost Basis, this cohort can be considered to be in aggregate loss. Similarly, LTHs are currently underwater on average, holding an aggregate unrealised loss of -14%.
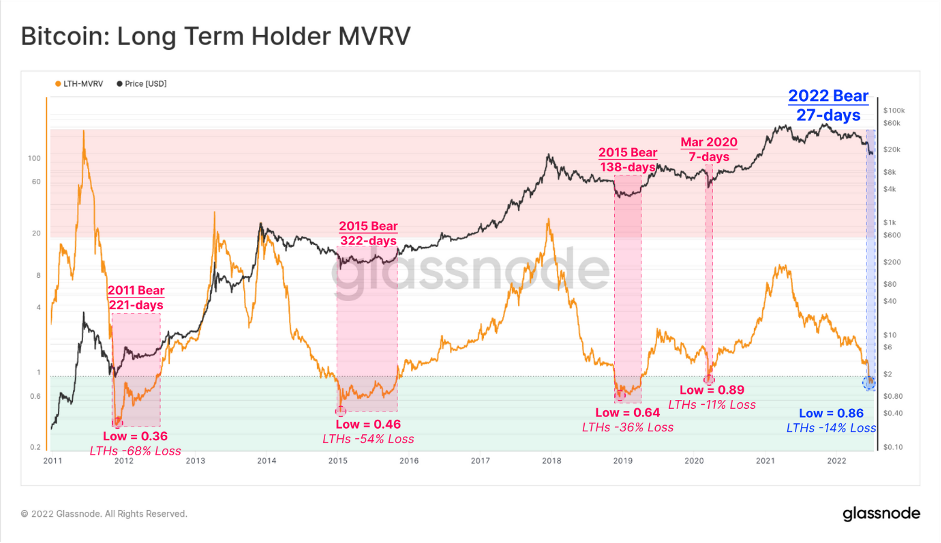
The following chart combines these concepts and shows intervals that satisfy both conditions (in green). These moments are where LTHs are both underwater on held coins, and locking in losses based on their spending. In combination, this indicates there is an increased probability that a LTH capitulation is underway.
With the current value of LTH-SOPR at 0.67 and the LTH-Cost Basis at $22.3k, it means LTHs are realising an average of -33% losses on each spent coin, despite spot prices only being ~6% below their cost basis. This signifies that LTHs who acquired coins at much higher are the primary spenders at the moment, and those who still hold coins from the 2017-20 cycle (or earlier) are largely sitting tight.
A consequence of capitulation events is an immediate redistribution of coins to new buyers, who are often classified as Short-Term Holders at first. Over time, however, the dominance of Long-Term Holders amongst the supply tends to increase, as fair-weather speculators are flushed from the market.
The bottom formation is often accompanied by LTHs shouldering an increasingly large proportion of the unrealised loss. In other words, for a bear market to reach an ultimate floor, the share of coins held at a loss should transfer primarily to those who are the least sensitive to price, and with the highest conviction.
This is the result of two mechanisms:
- The exiting of entities with weak conviction (Short-Term Holders).
- The gradual transfer of coins to entities with strong conviction, who are relatively price-insensitive (Long-Term Holders)
In the depths of previous bear markets, the proportion of supply that was held by LTHs, and at a loss, reached above 34%. Meanwhile, the proportion held by STHs declined to just 3% to 4% of supply. At the moment, STHs still holds 16.2% of the supply in loss, suggesting that freshly redistributed coins must now go through the process of maturation in the hands of higher conviction holders.
The present market structure has many hallmarks of the later stage of a bear market, where the highest conviction cohorts, the long-term holders and the miners, are under tremendous pressure to surrender.
I hope you have enjoyed our Report this week, stay safe and keep well.
Regards,
Chris Hagan.
Head, Fixed Interest and Superannuation
JMP Securities
Level 1, Harbourside West, Stanley Esplanade
Port Moresby, Papua New Guinea
Mobile (PNG):+675 72319913
Mobile (Int): +61 414529814