12 September, 2022
Welcome to this week’s JMP Report
Last week we saw three stocks trading on the local exchange BSP, CCP, and STO. BSP traded 1, 499,502 shares unchanged at K12.41, CCP traded 11,269 shares at K1.85 while STO had 16,484 shares trading unchanged at K19.10. Refer details below.
WEEKLY MARKET REPORT | 5 September, 2022 – 9 September, 2022
| STOCK | QUANTITY | CLOSING PRICE | CHANGE | % CHANGE | 2021 FINAL DIV | 2021 INTERIM | YIELD % | EX-DATE | RECORD DATE | PAYMENT DATE | DRP | MARKET CAP |
| BSP | 1,499,502 | 12.41 | – | – | K1.3400 | K0.34 | 11.61 | FRI 23 SEPT | MON 26 SEPT | FRI 14 OCT | NO | 5,317,971,001 |
| KSL | 0 | 3.00 | – | – | K0.1850 | K0.0103 | 7.74 | MON 5 SEPT | TUE 6 SEPT | TUE 4 OCT | NO | 64,817,259 |
| STO | 16,484 | 19.10 | – | – | K0.2993 | K0.26760 | – | MON 22 AUG | TUE 23 AUG | THU 22 SEPT | – | – |
| KAM | 0 | 1.00 | – | – | – | – | 10.00 | – | – | – | YES | 49,891,306 |
| NCM | 0 | 75.00 | – | – | USD$0.075 | K0.70422535 | – | FRI 26 AUG | MON 29 AUG FEB | MON 29 AUG | – | 33,774,150 |
| NGP | 0 | 0.70 | – | – | – | – | – | – | – | – | – | 32,123,490 |
| CCP | 11,269 | 1.85 | – | – | K0.134 | – | 6.19 | THU 16 JUN | FRI 24 JUN | THU 28 JUL | YES | 569,672,964 |
| CPL | 0 | 0.95 | – | – | – | – |
– |
THU 5 APR | THU 14 APR | FRI 29 APR | – | 195,964,015 |
Dual listed stock – PNGX and ASX
BFL – $5.20 Steady
KSL – .88c – down 4c
NCM – 17.65 +70c
STO – $7.85 +6c
Our order book has us as nett buyers of BSP, KSL, CCP and STO.
On the interest rate front, we saw 364 day TBills average 4.01% at this week’s auction, with the Bank offering K196million, leaving the market oversubscribed by K221million. Expect rates to drop further in the short term.
And something a little different;
|
Gold: Silver Ratio 91.95 AUD/USD 0.6757 Gold $US1,710 ( Down $8/0.46%) $AU2,530 ( Down $9/035%) Silver $US18.60 ( Up $0.09 / 0.48%) $AU27.52 ( Up $0.16 / 0.58%) Platinum $US876 (Up $18/2.09%) $AU1,296 ( Up $28/2.20%)
|
What we’ve been reading this week
China’s economy is in bad shape and could stay that way for a while.
Analysis by Laura He, CNN Business
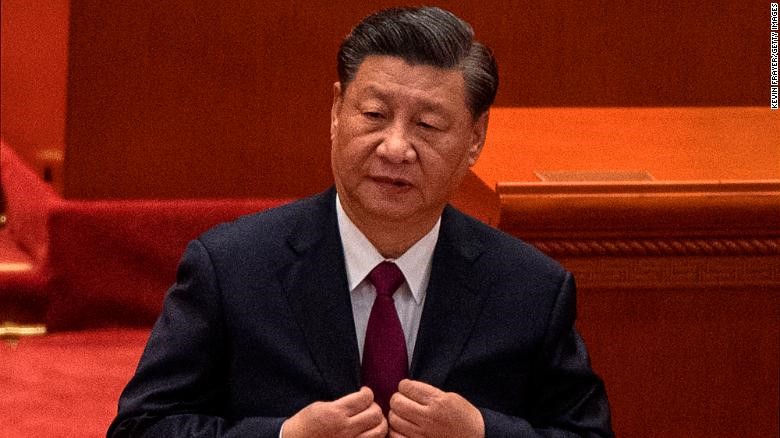
Chinese leader Xi Jinping pictured in Beijing on April 8, 2022.
Hong Kong (CNN Business)China is beset by severe economic problems. Growth has stalled, youth unemployment is at a record high, the housing market is collapsing, and companies are struggling with recurring supply chain headaches.
The world’s second biggest economy is grappling with the impact of severe drought and its vast real estate sector is suffering the consequences of running up too much debt. But the situation is being made much worse by Beijing’s adherence to a rigid zero-Covid policy, and there’s no sign that’s going to change this year.
Within the past two weeks, eight megacities have gone into full or partial lockdowns. Together these vital centres of manufacturing and transport are home to 127 million people.
Nationwide, at least 74 cities had been closed off since late August, affecting more than 313 million residents, according to CNN calculations based on government statistics. Goldman Sachs last week estimated that cities impacted by lockdowns account for 35% of China’s gross domestic product (GDP).
Chinese cities rush to lockdown in show of loyalty to Xi’s ‘zero-Covid’ strategy
The latest restrictions demonstrate China’s uncompromising attitude to stamping out the virus with the strictest control measures, despite the damage.
“Beijing appears willing to absorb the economic and social costs that stem from its zero-Covid policy because the alternative — widespread infections along with corresponding hospitalizations and deaths — represents an even greater threat to the government’s legitimacy,” said Craig Singleton, senior China fellow at the Foundation for Defense of Democracies, a DC-based think tank.
For Chinese leader Xi Jinping, maintaining that legitimacy is more vital than ever as he seeks to be selected for an unprecedented third term when the Communist Party meets for its most important congress in a decade next month.
“Major policy shifts before the party congress appear unlikely, although we could see a softening in certain policies in early 2023 after Xi Jinping’s political future has been assured,” Singleton said.
Chinese company profits are collapsing like its 2020 again
“Even then, the Party is running short on both time and available policy levers to address many of the most pressing systemic threats to China’s economy,” he added.
The economy will continue to worsen in the next few months, said Raymond Yeung, chief Greater China economist for ANZ Research. Local governments will be “more inclined to prioritizing zero-Covid and snuffing out the virus outbreaks” as the party congress approaches, he added.
Tightening of Covid restrictions will hit consumption and investment during China’s “Golden September, Silver October,” traditionally the peak season for home sales.
72% of economists expect a US recession by the middle of next year
In the meantime, a sharp slowdown in the global economy doesn’t bode well for China’s growth either, Yeung said, as weakening demand from the US and European markets will weigh on China’s exports.
He now expects Chinese GDP to grow by just 3% this year, missing Beijing’s official target of 5.5% by a wide margin. Other analysts are even more bearish. Nomura cut its forecast to 2.7% this week.
No exit until early 2023?
More than two years into the pandemic, Beijing is sticking to its extreme approach to the virus with forced quarantines, mass mandatory testing, and snap lockdowns.
The policy was deemed successful in the early stage of the pandemic. China managed to keep the virus at bay in 2020 and 2021 and stave off the large number of deaths many other countries suffered, while building a quick recovery following a record contraction in GDP. At a ceremony in 2020, Xi proclaimed that China’s success in containing the virus was proof of the Communist Party’s “superiority“ over Western democracy.
But the premature declaration of victory has come back to haunt him, as the highly transmissible Omicron variant makes the zero-Covid policy less effective.
However, giving up on zero-Covid doesn’t seem like an option for Xi, who this year has repeatedly put greater emphasis on defeating the virus than rescuing the economy.
China’s top leaders have gone silent on the country’s economic goals
In a trip to Wuhan in June, he said China must maintain its zero-Covid policy “even though it might hurt the economy.” At a leadership meeting in July, he reaffirmed that approach and urged officials to look at the relationship between virus prevention and economic growth “from a political point of view.”
“Beijing has sought to cast its zero-Covid policies as evidence of the Party’s strength, and therefore, by extension, Xi Jinping’s leadership,” Singleton said.
Any change in approach may not come until next year, and even then it’s most likely to be very gradual, said Zhiwei Zhang, president and chief economist for Pinpoint Asset Management.
“It will be a long process,” he said, adding that Hong Kong — where quarantine and testing rules for visitors have recently been relaxed — could be “an important leading indicator for what will happen in the mainland.”
Another dismal quarter
While Beijing seems unwavering on its zero-Covid strategy, the government has rolled out a flurry of stimulus measures to boost the flagging economy, including a one trillion yuan ($146 billion) package unveiled last month to improve infrastructure and ease power shortages.
The government is trying to achieve “the best possible outcome” for economic growth and jobs while sticking to zero-Covid, but it’s “very hard to balance the twin goals,” said Yeung from ANZ.
Recent data suggest the Chinese economy could be headed for another dismal performance in the third quarter. GDP expanded by only 0.4% in the second quarter from a year earlier, slowing sharply from growth of 4.8% in the first quarter.
Official and private sector surveys released last week showed China’s manufacturing industry contracting in August for the first time in three months, while growth in services slowed.
China’s growth forecasts slashed as heatwave hits industrial heartlands”The picture is not pretty, as China continues to battle the broadest wave of Covid infections thus far,” Nomura analysts said in a research report on Tuesday.
Jobs and property issues
China’s job market has deteriorated in the past few months. Most recent data showed that the unemployment rate among 16 to 24 year-olds hit an all-time high of 19.9% in July, the fourth consecutive month it had broken records.
That means China now has about 21 million jobless youth in cities and towns. Rural unemployment isn’t included in official figures.
“The most worrying issue is jobs,” said ANZ’s Yeung, adding that youth unemployment could climb to 20% or higher.
Other economists say more job losses are likely this year as social distancing measures hurt the catering and retail industries, which in turn piles pressure on manufacturers.
China slashes mortgage rate to tackle deepening property crisis
The deepening property market downturn is another major drag. The sector, which accounts for as much as 30% of China’s GDP, has been crippled by a government campaign since 2020 to rein in reckless borrowing and curb speculative trading. Property prices have been falling, as have sales of new homes.
While there could be a relaxation of zero-Covid rules in 2023, housing policy may not look very different after the party congress.
“We are unlikely to see the economy repeat the previous high growth of 5.5% or 6% for the next two years,” said Yeung.
CNN’s Beijing bureau contributed to this report.
Seven key charts for investors to keep an eye on in assessing the investment outlook
By Dr. Shane Oliver, Head of Investment Strategy and Economics and Chief Economist, AMP
Key points
While we are optimistic on a 12-month horizon, shares are at high risk of further falls and a re-test of their June lows in the short term given hawkish central banks, heightened recession risks and geopolitical risks.
Seven key global charts worth keeping an eye on by investors are: global business conditions PMIs; US inflation and our Pipeline Inflation Indicator; unemployment & underemployment; inflation expectations; earnings revisions; the gap between earnings yields and bond yields; and the US dollar.
Introduction
Shares remain vulnerable in the short term. They had a nice rebound from their June lows into their mid-August highs recovering just over half of their earlier decline (which was -24% for US shares and -16% for Australian shares) helped by mostly good earnings reports and hopes some central banks, including the Fed, may be getting closer to a “dovish pivot”. But as the US share market got overbought and hit resistance at its 200-day moving average, shares then became vulnerable to ongoing central bank hawkishness and recession risks and so have pulled back. While we are optimistic on a 12-month horizon, shares are at high risk of further falls and a re-test of their June lows in the short term: central banks including the RBA remain hawkish & a long way from a “dovish pivot” – as evident in recent comments by various central banks and their officials; recession risks remain high running the risk of more earnings downgrades; September has been the weakest month of the year for US and Australian shares particularly when markets are in a downtrend; and geopolitical risks remain high over Taiwan, Ukraine and the US mid-terms. This note takes a look at seven charts we see as critical for the outlook.
Chart # 1 – global business conditions PMIs
US and global shares have already entered a bear market (as defined by a top to bottom fall of 20% or more). But whether that bear is deep or mild and whether Australian shares will be drawn into it, critically depends on the severity of the economic downturn. For Australian shares, severe setbacks (or “grizzly bear” markets) tend to be associated with US recession, particularly over the last 50 years, with the exception of the 1987 crash. Of course, it’s the same for the US share market. So whether global recession and in particular US recession can be avoided or if not that its mild will have a significant impact on how far share markets fall. Our assessment is that global growth will slow (to around 2% next year) – but while Europe will probably go into recession the US and global economy overall can probably avoid it. Global Purchasing Managers Indexes (PMIs) – surveys of purchasing managers at businesses – will be a key warning indicator. They have slowed but are not at levels associated with recession. For our upbeat 12-month view they need to stabilise around 45 to 50, as opposed to falling below that.
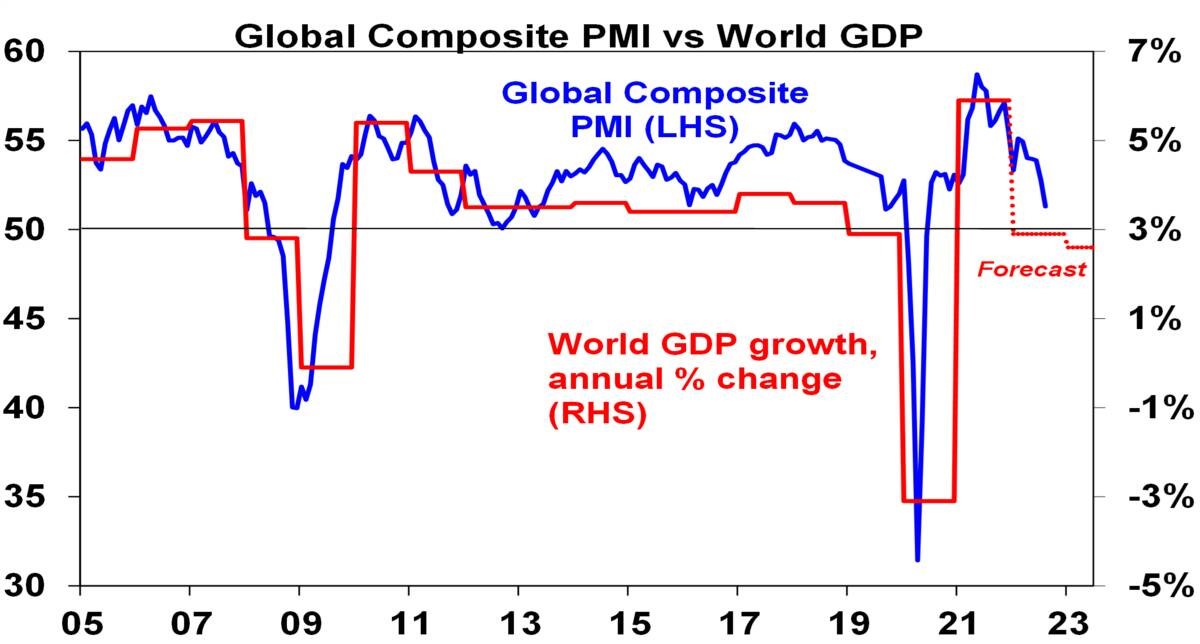
Source: Bloomberg, AMP
Chart 2 – global/US inflation
A lot depends on how far central banks – and in particular the Fed – raise interest rates. For now, central banks remain hawkish. But there is some light at the end of tunnel as pipeline inflation pressures (outside of the Eurozone energy crisis) are moderating: global business surveys show improving delivery times, falling order backlogs and falling price and cost pressures; and freight rates, metal, oil and food prices are off their highs. This is consistent with an ongoing decline in our Pipeline Inflation Indicator which in turn is consistent with US inflation having peaked. The key is that our Inflation Indicator continues to fall leading a further decline in US inflation – if so, this should start to allow the Fed to slow down its tightening in the next six months and then turn dovish. Europe and Australia are about six months behind the US.
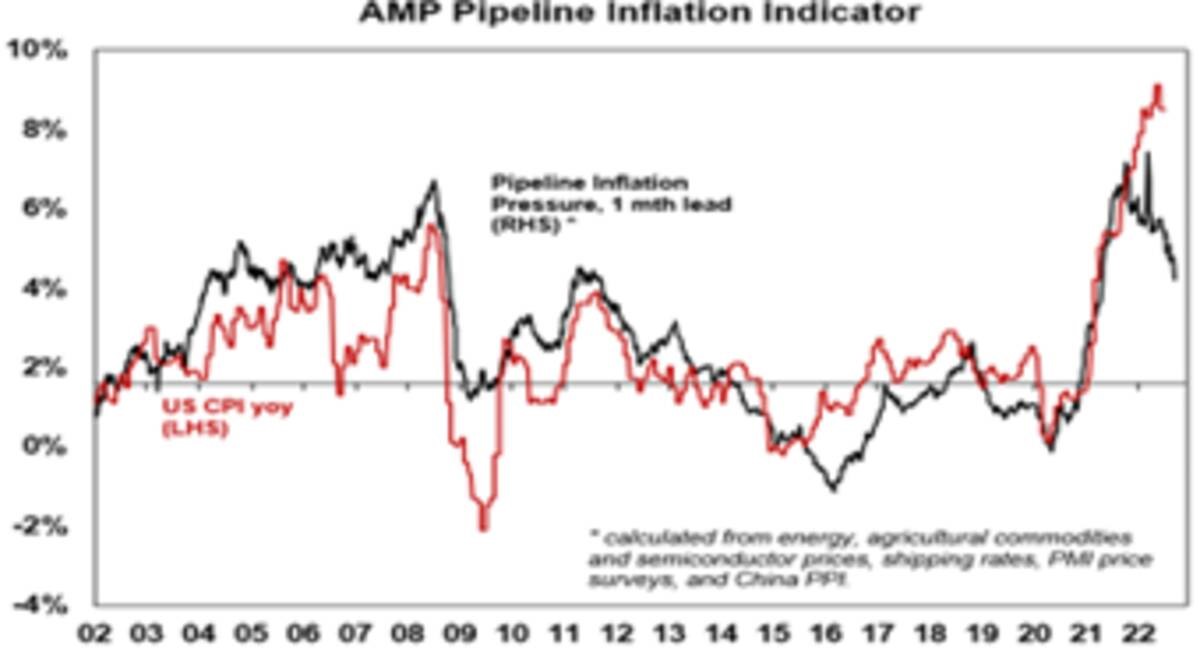
Source: Bloomberg, AMP
Chart 3 – unemployment and underemployment
Also critical in this regard is unemployment and underemployment. Both have fallen to levels in the US and Australia, suggestive of very tight labour markets and accelerating wages pressure. This is already clear in the US, with wages growth rising to around 5-6%, and starting to become evident in Australia. Stronger wages growth is desirable but if it goes too far it could run the risk of a wage price spiral which would make it harder to get inflation back down without much higher interest rates. So ideally, we need to see some cooling of jobs markets with ideally a stabilisation in unemployment. Not too hot, not too cold. This might be starting to become apparent in the US.
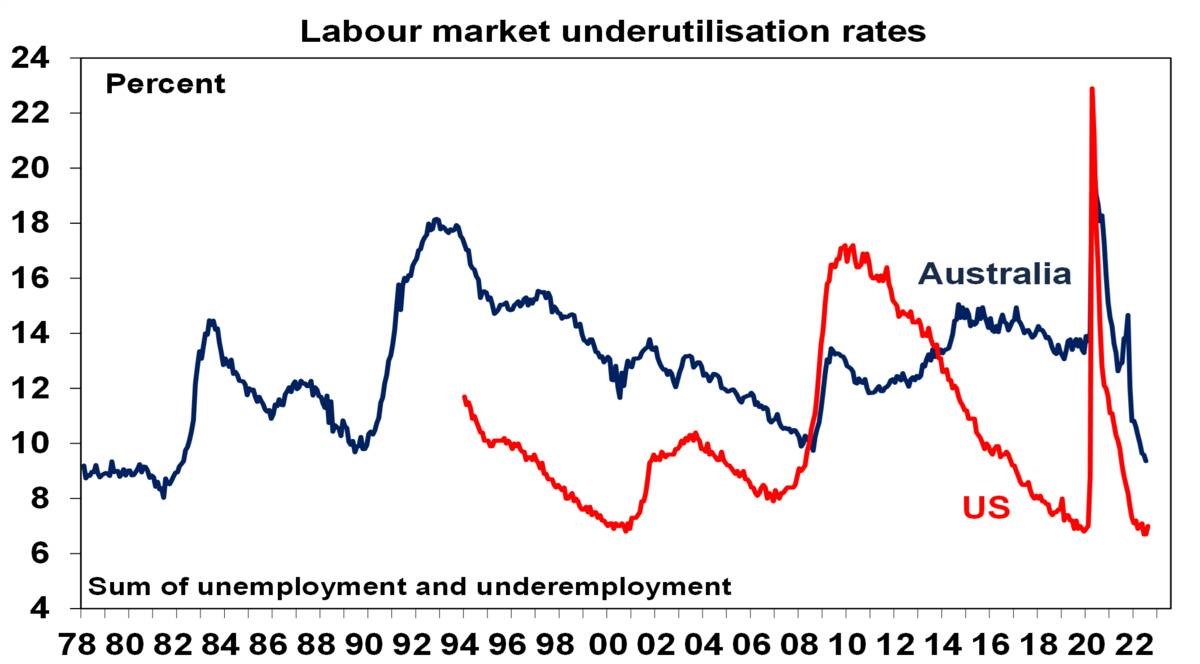
Source: Bloomberg, AMP
Chart 4 – longer term inflation expectations
The concept of inflation expectations or inflation psychology sounds rather academic but the experience of the 1970s tells us that the longer inflation stays high, the more businesses, workers and consumers expect it to stay high and then they start to behave in ways – in terms of wage demand, price setting and tolerance for price increases – which can perpetuate it (in the absence of a deep recession). Short-term (1-2 years ahead) inflation expectations are now clearly high, but the good news is that longer-term inflation expectations remain reasonably low. In the US, a long-watched survey of consumers by the University of Michigan shows that inflation expectations for five years or more ahead are around 3%. This is consistent with 2% or so inflation and suggests the job of central banks is far easier today than say in 1980 when the same measure was around 10%. The key is that it stays low.
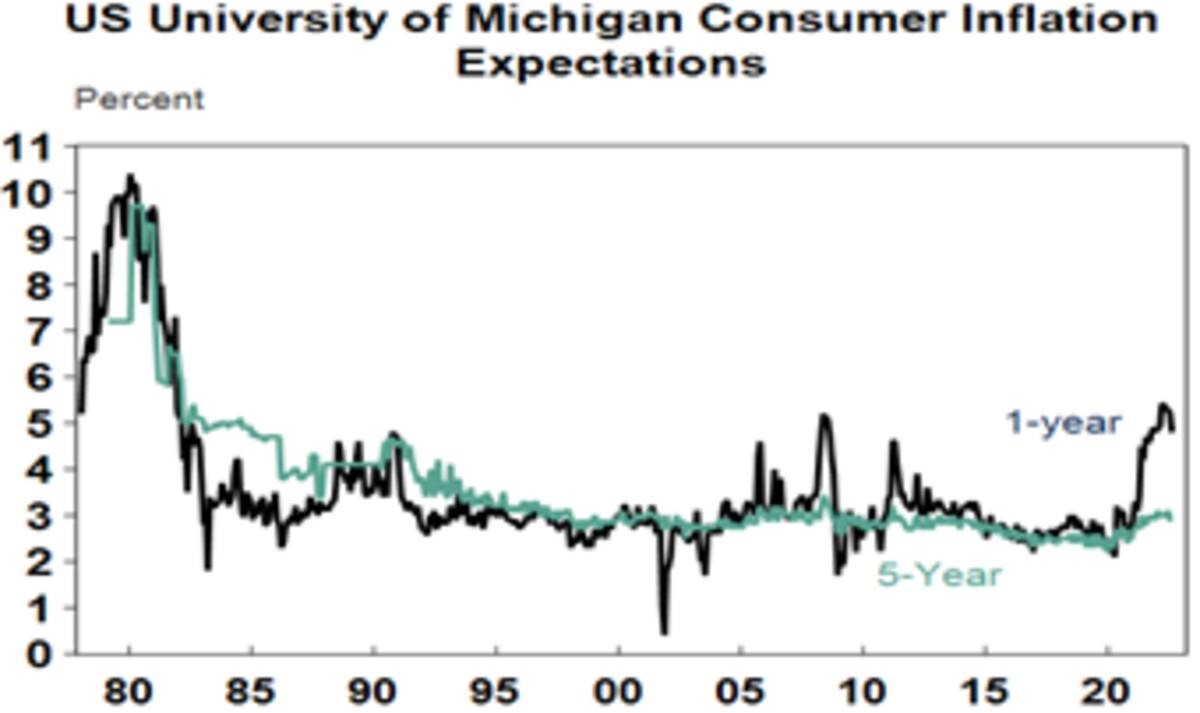
Source: Macrobond, AMP
Chart 5 – earnings revisions
Consensus earnings growth expectations for the year ahead are currently around 8% for the US and globally and around 6.5% for Australia. This marks an understandable slowdown from the last year. They have been getting revised down lately – see the next chart. They still look a bit too high though, so a further deterioration in earnings revisions is likely, but a deterioration on the scale seen in the early 1990s, 2001-03 in the US and 2008 would be bad news.
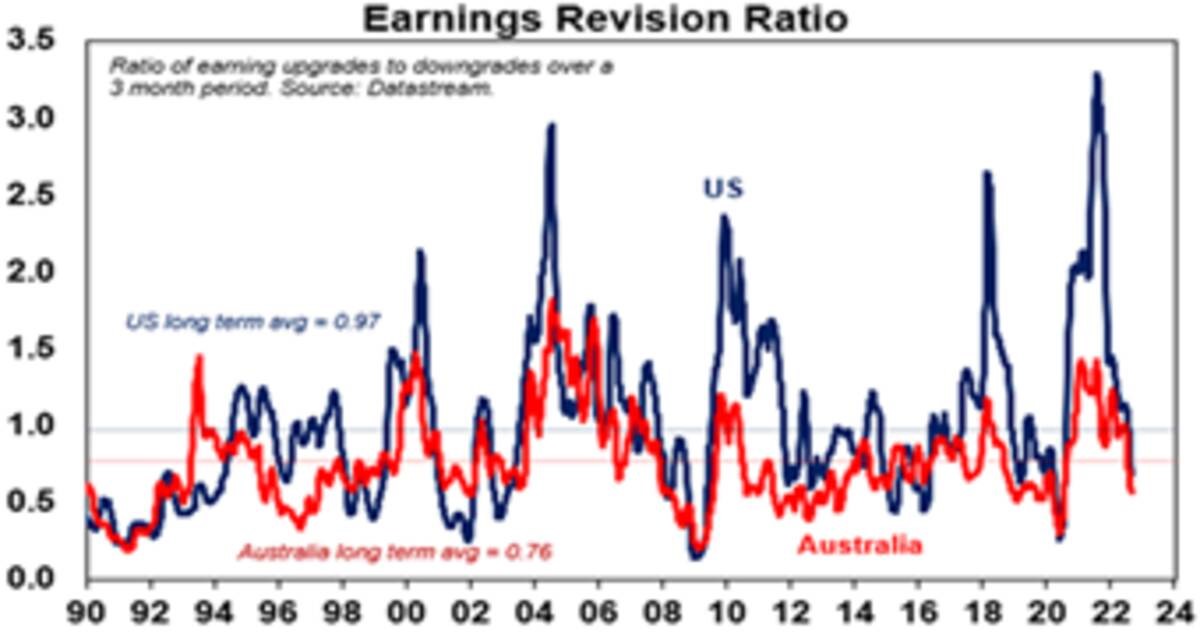
Source: Bloomberg, AMP
Chart 6 – the gap between earnings yields & bond yields
So far this year the continuing strength in company profits and a fall back in share prices has left share market valuations relative to bonds (as measured by the gap between earnings yields and bond yields – which is a proxy for shares’ risk premium) looking ok, despite the rise in bond yields. However, the gap has narrowed to its lowest since the GFC in the US. Compared to the pre-GFC period shares still look cheap. It will be key to watch bond yields (where further rises will make shares less attractive) and earnings downgrades (which would also make shares less attractive).
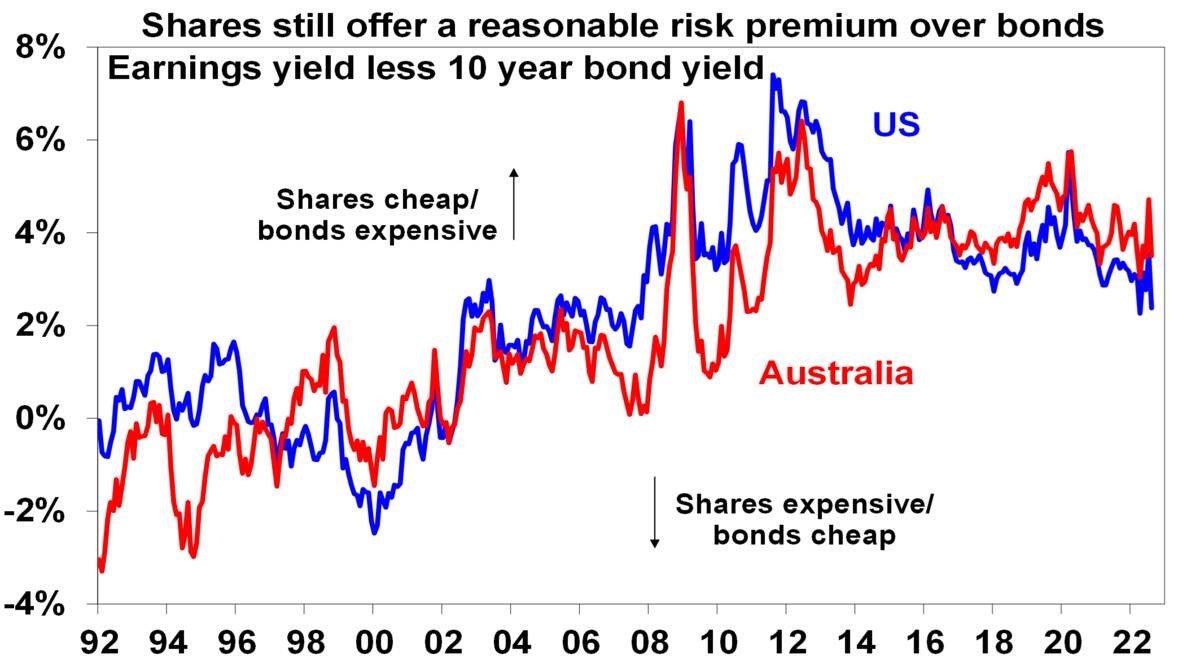
Source: Thomson Reuters, AMP
Chart 7 – the US dollar
The US dollar is a counter cyclical currency, so big moves in it are of global significance and bear close watching. Due to the relatively low exposure of the US economy to cyclical sectors like manufacturing, the $US tends to be a “risk-off” currency, ie, it goes up when there are worries about global growth and down when the outlook brightens. Over the last year the US dollar has surged with safe haven demand in the face of worries about recession and war. This has been accentuated by the Fed raising rates ahead of some other major central banks. If the global outlook starts to improve again this will likely be confirmed by a downswing in the US dollar and a rise in the $A.
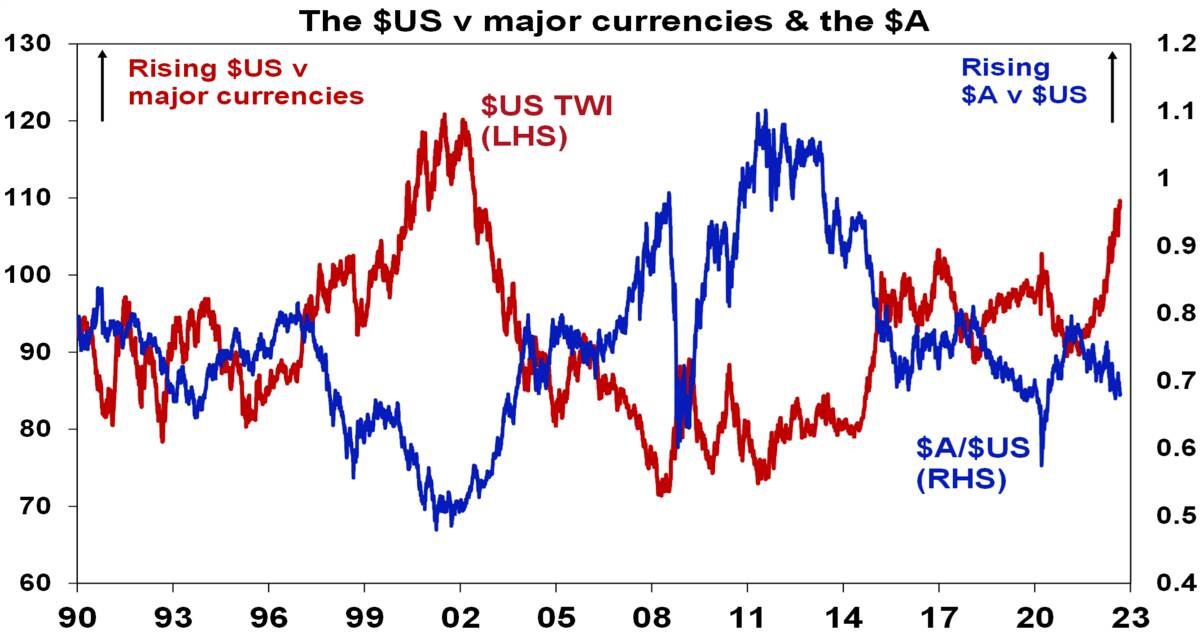
Source: Bloomberg, AMP
Green Hydrogen Project to Be Developed in Australia. Experts Explain What This Means for the Future of Renewable Energy

Green hydrogen project to be developed in Australia. Experts explain what this means for the future of renewable energy.
With heavy investment by international energy firms in the development of green hydrogen projects, this clean energy source could soon be a major new replacement for fossil fuels.
According to Australia’s top-rated auto recyclers, It Matters To You, who offer cash for cars Melbourne-wide, as the need for new energy sources becomes more critical, major players in the oil market and governments around the world are now heavily investing in green hydrogen.
Over the coming decade, it is likely the price of this clean energy source will drop substantially.
It Matters To You says energy firms around the world have been producing hydrogen to use as fuel for years already but due to the high costs involved with green hydrogen projects, this eco-friendly alternative has often been overlooked.
Unlike grey hydrogen, which currently makes up the bulk of the hydrogen market and is produced by steam reforming of natural gas, green hydrogen uses renewable energy to split water into hydrogen and has significantly lower carbon emissions.
The technology currently required to produce green hydrogen is much more expensive when compared with other types of energy production, but that looks set to change.
In June this year, BP announced the purchase of a 40.5% stake in the Asian Renewable Energy Hub. This major renewable energy and green hydrogen project is set to be developed in Australia and has ‘the potential to be one of the largest renewables and green hydrogen hubs in the world,’ according to BP.
It Matters To You explains that the project is expected to produce 26 GW of combined solar and wind power, providing power in the Pilbara region of Western Australia as well as delivering hydrogen and ammonia for both national use and export.
Eventually, the project will annually produce about 1.6 million tonnes of green hydrogen, contributing to BP’s aim of becoming carbon-neutral by 2050.
With a number of other large-scale green hydrogen projects in the pipeline around the world, renewable energy looks likely to become a major green energy source in the coming decade.
Specialising in car removal Melbourne-wide, It Matters To You cares about the impact car wrecking has on the environment, thinking about where the waste of tomorrow may end up. To learn more about environmentally sustainable auto recycling, contact It Matters To Green Hydrogen
We hope you have enjoyed the read, we would like to thanks Dr. Shane Oliver, AMP, Green Hydrogen, CNN for their articles and our Friends at Ashurst for their copy of Brief on Decarbonisation Edition 3.
Download | Brief on Decarbonisation Edition 3
If you would like to discuss your investment needs, please feel free to give me a call
Have a great week,
Regards,
Chris Hagan.
Head, Fixed Interest and Superannuation
JMP Securities
Level 1, Harbourside West, Stanley Esplanade
Port Moresby, Papua New Guinea
Mobile (PNG):+675 72319913
Mobile (Int): +61 414529814