
PNGX Equities • Fixed Income • Investor Education
Activity fades to K6.56m; KSL slips as the tape quietens
JMP Weekly Report | Week ending 31 July 2026
|
Trading Value
K6.56m
−62% on prior week
|
Total Volume
1,153,304
−76% on prior week
|
Stocks Traded
5 of 10
BSP, KSL, CCP, CPL, PLC
|
Market Yield (LTM)
5.50%
Flat week on week
|
Download PDF >>
Weekly Trade Commentary
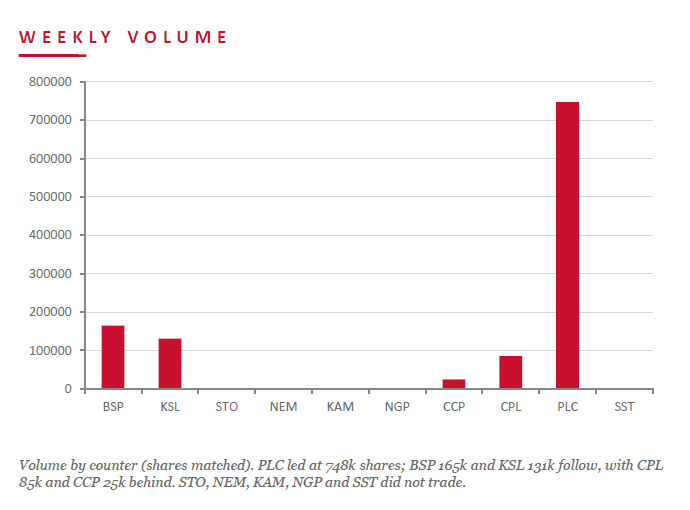
Activity faded sharply after the BSP-heavy week, with turnover falling 62% to K6.56 million and volume dropping 76% to 1.15 million shares. Five counters traded. PLC led on volume at 747,581 shares, steady at K1.48, for K1.11 million. BSP traded 164,985 shares steady at K28.20 for K4.65 million. KSL was the notable mover, falling 17 toea, or 3.6%, to K4.57 on 130,771 shares. CPL rose 10 toea, or 10.5%, to K1.05 on 85,210 shares, while CCP traded 24,757 shares steady at K4.66. STO, NEM, KAM, NGP and SST did not trade.
| Stock | Volume | Close (K) | Value (K) | Change | Change % |
|---|---|---|---|---|---|
| BSP | 164,985 | 28.20 | 4,651,605.40 | — | — |
| KSL | 130,771 | 4.57 | 601,489.56 | −0.17 | −3.59% |
| STO | — | 22.37 | — | — | — |
| NEM | — | 490.00 | — | — | — |
| KAM | — | 2.21 | — | — | — |
| NGP | — | 1.36 | — | — | — |
| CCP | 24,757 | 4.66 | 115,367.62 | — | — |
| CPL | 85,210 | 1.05 | 85,211.07 | +0.10 | +10.53% |
| PLC | 747,581 | 1.48 | 1,106,419.88 | — | — |
| SST | — | 50.00 | — | — | — |
| TOTAL | 1,153,304 | 6,560,093.53 | −0.03% |
Source: PNGX matched on-market trades, week ending 31 July 2026. JMP Securities analysis.
Dividend Yield
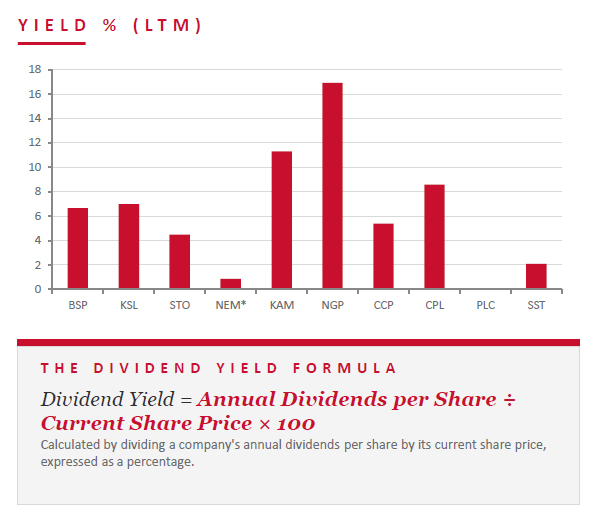
The report states that the market-wide trailing-twelve-month dividend yield held at 4.77% this week, weighted by market capitalisation under the legacy methodology, and remained steady week on week. KSL’s yield rose to 6.98% as its price fell to K4.57, while CPL’s yield eased to 8.57% following its rise to K1.05. NGP continued to lead at 16.91%, followed by KAM at 11.31% and CPL at 8.57%. KSL yielded 6.98%, BSP 6.67%, CCP 5.39%, STO 4.48% and SST 2.10%. PLC remains pre-dividend.
| Stock | Issued Shares | Market Cap (K) | Int 24 | Fin 24 | Int 25 | Fin 25 | Yield |
|---|---|---|---|---|---|---|---|
| BSP | 467,317,665 | 13,178,358,153 | 0.450 | 1.210 | 0.500 | 1.380 | 6.67% |
| KSL | 294,332,296 | 1,345,098,593 | 0.106 | 0.155 | 0.126 | 0.193 | 6.98% |
| STO | 3,261,616,703 | 72,929,749,479 | 0.506 | 0.414 | 0.559 | 0.443 | 4.48% |
| NEM* | 1,097,000,000 | 537,530,000,000 | — | 2.110 | 2.110 | USD $0.520 | 0.86% |
| KAM | 53,259,588 | 117,703,689 | 0.200 | — | 0.250 | — | 11.31% |
| NGP | 45,890,700 | 62,411,352 | 0.040 | 0.120 | 0.040 | 0.190 | 16.91% |
| CCP | 307,931,332 | 1,434,960,007 | 0.120 | 0.121 | 0.121 | 0.130 | 5.39% |
| CPL | 206,277,911 | 216,591,807 | — | — | 0.050 | 0.040 | 8.57% |
| PLC | 860,718,662 | 1,273,863,620 | — | — | — | — | — |
| SST | 31,008,237 | 1,550,411,850 | 0.400 | 0.300 | 0.400 | 0.650 | 2.10% |
| TOTAL / WEIGHTED AVERAGE | 5.50% | ||||||
Key Market Announcements
It was a quiet week for the board, with two filings and both relating to PLC. PLC lodged a notification regarding unquoted securities and, more notably, disclosed that the Papua New Guinea Government had acquired a 13% stake in the Central Lime Project. No other listed company filed during the week.
| Stock | Announcement |
|---|---|
| PLC | Notification regarding unquoted securities – Click here to download |
| PLC | PNG Government acquires 13% stake in Central Lime Project – Click here to download |
Source: PNGX market announcements, 27–31 July 2026.
BPNG Treasury Bill Auction
Auction: 29 July 2026 |
Settlement: 31 July 2026 |
Amount on offer: K270.0 million
| Terms | 63 days | 91 days | 182 days | 273 days | 364 days | Total |
|---|---|---|---|---|---|---|
| Weighted Average Yield | — | — | 4.85% | 5.04% | 5.03% | — |
| Amount on Offer (K’m) | — | — | 20.00 | 50.00 | 200.00 | 270.00 |
| Bids Received (K’m) | — | — | 1.50 | 81.00 | 122.40 | 204.90 |
| Successful Bids (K’m) | — | — | 1.50 | 71.00 | 92.40 | 164.90 |
| Over / (Under) Subscribed (K’m) | — | — | −18.50 | +31.00 | −77.60 | −65.10 |
BPNG Government Bond Auction
No new Government Bond auction was held during the week ending 31 July 2026. The most recent auction was held on 21 July 2026, with settlement on 24 July 2026. K300.0 million was offered, with bids received totalling K325.00 million and successful bids of K305.00 million, resulting in a net subscription of K25.00 million.
| Series | Offer (K’m) | Bids (K’m) | Successful (K’m) | Successful Yield | Weighted Avg | Coupon | Net Subscription (K’m) |
|---|---|---|---|---|---|---|---|
| 2026/5057 – 3 yr | 50.00 | 65.00 | 55.00 | 6.11–6.17% | 6.12% | 6.40% | +15.00 |
| 2026/5058 – 5 yr | 50.00 | 50.00 | 50.00 | 6.43–6.43% | 6.43% | 6.80% | 0.00 |
| 2026/5059 – 7 yr | 50.00 | 60.00 | 50.00 | 6.59–6.59% | 6.59% | 6.90% | +10.00 |
| 2026/5060 – 10 yr | 100.00 | 100.00 | 100.00 | 6.73–6.73% | 6.73% | 7.10% | 0.00 |
| 2026/5061 – 15 yr | 50.00 | 50.00 | 50.00 | 7.13–7.13% | 7.13% | 7.40% | 0.00 |
| TOTAL | 300.00 | 325.00 | 305.00 | +25.00 | |||
Investor Education: Portfolio Management
Portfolio management is the practice of selecting, weighting and continuously adjusting a collection of assets to meet specific investment objectives, including return targets, risk tolerance, time horizon and liquidity needs, while respecting constraints such as mandate limits, regulation, tax and ESG screens. At its core, it is a continuous cycle rather than a one-time decision.
It begins with an Investment Policy Statement that defines the target return, acceptable risk and constraints. Asset allocation then divides capital across asset classes and, within equities, across geographies and sectors. Security selection, portfolio construction and cost-efficient execution follow. Performance and risk are monitored against a benchmark, portfolios are rebalanced and returns are attributed to allocation, selection and timing decisions.
| 01 | Objectives & constraints Define the target return, acceptable risk, time horizon, liquidity requirements and restrictions that guide all portfolio decisions. |
| 02 | Asset allocation Divide capital across asset classes and, within equities, across geographies and sectors. Asset allocation is often the largest driver of portfolio return and volatility. |
| 03 | Security selection & execution Select individual investments and trade the portfolio into place while minimising transaction costs, market impact and slippage. |
| 04 | Monitor, rebalance, attribute Track performance and risk against a benchmark, rebalance to target weights and assess whether returns came from allocation, selection or timing. |
What We’ve Been Reading

Featured Read
Rising global imbalances underscore the need to confront domestic distortions
IMF Blog • Chen & Platzer, IMF Research
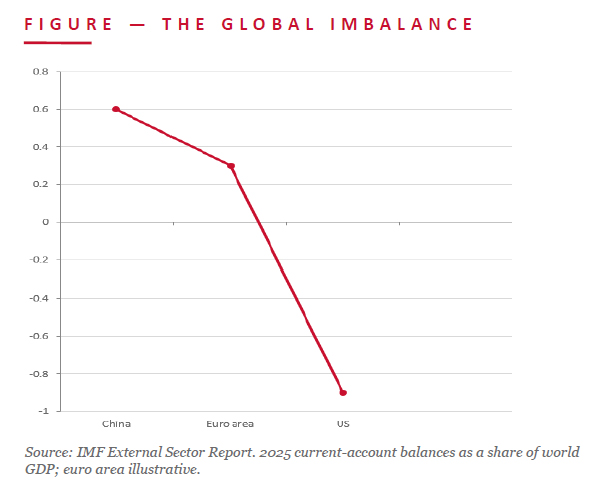
Global current-account balances widened further in 2025, driven mainly by China, whose surplus recorded its largest increase in at least two and a half decades. It rose by around US$300 billion to approximately 0.6% of world GDP. The United States deficit narrowed by US$69 billion but remained the world’s largest at about 0.9% of global GDP.
The IMF also found that excess imbalances had widened. Weak Chinese investment and high precautionary saving contributed to China’s surplus, while low US saving and a deep fiscal deficit drove the US shortfall. Persistent excess balances can create inefficient resource allocation, financial vulnerabilities and the risk of a disorderly correction.
JMP read: For Papua New Guinea, the imbalances debate flows through commodity demand and the kina. China’s domestic investment outlook matters for metals and LNG exports, while changing US–China trade patterns influence where global trade flows are directed. The IMF’s conclusion also reinforces the importance of domestic saving, investment quality and fiscal discipline for small open economies.
For Further Enquiries
Speak to your equities trader for orders, research questions or market colour.
Benny Takin
Equities Trader – Primary contact, JMP Weekly Report
benny.takin@jmpmarkets.com
+675 7001 9121 / 320 0240
Disclaimer
This report has been prepared by JMP Securities Limited (Capital Market Licence holder, Securities Commission of PNG). It is general information only and does not take into account the objectives, financial situation or needs of any particular person. It is not an offer or solicitation to buy or sell any security. Information is sourced from PNGX, Bank of Papua New Guinea and external publications cited herein, with JMP analysis. While reasonable care has been taken, no warranty is given as to accuracy or completeness; to the maximum extent permitted by law JMP accepts no liability for loss arising from reliance on this material. Investors should obtain independent professional advice before making any investment decision.